Irina Shpolianskaya, Alexei Dolzhenko, Anna Prokhorova and Sergei Glushenko
Rostov State University of Economics, Department of Information Systems and, Applied Informatics, Bolshaya Sadovaya str., Rostov-on-Don, Russia
Volume 2019,
Article ID 826182,
Journal of Software and Systems Development,
11 pages,
DOI: 10.5171/2019.826182
Received date: 28 February 2018; Accepted date: 7 September 2019; Published date: 25 September 2019
Academic Editor: Petr V Nikitin
Cite this Article as:
Irina Shpolianskaya, Alexei Dolzhenko, Anna Prokhorova and Sergei Glushenko (2019)," Fuzzy Model for Educational Portal Quality Assessment ", Journal of Software & Systems Development, Vol. 2019 (2019), Article ID 826182,
DOI: 10.5171/2019.826182
Web technologies present incredible opportunities for educational institutions. The academic portal becomes a common environment for the presentation and promotion of the universities educational and scientific competences. The educational portal provides a solution for aggregating content, information systems and educational services of the university for presentation to the end user in the required format. Evaluation of the educational website quality is a prerequisite for its continuous improvement. The quality of the website is quite important in generating customer satisfaction and loyalty. Hence, modeling the educational web portal structure based on the analysis of user perceptions and preferences becomes especially relevant. The aim of this study is to identify the main quality characteristics of the educational website that determine the effective functioning of the system. The problem of educational website quality assessment is presented as a decision-making problem under conditions of uncertainty. The paper introduces a new approach to the problem of educational portal quality evaluation by using fuzzy preference relations and linguistic variables. The use of expert methods and fuzzy logic is proposed to assess the quality of the educational website and the satisfaction of its users. The fuzzy logic technique helps to integrate the effect of qualitative and quantitative indicators and assess user expectations about website quality and how web system meets the user’s requirements.
Nowadays the web has become a pervasive communication medium for all organizations (Cocquebert et al., 2010). The educational portal has become a key tool for developing and promoting the academic, scientific and educational competences of universities (Caglar and Mentes, 2010). The importance of marketing communications for higher education institutions also cannot be overlooked.
The widespread introduction of information technologies is one of the main university’s development strategies that provide a starting point for creating a single information environment on the basis of an educational portal. The educational portal provides a solution for aggregating content, information systems and educational services of the university for presentation to the end user in the required format. The educational website can also be an effective marketing tool to attract consumers of educational services and to form a positive University image. This is crucial for all institutions in conditions of high competition.
A high-quality website is one that meets its owner’s and users’ requirements. Determining the most important factors of an educational website is crucial and helps system designers focus on the factors with the highest weight and identify the best policy to improve website effectiveness (Lin, 2010).
Web technologies on the base of educational portals give universities new tools for interaction with consumers of educational services. The educational portal becomes a single point of interaction of the university with stakeholders: current and future students, teachers and employers.
As a result, there is a problem of the effective organization of educational portals. Understanding and measuring educational web portal quality, including its dimensions, becomes crucial for the development, management, and continuous improvement of the website. The quality of the website is quite important in generating customer satisfaction and loyalty. Therefore, modeling the educational web portal structure, based on the analysis of user perceptions and preferences, becomes especially relevant.
The Problem of User-Perceived Website Quality
Most of the quality models focus primarily on the website usability characteristics not considering other quality factors such as content, performance and system quality. Evaluating the quality of educational websites needs to also take into account the needs of all user groups: students, professors, employees, and parents. Each user group has their own specific requirements and expectations from the website.
There are numerous studies that have primarily approached the problem of website quality from the service quality dimension on the SERVQUAL model. Parasuraman, et al. (1988) developed a research instrument SERVQUAL to capture consumer expectations and perceptions of the service along the five dimensions and 22 items, comprising tangibles, reliability, responsiveness, assurance, and empathy to represent service quality. Later on, Parasuraman et al. (2005) developed the E-S-QUAL, as a scale to measure online service quality. E-S-QUAL, and later E-RecS-Qual, were developed for assessing the service quality of online B2C e-commerce websites. E-S-Qual includes four dimensions: efficiency, system availability, privacy, and fulfillment. The E-RecS-QUAL scale contained three dimensions: responsiveness, compensation, contact.
Aladwani and Palvia (2002) introduced four dimensions of perceived website quality, comprising technical adequacy, specific content, content quality, and appearance. Cristobal et al. (2007) focused on website quality dimensions such as web design, customer service, assurance and order management. Lowry et al. (2008) used the associative network model to describe the brand knowledge and extend information integration theory to explain how branding alliances are able to increase initial trust and transfer positive effects to websites. According to Lowry et al. (2008), the dimensions of Web quality are responsiveness, competence, quality of information, empathy, Web assistance and callback systems.
Olsina and Rossi (2002) designed an instrument WebQEM, which they used to evaluate websites in several domains, including academic websites. The authors considered website characteristics and attributes from a general visitor view point. They rather focused on the user-perceptible website features such as navigation, interface, and reliability. The evaluation process in WebQEM includes specification and aggregation of nonfunctional requirements subjectively based on human expertise and objectively measurable attributes such as broken links, orphan pages, and quickly access pages. Liu and Arnett (2000) considered the factors critical to website success with consumers as the quality of information, service quality, system use, playfulness, and design of the website. Loiacono, Watson, and Goodhue (Loiacono et al., 2002; Loiacono and Deshpande, 2014; Loiacono et. al., 2007) designed an instrument WebQual™, later named as eQual 4.0, to evaluate the retail website quality. The instrument includes three dimensions: usability, information quality, and service interaction. The authors have used the instrument to assess the quality of a number of different types of websites.
Harold Webb and Webb (2004) developed an instrument named SiteQual to assess e-commerce website quality. The use of website quality factors for measurement of consumer expectations and perceptions was suggested. The instrument includes four dimensions: aesthetic design, ease of use, processing speed, and security. A factor analysis was conducted for these purposes. Barnes and Vidgen (2001) identified five dimensions: usability, design, information quality, trust, and empathy, based on exploratory factor analysis. Wolfinbarger and Gilly (2003) developed instrument eTailQ to assess the quality of retail electronic commerce. The instrument includes four dimensions for the measurement of online quality: website design, fulfillment/reliability, privacy/security, and customer service. The analysis suggests that these factors are strongly predictive of customer judgments of quality and satisfaction, customer loyalty, and attitudes toward the website.
Mich et al. developed the 2QCV3Q model to help site owners and developers evaluate website quality and implement these findings into website design. They identified seven quality dimensions: who (Identity), what (Content), why (Services), when (Management), how (Usability), where (Location) and resources (Feasibility) (Mich et al., 2003; Mich et al. 2003).
Educational websites were studied from different perspectives (Chapleo, 2010; Chapleo et al., 2011; Caglar and Mentes, 2012; Lin, 2010; Huang and Huang, 2010). There were several numbers of works related to specific characteristics of an educational website like usability and accessibility. For example, Selim, in his work, focuses on the ease of use and the usefulness of course websites (Selim, 2003). However, the website should also uphold sufficient security levels in communications and meet data protection requirements regarding the privacy.
Previous studies carried out to evaluate the general quality of academic websites are quite a few. The work in (Olsina, 1999) presented some characteristics of the website like usability, functionality, reliability, and efficiency, in the form of the quality tree model. These factors were further divided into subfactors and attributes forming a quality tree, consisting of a total of more than 121 factors.
Models and Methods of Assessment and Improvement of Educational Portal Quality
Educational Web Portal Quality Evaluation Model
Some models for evaluating the website quality determine the website quality requirements with a hierarchical structure. A multicriteria decision-making approach has been proposed to evaluate the influences of these factors (Saaty, 1986; Kostoglou, 2004; Chou and Cheng, 2012). The Analytic Hierarchy Process (AHP) (Saaty, 1986) is one of the most popular decision-making methods that have been widely used for web quality assessment (Yu et al., 2011; Rekik et al., 2016). There are several methods in MCDM techniques, such as ANP (Hsu et al., 2012), TOPSIS (Kabir et al., 2012), DEMATEL (Chen and Chen, 2010), Delphi method (Cebi, 2013) that have been used for website quality evaluation (Rekik et al., 2016; Chou and Cheng, 2012; Kabir et al., 2012; Chen and Chen, 2010). The latter studies consider the problem of evaluating the quality of websites from the fuzzy perspective (Huang and Huang, 2010).
We designed the new framework for educational portal quality evaluation. A set of factors critical to educational website success was examined with the help of designers and consumers to assess the educational portal quality. We propose some general criteria for evaluating the quality of educational websites with 3-dimensions. The dimensions of the criteria are Content Requirements, System Quality Requirements, and Service Quality Requirements.
Content Requirements for the educational website includes relevance of information to user’s queries, completeness and subject specialization (the focus of information materials for the target audience), the uniqueness of educational information, utility and structuredness of content, currency, reliability, accuracy and correctness of the information available on the portal.
Website System Quality that includes: accessibility, security, privacy, navigability, response time (download speed), structure (including information structure, site map, page size), usability (including design, ease of use and convenience of navigational tools, aesthetic qualities, etc.), availability, the ability to be used in all browsers and devices. Educational website design requirements are the website enriched multimedia presentation, brand-driven web page design, etc.
Service Quality Requirements that include: reliability, search, responsiveness and feedback, adaptability and customization, SEO (semantic markup of HTML pages with microdata, Schema.org, tools of Web Analytics, log file analysis).
The website performance analysis was carried out to obtain data for assessing website system and service quality. The following educational website performance indicators were analyzed:
Performance indicators related to user behavior before the acquisition of educational services (the time the user has spent on each page of the site; the time the user spent searching for information; the number of user clicks; the number of pages per visit, etc.).
Website performance indicators (website traffic, the number of site errors from a behavioral perspective; boot time, response time, number of failures, speed, etc.).
Linguistic aspects of the website quality (how the menu item names and field names meet the user’s expectations; the ability to input accurate data; the relevance and usefulness of website content, etc.).
User interface quality indicators (the location of various components of the site’s screen, the color and styling of the site, the effectiveness of the site structure, the search efficiency, the amount of text and graphics on the page, the organization of the dialogue with the user; the presence of the sitemap of the educational site, etc.)
Target indicators that assess whether the elements on the page are targeted to the user. These indicators are defined with the help of questionnaires, mailings, or expert assessments of the site.
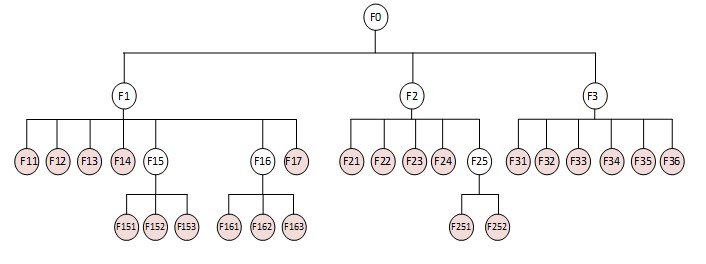
As a result of performance analysis, a hierarchical structure of the Educational Portal Quality Model has been developed (see figure 1):
Fig. 1: Hierarchical structure of the Educational Portal Quality Model
Source: authors’ contributions
The following notations are used in Figure 1: F0 – The integral website quality indicator; F1– System Quality; F11– Accessibility; F12– Security, Privacy; F13 – Navigability; F14 – Response Time; F15 – Website Structure; F151 – Information Structure; F152 – Website Map; F153 – Page Size; F16 – Usability; F161 – Design; F162 – Convenience &Ease of Navigational Tools; F163 – Aesthetic Qualities; F17 – Availability; F2 – Service Quality; F21 – Reliability; F22 – Search; F23 – Responsiveness & Feedback; F24 – Adaptability, Customization; F25 – SEO; F251 – Microdata & Schema.org; F252 – Web Analytics; F3 – Information Quality (Content); F31 – Relevance; F32 – Completeness; F33 – Accuracy; F34 – Uniqueness; F35 – Utility of Content; F36 – Subject Specialization.
The following techniques were used to evaluate the educational portal performance indicators:
Analysis of web data statistics, using web analytics systems like Yandex Metrics, Google Analytics.
Organization of feedback through surveys, questionnaires, and user forms in order to obtain the information about customer satisfaction with their visit experiences.
Examining the ergonomics and usability of the site with the help of Google Website Optimizer, Yandex Webmaster.
Analysis of the user behavior on the site from the log files.
A technical audit of several university websites was carried out to assess their performance. The following features of the competitors’ websites have been analyzed: traffic sources panel; most popular searches and pages; bounce rate; characteristics of the target audience; keyword frequency; website indexing; website positions in search engines; the page speed insights; the presence of microdata markup like Schema.org or Open Graph; the presence of web counters on the site (Google Analytics, Yandex Metric, Open Stat, Live Internet, etc.); social media presence index (SMPI); the presence of a mobile version of the site; relevance; latent semantic indexing of keywords (LSI), level of trust (authority, citation) of the website in search engines (TrustRank or Web of Trust (WOT), etc.).
A Fuzzy Linguistic Method For Educational Portal Quality Assessment
The typical approach to website evaluation process assumes that the human experts express their evaluation judgments by means of numerical values. Sometimes, an expert cannot express his judgments with an exact numerical value. Then, a more realistic approach may be used to express the expert evaluations with the help of linguistic estimates (Herrera-Viedma et al., 2003).
We propose a new approach to the problem of educational portal quality evaluation, which we did in terms of fuzzy preference relations and linguistic assessment variables (Khubaev et al., 2017).
The educational website quality can be formalized as follows:
FMG = ,
where G is a graph, where each vertex Fj (j = 0, …, ND) is associated with linguistic variable xij Î Lj, that describes a specific website quality indicator; L={Lj (j = 0, …, ND)}is a set of linguistic values that variable xij Î Lj takes; P is a fuzzy preference relation; A is an aggregation operator.
When using ternary fuzzy classifier on the scale [0,1] values Lj should be as follows:
{Low level (L), Middle level (M), High level (H)}.
Fuzzy preference relations are defined as follows:
where > denotes strict preferences,≈ denotes indifference.
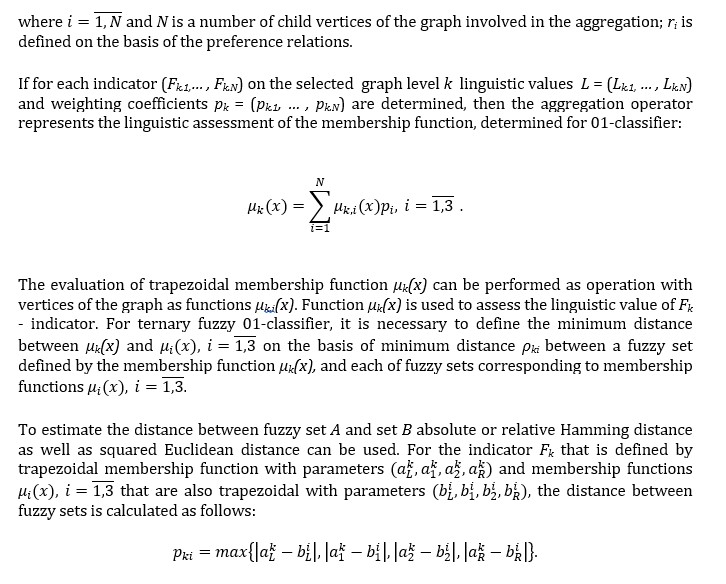
To obtain an integrated linguistic assessment of the website quality, we use the aggregation operator for every non-terminal vertex of the graph. The aggregator uses the assessment of the quality indicators represented as child nodes in the tree. The ordered weighted averaging operator (Yager’s OWA operator) (Yager, 1988) and Fishburn coefficients (Adelson and Fishburn, 1971), as an associated collection of weights, are used for aggregation. The Fishburn coefficients are defined as follows:
The matching value Fk of a specific linguistic level of the ternary scale on 01-classifier is defined as min (pki).
The procedure of quality factors aggregation is to be performed for each not-end vertices down up to obtain the linguistic value of website quality. The formation of the integral website quality indicator F0 for graph G is the aggregation of factors for each of the non-terminal graph vertices from the leaves to the top. The algorithm for integrated quality assessment of the educational website is as follows.
Form a graph G of the website quality indicators with vertices Fj (j = 0, …, ND).
Form a system of preference relations P = {Fi (Φ) ∈ ( >,≈)} between graph vertices on the basis of human expert assessments.
For each of the end vertices in the graph, form a set of linguistic values of factor levels.
For non-end vertices in the graph, apply the aggregation operator to compute their linguistic values.
As a result, we obtain a linguistic evaluation F0 for the root vertex of the graph, which characterizes the integral educational website quality, and for intermediate non-end vertices – the quality characteristics of the site concerning a certain group of indicators, for example, its service quality.
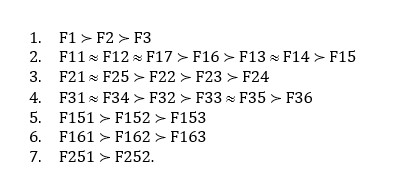
The following example illustrates the proposed fuzzy linguistic approach for educational website quality assessment. Here we consider the hierarchy of the website quality indicators, that you can see in figure 1. The subject matter experts were asked to rank the website quality indicators. As a result, we have obtained the following system of preferences:
For the selected factors, experts have assigned the following values to linguistic variables that define the website quality, as you can see in table 1:
Table 1: linguistic variables for the educational website quality indicators
Experts have used the following set of three labels to provide their preferences:
S={L=Low, M=Medium, H=High}.The results of fuzzy modelling are shown in table 2. Linguistic variable values High (H), Medium (M) and Low (L) are given by trapezoidal membership function.
Table 2: the results of modelling
Source:authors’ calculations
It can be seen that the integral website quality indicator, Service Quality and Information Quality indicators of the educational website can be assessed, as “H – High”, while the level of System Quality indicator, as “M – Medium”. Thus, the analysis of website quality shows an insufficient level of quality of educational web portal structure and usability.
Discussion
This example illustrates the possibility of using a fuzzy approach for assessment of the educational web portal that allows developers to improve its architecture and services. Analysis, testing, and performance evaluation help to improve the educational web portal in accordance with the selected indicators.
The problem of educational website quality assessment is presented as a decision-making problem under conditions of uncertainty. We proposed a fuzzy logic approach for evaluation of educational website quality with qualitative and quantitative indicators. Fuzzy logic models, on the one hand, help to integrate the effect of qualitative and quantitative indicators. On the other hand, they operate with linguistic variables (“low”, “medium”, “high”) that help to assess user expectations about website quality and how web system meets the user’s requirements (Shpolianskaya et al., 2017). This approach is suitable for complex, poorly formalized systems under conditions of uncertainty, which is typical for the website development and improvement problem.
The proposed models of website quality assessment, when implemented as a software, will be integrated into decision-making support system for the design of the educational portal structure. The practical implementation of fuzzy models of website quality assessment allows generating data for further adaptation of the model by tuning the type and parameters of membership functions.
Conclusion
The goal of this study was to define the principles for evaluating the educational portal quality, using a fuzzy logic approach. The problem of assessing the website quality by taking into account the user and system requirements and based on the evaluation of website performance was presented.
We have shown that educational website quality assessment should be based on the integrated quality index. This integrated quality index includes a set of indicators related to system requirements, as well as the website user satisfaction indicators.
The proposed framework can be used to compare the quality of educational websites, to identify priorities for website improvement, and to provide a guideline for designers and developers when creating new websites. The new approach for assessment and improvement of education portals provides an easy and convenient tool based on the processing of expert assessment of quality indicators concerning website performance and user satisfaction with the portal. Regular performance evaluation and continuous improvement of the educational website would help higher education institutions to adapt to changing education markets and consumer preferences.
Aladwani, A M., and Palvia, P C. (2002), ‘Developing and validating an instrument for measuring user-perceived web quality,’ Information and Management, 39(6), 467-476.
Adelson, R M. and Fishburn, P C. (1971), ‘Utility Theory for Decision Making,’ Operational Research Quarterly (1970-1977), 22(3), 308.
Barnes, S J., and Vidgen, R. (2001), ‘An Evaluation of Cyber-Bookshops: The WebQual Method,’ International Journal of Electronic Commerce, 6(1), 11-30.
Caglar, E., and Mentes, S A. (2012), ‘The usability of university websites – a study on European University of Lefke,’ International Journal of Business Information Systems,11(1), 22.
Cebi, S. (2013), ‘Determining importance degrees of website design parameters based on interactions and types of websites,’ Decision Support Systems,54(2), 1030-1043.
Chen, J., and Chen, I. (2010), ‘Using a novel conjunctive MCDM approach based on DEMATEL, fuzzy ANP, and TOPSIS as an innovation support system for Taiwanese higher education,’ Expert Systems with Applications, 37(3), 1981-1990.
Chou, W., and Cheng, Y. (2012), ‘A hybrid fuzzy MCDM approach for evaluating website quality of professional accounting firms,’ Expert Systems with Applications, 39(3), 2783-2793.
Chapleo, C. (2010), ‘What defines “successful” university brands?,’ International Journal of Public Sector Management, 23(2), 169-183.
Chapleo, C., Durán, M V., and Díaz, A C. (2011), ‘Do UK universities communicate their brands effectively through their websites?,’ Journal of Marketing for Higher Education, 21(1), 25-46.
Cocquebert, E., Trentesaux, D., and Tahon, C. (2010), ‘WISDOM: A website design method based on reusing design and software solutions,’ Information and Software Technology, 52(12), 1272-1285.
Cristobal, E., Flavián, C., and Guinalíu, M. (2007), ‘Perceived e-service quality (PeSQ),’ Managing Service Quality: An International Journal, 17(3), 317-340.
Herrera-Viedma, E., Peis, E., Olvera, M D., Herrera, J C., and Montero, Y. H. (2003), ‘Evaluating the Informative Quality of Web Sites by Fuzzy Computing with Words,’ Advances in Web Intelligence Lecture Notes in Computer Science, 62-72.
Hsu, T., Hung, L., and Tang, J. (2012), ‘A hybrid ANP evaluation model for electronic service quality,’ Applied Soft Computing, 12(1), 72-81.
Huang, T C., and Huang, C. (2010), ‘An integrated decision model for evaluating educational web sites from the fuzzy subjective and objective perspectives,’ Computers and Education, 55(2), 616-629.
Kabir, G., Hasin, M. and Akhtar, A. (2012), ‘Comparative analysis of TOPSIS and fuzzy TOPSIS for the evaluation of travel website service quality,’ International Journal for Quality Research, 6(3), 169-185.
Khubaev, G N., Shpolianskaya, I Yu., Dolzhenko, A I., Scherbakov, S M., and Efimov, E N. (2017), ‘Evaluating the Effectiveness of Management Information Systems for Small and Medium-sized Enterprises: a User Satisfaction Approach,’ European Research Studies Journal, 20 (3B), 116 – 129.
Kostoglou, V., Papathanasiou, J., Moschidis, O., and Ladopoulou, P. (2014), ‘A comparative analysis of Greek universities presence on the World Wide Web using an analytical MCDM methodology,’ International Journal of Multicriteria Decision Making, 4(3), 279.
Lin, H. (2010), ‘An application of fuzzy AHP for evaluating course website quality,’ Computers and Education, 54(4), 877-888.
Liu, C., and Arnett, K P. (2000), ‘Exploring the factors associated with Web site success in the context of electronic commerce,’ Information and Management,38(1), 23-33.
Loiacono, E T., Chen, D Q., and Goodhue, D L. (2002), ‘WebQual TM Revisited: Predicting the Intent to Reuse a Web Site,’ Eighth Americas Conference on Information Systems, 301-309.
Loiacono, E T., and Deshpande, S. (2014), ‘WebQual and Its Relevance to Users with Visual Disabilities,’ Lecture Notes in Computer Science HCI in Business, 559-565.
Loiacono, E , Watson, R T. and Goodhue, D L. (2007), ‘The Effect of Web Site Quality on Intention to Revisit and Purchase,’ International Journal of Electronic Commerce, 11(3), 51-87.
Lowry, P B., Vance, A., Moody, G., Beckman, B., and Read, A. (2008), ‘Explaining and Predicting the Impact of Branding Alliances and Web Site Quality on Initial Consumer Trust of E-Commerce Web Sites,’ Journal of Management Information Systems, 24(4), 199-224.
Mich, L., Franch, M. and Cilone, G. (2003), ‘The 2QCV3Q Quality model for the analysis of web site requirements,’ Journal of Web Engineering, 2, 105-127.
Mich, L., Franch, M. and Gaio, L. (2003), ‘Evaluating and Designing Web Site Quality,’ IEEE Multimedia, 10(1), 34-43.
Olsina, L., Godoy, D., Lafuente, G. and Rossi, G. (1999), ‘Assessing the quality of academic websites: a case study,’ New Review of Hypermedia and Multimedia, 5, 81-103.
Olsina, L., and Rossi, G. (2002), ‘Measuring Web application quality with WebQEM,’ IEEE Multimedia, 9(4), 20-29.
Parasuraman, A., Zeithaml, V A. and Berry, L L. (1988), ‘Servqual: a multiple-item scale for measuring consumer perceptions of service quality,’ Journal of Retailing, 64(1), 12-40.
Parasuraman, A., Zeithaml, V A., and Malhotra, A. (2005), ‘E-S-Qual,’ Journal of Service Research, 7(3), 213-233.
Rekik, R., Kallel, I., and Alimi, A M. (2016), ‘Ranking criteria based on fuzzy ANP for assessing E-commerce web sites,’ 2016 IEEE International Conference on Systems, Man, and Cybernetics (SMC).
Saaty, T L. (1986), ‘Axiomatic Foundation of the Analytic Hierarchy Process,’ Management Science, 32(7).
Selim, H M. (2003), ‘An empirical investigation of student acceptance of course websites,’ Computers and Education, 40(4).
Shpolianskaya, I., Dolzhenko, A. and Glushenko, S. (2017), ‘Fuzzy models of web services selection in the development of service-oriented information systems for small and medium enterprises, Ekonomicko-manazerske spectrum, 11(2), 64-75.
Webb, H W., and Webb, L A. (2004), ‘SiteQual: an integrated measure of Web site quality,’ Journal of Enterprise Information Management, 17(6), 430-440.
Wolfinbarger, M., and Gilly, M C. (2003), ‘ETailQ: dimensionalizing, measuring and predicting etail quality,’ Journal of Retailing, 79(3), 183-198.
Yager, R.R. (1988), ‘On ordered weighted averaging aggregation operators in multicriteria decision making,’ IEEE Transactions on Systems, Man and Cybernetics, vol. 18, pp. 183–190.
Yu, X., Guo, S., Guo, J., and Huang, X. (2011), ‘Rank B2C e-commerce websites in e-alliance based on AHP and fuzzy TOPSIS,’ Expert Systems with Applications, 38(4), 3550-3557.