Bucharest University of Economic Studies, Bucharest, Romania
Volume 2022,
Article ID 685346,
Journal of Software and Systems Development,
16 pages,
DOI: 10.5171/2022.685346
Received date: 19 March 2021; Accepted date: 24 February 2022; Published date: 16 May 2022
Academic Editor: Ioana Andreea Bogoslov
Cite this Article as:
Alexandru COCIORVA and Alexandru Lucian VÎLCEA (2022)," Enhanced Monitoring Metrics Using IPCC Framework For E-Business Solutions", Journal of Software & Systems Development, Vol. 2022 (2022), Article ID 685346, DOI: 10.5171/2022.685346
The role of a monitoring solution in verifying and evaluating an e-business application is increasingly important in the context of the development of today’s information society. Thus, the criteria chosen in the development of such an application must be relevant both to the e-business solution and to the context to which it belongs. To align to different valuable monitoring specifications, enhanced metrics must be composed, thus creating a synthetic view of what is critical to be underlined in the functionality of an informatic system. E-business platforms tend to be more complex each year and a visible challenge would be the creation of coherent and relevant metrics, through which malfunctions can be detected in the system and automated mechanisms can perform timely corrections. This paper proposes to describe models of creating and implementing such enhanced monitoring metrics and automated mechanisms.
The complexity of monitoring solutions is constantly increasing with the implementation of cloud systems and the migration of e-business applications in this type of environment. Due to the multiple implications at the e-business level, the applications need the most stable environments possible, which can support the development of components and functionalities meant to serve the business requirements. The high transactional level in direct relation to the increase of the number and complexity of the processes within an application determined the realization of increasingly detailed verifications, which could consider subtle aspects related to the technological framework. Thus, the development and implementation of monitoring solutions has become a mandatory criterion in increasing the performance and efficiency of any application that serves a type of e-business. The criteria for developing such a monitoring application have changed with the development of innovative technologies and the way of working. Today, applications such as True Sight, Nagios, use complex frameworks that involve the implementation of integrations and operations that involve expertise. Due to the development of server-side technologies, applications have become increasingly complex, so there is a need to introduce appropriate monitoring solutions that can correctly evaluate applications developed on technologies such as PHP, Java, ASP, ASP.NET, Perl, Python, JavaScript, Google Apps Script, etc.
Some of the main criteria considered in the model of designing a monitoring application for e-business solutions refer to the possibility to evaluate, verify a certain type of process, a state as well as the data involved. Thus, it is necessary for the monitoring solution to be able to identify in real time as many incidents or changes as occur on the computer system and to be able to trigger a correction mechanism, manual or automatic, to intervene effectively in achieving balance for the whole ensemble.
To achieve this aspect, the indicators must be determined as correctly as possible, based on mechanisms that can capture real situations and changes of any kind that may occur in the system. Indicators or metrics for evaluating the state of the system can refer to infrastructure and associated processes (server status, CPU, disk space, memory, etc.), processes and activities specific to the monitored application (number and type of transactions, user interventions, database status, upload level, etc.). Thus, it can be mentioned that the first set of important criteria in achieving a monitoring solution will be expressed by the following: the relevance of the indicators chosen for the monitored application, the degree and type of quantification of indicators, how to display alerts / alarms, the possibility to make improvements to the system as well as the implementation of integrations, the development of new types of indicators that can increase the relevance of the monitoring solution as a whole, the reporting method and the general benefit brought by the realization and implementation of such a solution.
To cope with latest technology achievements and improve e-commerce rankings for business portfolios from a wide range of domains we need to take into consideration different methods for creating adaptable monitoring solutions, having a well-defined scaling for monitored objects, thus monitoring parameters involved. The monitoring parameters could be defined through a set of procedures and processes known as ITIL, not only for IT companies but applicable to a wide range of domains, from telecom and car industry to simple e-commerce. A subset of the ITIL framework, which can be customized depending on the business needs, is represented by the IPCC set (Incident, Problem, Change and Configuration). Combining monitoring solutions default practices with the IPCC framework could lead to the following (Mihăescu, 2009):
Improve the use of hardware of the company/ organization
Prevent incidents of distinct types through an implementation of a proactive mechanism
Improve the image of the company/ organization, thus improving the customer service
Eliminate time redundancies related to the control of system functionality.
Add the possibility to interconnect systems of different types to detect damages not only on the local system/ site but also on the involved vendors/parties system, having a proper image of an entire ERP. This aspect could lead to a decrease in multi-effect on operations/ activities and reduce multiple risks.
Monitoring is a complex activity that, through its history, especially on computer systems, formed a specific set of common features that must be considered to be relevant for different business activities. Thus, monitoring systems have the following common features (Pandorafms, 2017):
Analysis in real time
System alerts
Notifications
Graphic visualization
Reports generation
Possibility of installing plug-ins
Distinction by type of user
Through this paper, we propose an approach that includes novelty elements in establishing the necessary criteria for the development of a feasible monitoring solution, in accordance with the increased need of e-business solutions. Thus, considering the applicability of the IPCC processes within ITIL, in the working methodology of any IT organization, as well as the type of indicators used in monitoring, we will create a combination that can provide new metrics throughout the verification process and thus improve the performance of the monitored application by a certain percentage. These indicators are used in various contexts, but are not used together. We describe how these indicators make sense together in a monitoring process.
Description of the proposed monitoring indicators
To establish a relevant set of criteria in the development of a monitoring application for an e-business solution, it is necessary to know both the application to be monitored and the framework used in IT process management, at the organizational level. The IPCC framework (Incident, Problem, Change, Configuration) can consider metrics related to:
Incidents (number and types of incidents, reports on degrees of impact, duration of resolving an incident);
Problems (number and types of problems, the degree of impact established depending on the reactive or proactive type of the problem, the duration of solving a problem depending on finding an RCA – Root Cause Analysis, as well as the relationship between a problem and the number of open incidents);
Changes (number and types of changes, the degree of impact established depending on the type of change, those with high impact being associated with the direct impact of the service by lack of functionality of the platform / application for a defined duration of time – downtime changes, the duration of solving a change depending on its type);
Configuration (number and types of configurations, reports from CMDB – Configuration Management Database).
In essence, the elements presented above can be the result of the monitoring activity (through direct reporting of the situation of the IPCC framework, under which the organization operates) are considered a set of output data, but, at the same time, they can represent input data for the realization of other verification indicators, reflected in the monitoring activity. Thus, a direct or indirect connection can be created with the degree of loading of the application at the transactional level or even with the degree of loading of the infrastructure and its related resources. These indicators can be defined according to the business needs of the application and of the organizational context and can represent the basis for the development of some criteria for the realization of efficient monitoring solutions.
Since each IT organization operates according to a certain methodology, integrated ITIL, the relationship between IPCC elements and standard components monitored in an e-business application, the following indicators can be created:
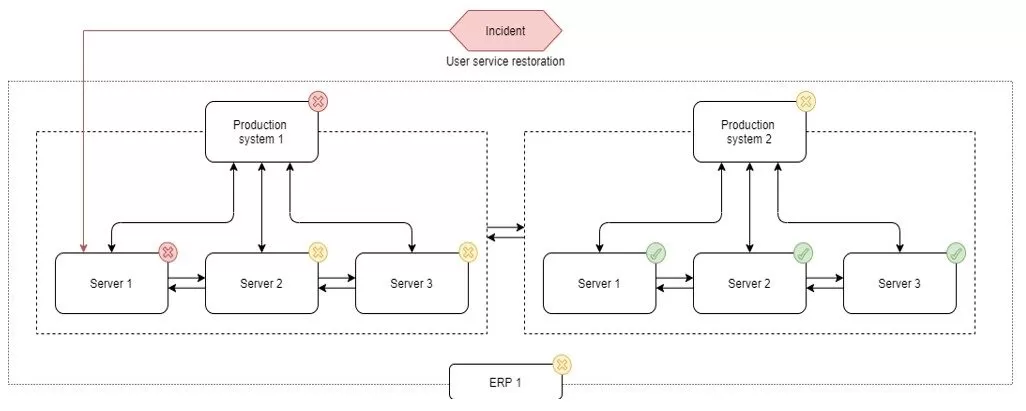
Indicator to assess the degree of impairment of a feature or section within the application, depending on the number of incidents and their type. The degree of damage of a component can be associated with the number of incidents per type, this indicator can increase depending on the increase in the number of severe incidents. Thus, the total degree of damage to a component can be calculated as the ratio between the number of severe incidents and the total number of incidents associated with the component in question; the higher the value of the ratio, the more affected the analyzed component is. It is also important to mention that, in the calculation of this indicator, only service restoration incidents will be considered (User Service Restoration).
Fig 1 – ERP system affected by restoration incident (Authors’ processing)
This type of indicator can be extended to the entire application, but it is more appropriate and relevant to analyze per component. Over time, this indicator can be, however, a rating of the application and can be linked to the next indicator associated with the number and types of problems encountered in evaluating an e-business solution, more appropriate from this point of view.
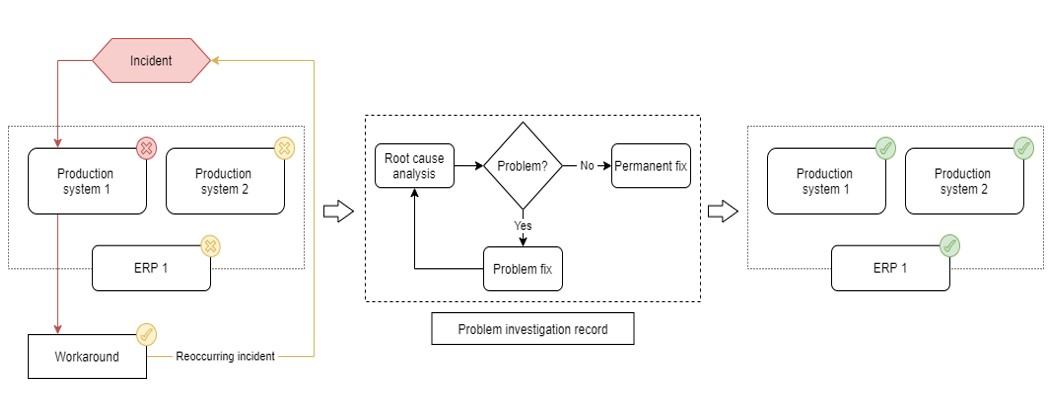
Application rating evaluation indicator in terms of analyzing the number and type of problems that affected the e-business solution. The creation of a problem is justified when a recurring incident affects the application, being found only temporary solutions to resolve the situation, part of an RCA. The application rating evaluation indicator can be calculated as a ratio between the number of proactive issues and the total number of issues. The higher the value of the report, the higher the application rating, but it should be noted that this indicator can only be calculated after a significant period, so that sufficient data on problems and incidents can be recorded.
Fig 2 – Description of a PIR in connection with an ERP system (Authors’ processing)
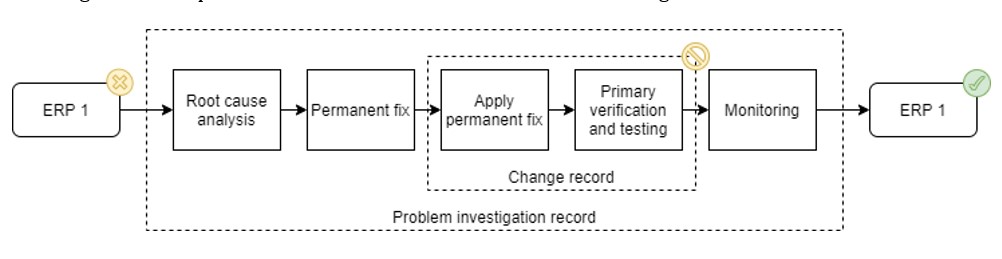
Discontinuity evaluation indicator in ensuring the functionality of the application. This indicator evaluates the stability and validity of the application in terms of analyzing the number and type of changes that have affected the e-business solution. As a degree of relevance, the number and type of structural changes that affected the application are of particular importance in assessing the stability and validity of the e-business solution, as a result, reflected in measuring the discontinuity in the operation of the application. By reporting the number of changes with impact and downtime in the total number of changes, a certain degree of stability and validity of the application can be calculated. The higher the share of CRs (Change Requests) with impact and downtime in the total number of CRs, the higher the indicator for assessing the stability and validity of the application and means a certain discontinuity in ensuring functionality. This metric is a particularly important element in the reports regarding the performance of the organization, of the KPI indicators (Key Performance Indicators), constituting a component to be considered in the realization of the monitoring solution.
Fig 3 – CR applied for permanent fix of the ERP system (Authors’ processing)
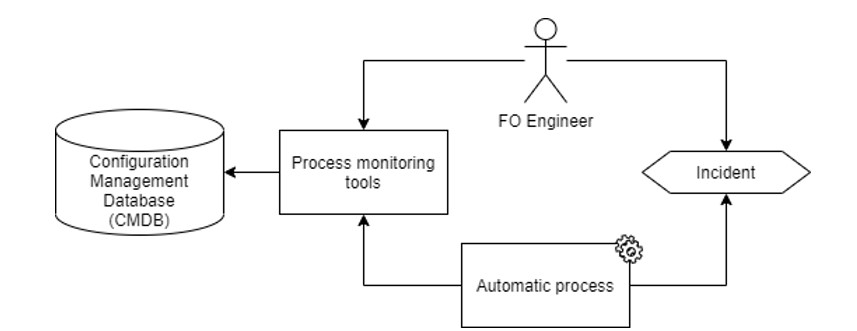
Evaluation indicator of the degree of configuration by CIs (Configuration items). The proposed indicator can be calculated as the ratio between the number of new CIs introduced in the system and the existing Configuration Items. This type of indicator can reflect a certain level of load of the infrastructure as well as of the e-business solution by introducing and configuring in CMDB (Configuration Management Database) elements such as servers, applications, application elements (web server, services, and other web components) but also the links between them. At the level of the e-business solution, the aspects related to the configuration management are important, being possible through monitoring, an evaluation of the elements present in the computer system related to the application. Also, in the Configuration Management section, an indicator can be introduced to evaluate the degree of accessibility and validity of the CIs by reporting the number of affected CIs to the total number of CIs. This indicator may also report some degree of application stability.
Fig 4 – CMDB role in process monitoring and incident handling (Authors’ processing)
All the proposed indicators can compose another indicator to evaluate the total degree of damage to the IT system related to the e-business solution, by presenting elements such as accessibility, discontinuity, degree of loading, degree of impairment, and rating evaluation. The indicators referring to PM (Problem Management) and IM (Incident Management) can form, in their turn, a rating indicator specific to the area affected by the system by evaluating the recurrent incidents and the ways to solve them by creating PRs (Problem Records).
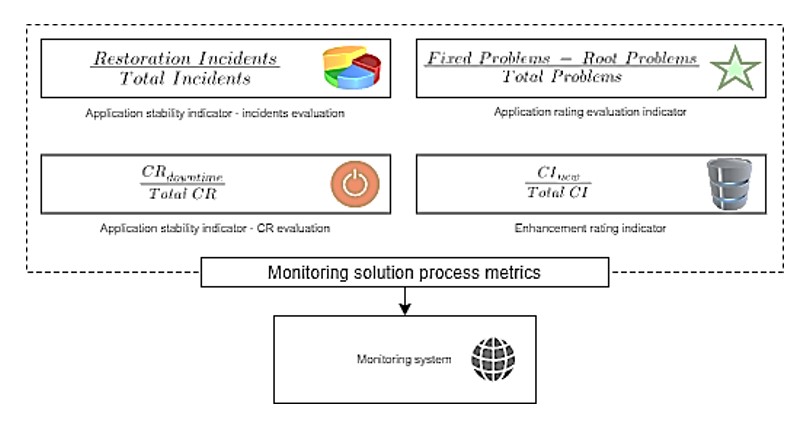
From a graphical point of view, the indicators presented can be framed either in the specific sections of the IPCC area, or on the first page of the monitoring solution, along with other alerts (CPU, memory, server validity, application URL), through graphs accompanied by numerical values. All this framework will have to be presented in a synthetic way so as not to overload the main pages of the monitoring application, thus making the evaluation / verification process difficult.
Fig 5 – Framing of the indicators in the monitoring system (Authors’ processing)
This complex evaluation process can also be encountered at the level of information systems, from which we start in the realization of a monitoring computer system. In the American literature, information systems based on the collection, processing and rendering of information in an automated, computerized way are called computer-based information systems (Mihăescu, 2009). Thus, it is important to link the definition of an information system to what it means to achieve a monitoring solution.
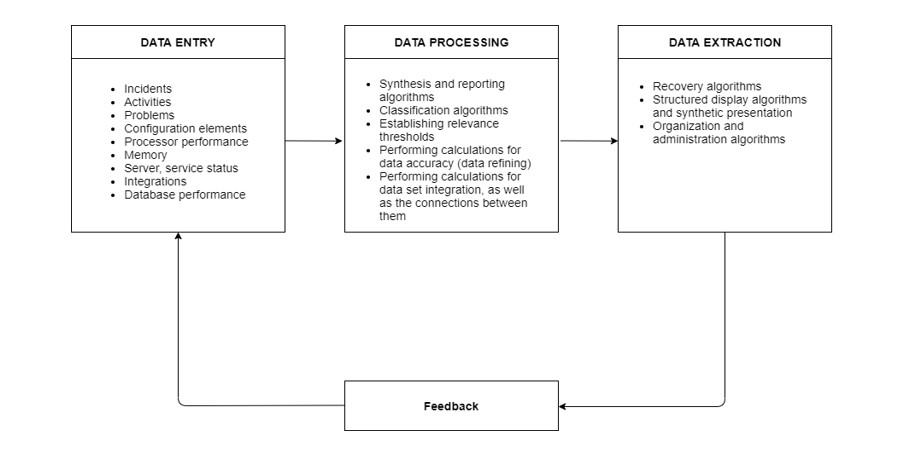
The procedural framework described will have to consider, in the realization of the solution, the following proposed model that presents the flow of data processing in a computer system adapted to the specific requirements of a monitoring application:
Fig 6 – Computer system schema adapted to monitoring application requirements (Authors’ processing)
The creation of a very suitable set of indicators that can capture IPCC subtleties is very difficult to accomplish, partly due to the system uncertainties and different changing IT regulations. Also, these aspects may vary a lot from company to company. Since the business cases vary a lot, in a demanding and constantly changing world, it is complicated to set a standard in IPCC practices. Thus, we tried to create a set of all common features metrics that could fit, at its best, a large set of IT operations. We are basing our metrics on previously developed standards, but try to capture the changing element in the entire framework, as much as we can. It’s a challenge to come up with something new and customized each time the IT environment/ framework changes, but with the help of system’s theory and various experimental cases we faced during the years we can set some kind of a milestone in what IPCC metrics could represent at some point, no matter the IT framework we’re facing or the technological capabilities (which are quite forced lately), taking into account the developing cloud era. Even though automated mechanisms are developing a lot lately, IPCC metrics and associated aspects show us that Front Office engineers or monitoring engineers are still necessary for a set of supervision operations, thus validating and even enhancing an entire integration and monitoring process. This aspect is mostly observed in complex systems with complex infrastructures, as these situations tend to be more often in the e-commerce world and not only.
The variety of CIs (Configuration Items), as well as the dependencies between them, could create a very complex infrastructure/ IT environments, making difficult to adapt IPCC processes and extract relevant metrics for monitoring and reports. However, the set of metrics we propose, take into consideration the baseline of this complex framework and offer, to some extent, relevant insights for monitoring and reporting. It is important to mention the fact that other metrics can and must be developed to suit different complex business cases; these metrics can be based on the existing described ones, as a starting point. Nowadays, APM faces a lot of challenges, even if cloud-based solutions such as Microsoft Azure 365 comes with a lot of enhancements related to monitoring capabilities for VMs. The cloud framework offers diversity and lots of solutions but, at the same time, exposes numerous difficulties at integrations (APIs) with different platforms and technologies. We are also aiming to surprise monitoring aspects related to this kind of difficulty. Also, we aim to include the presented metrics into dedicated ETL platforms that could, with the help of dedicated automations, correct specific processes (mainly data and transactions). However, some of the CI dependencies and complicated processes could make it difficult to correct erroneous data and transactions, but the general aim is to correct as much as the systems allow, metrics being key indicators in such a monitoring and corrections process. Hence, this type of mechanism is a constantly developing tool, in a continuous improvement process.
Methods for the experimental verification of indicators and the connections between them
We propose a research methodology that combines IPCC (ITIL Framework) indicators with different synthetic aggregation indicators to achieve a better understanding of the monitoring system. It would be difficult to involve a combination of these metrics, especially because it depends on the informatic system that is being developed. To avoid a misuse of the metrics in terms of analytics, we propose a different approach for each set of indicators and analyze the possibility to extend them as a holistic investigation according to the business case.
The methods for the experimental verification of the proposed indicators are constituted in the following set of variants:
Carrying out simulations of relevant incidents in the test environment to be able to calculate a certain degree of impairment of the functionality of the monitored application components. Thus, it is necessary that the sections / components of the application are not affected in advance or in a small proportion. Otherwise, the application may be taken from the test environment as such, without creating incidents affecting the system, provided that it has sufficiently affected functionality to be reflected in the monitoring system as a type of incident (User Service Restoration). Tests can be carried out in multiple types of environments (even in the production environment).
Carrying out simulations of problems based on the incidents already created in point 1. Thus, data on recurrent incidents can be collected, establish a degree of reactivity as well as a degree of proactivity through complementary measures designed to solve some incidents that may intervene in the future in the application. Thus, based on the RCAs of the reactive and proactive problems, a weight of those proven proactive in the total number can be achieved and establish a rating of the application. An in-depth analysis of the RCA could give better results for identifying underlying causes for future problems. The problems should be relevant enough to lay the foundations of a realistic RCA that could be used in the future in solving multiple and complex problems found in the day-to-day activity of an information system.
Through test users, concurrent sessions can be created to establish the maximum level that can be reached as a level of loading in the application, reflected in the number of requests, through the browser, to the server. Thus, several users can perform various operations that affect the application to create incidents and to be able to report, in real time, several open incidents, of restoration type, to calculate the degree of damage of the application on various components or even in total. The indicators should be tested as included in multiple scenarios in dashboard visualizations, to see the overload of the page and make the necessary adjustments for the dashboard to be easily used, including all necessary elements for monitoring.
Various operations can be performed in the test environment, involving CRs (installations, upgrades, component modifications) and thus, by establishing a relationship with the number of incidents, to be able to calculate, to a certain extent relevant, the discontinuity assessment indicator in ensuring the functionality of the application. For the result to be relevant, it is necessary to consider a certain optimal time interval. The thresholds can be established considering the system’s capabilities, the technologies used and the business requirements.
The evaluation indicators of the degree of configuration can be tested by adding as many components as possible in the informatic system and repeating the activities from the previous points to observe the degree of influence at the level of the entire system. Being a close link between all the indicators presented, it is necessary to consider, a general approach in observing the entire IT system and therefore the repercussions on the monitored e-business application. Here, a Tableau simulation is carried out to visualize the dependencies between the indicators. The proposed indicators can be included in calculated fields to statistically observe the weight in the graphic representations. The same indicators can be used as calculated fields in any other monitoring tool in conjunction with predefined information system elements.
The indicators presented in the previous points can be the basis for calculating an indicator at a general level that can reflect the degree of damage to the application, but also at the level of the computer system. Thus, it is necessary to create, in the monitoring application, a condensed section, in which, through a synthetic representation, all the indicators can be displayed, in graphic or value form and follow, in real time, the reflected changes. through operations in the test environment. If there are inconsistencies, the functionalities of the application can be modified to obtain a relevant model, both for the e-business application itself and for the monitoring solution.
Descriptive statistics used as input parameters for the monitoring system are very useful when combined with layers of IPCC representations (we can make this relationship happen in terms of development using APIs). Before this process, it is strongly recommended to have a consistent and normalized dataset, to obtain a valid output as input for another monitoring system. Therefore, another data validation can be done in the process when the output data of a monitoring system becomes the input data of another. This way, we can achieve a coherence between data and processes and overall, a better monitoring solution. This is valid for both internal and external data. By building an API, we can extend monitoring data even to IoT devices and connected vehicles domain.
The usage of cloud computing solutions for testing different dashboards and technical verification of metrics in a cloud environment (what kind of metrics could be verified), taking into consideration different scenarios that could affect a stable cloud environment (as e-business applications tend to adopt/ use, more widely, the cloud infrastructure). The aspect of using cloud computing is somehow synonym with IT infrastructure cost management, especially in a large company. (Chieu, T. et al., 2010)
Using dashboard instruments like Tableau, we concluded the following:
Different parameters create enhanced visualizations based on the combination of filters and calculated fields to set the basis for synthetic monitoring and also contribute to complex dashboards that can be used in analyzing the activity of complex information systems.
The parameters can represent calculated fields that are taken from multiple sources (databases management systems, Excel files) and show the level of granularity and the possibility of combining different indicators which overall can give a better picture of the monitored system.
Multiple correlations can be created combining the proposed indicators without causing the overload of the dashboard and without inducing confusion in the engineering team to understand these indicators.
Experiment and results of using the proposed indicators
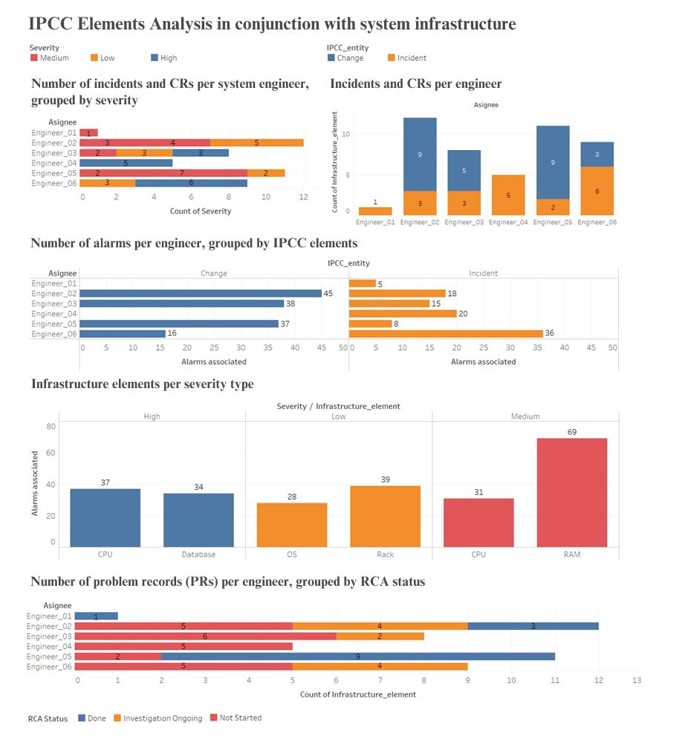
As a case study, we showcased the importance of IPCC elements by creating a monitoring dashboard, based on the proposed indicators, through the relations that these system monitoring entities have with the infrastructure and the workload of system engineers. Thus, the following situations emerge, ordered by their importance, from the analysis of a potential monitoring scenario in a production system:
Infrastructure elements per severity type
Number of alarms per engineer, grouped by IPCC elements
Incidents and CRs per engineer
Number of incidents and CRs per system engineer, grouped by severity
Number of problem records (PRs) per engineer, grouped by RCA status.
Considering these aspects, we have developed a dashboard using Tableau (Fig 7) to display the data, representing the basis for calculating the proposed indicators.
Fig 7 – Dashboard for analyzing the IPCC elements in conjunction with the monitored system infrastructure (Authors’ processing)
The benefits of using the proposed indicators are the following:
Achieving a relevant framework for obtaining results from the monitoring activity and implementing metrics that reflect, synthetically, the degree of damage to the application.
Along with the classic indicators for evaluating the performance of an application, IPCC indicators can help to understand the behavior of the computer system and add value in detecting specific incidents.
They can be the basis for achieving improvements in terms of functionality or even at the level of the entire application, by fully understanding the way of working with IPCC processes and their continuous adaptation to the monitored e-business solution.
They can improve the understanding of how to work with IPCC processes and can influence their level of applicability.
They can help to achieve transparency in the evaluation of the e-business application and thus, form a complete and correct image regarding the operations that take place, as well as their frequency and type.
Along with the classic indicators related to the analysis of infrastructure and processes associated with the application, IPCC process indicators can provide relevant reports promptly to decision-makers, so as not to be negatively influenced by the e-business framework.
The disadvantages of using the proposed indicators refer, in principle, to the complexity of their implementation to relate to the standard monitoring indicators as well as to the difficulty of testing them in a dedicated environment, to reflect as well as possible a real situation. However, technological, and procedural barriers can be removed by creating a robust application with a high degree of accuracy of indicators, based on real-time data evaluation, as well as a test environment that is as well synchronized as possible with a functional production environment. It is important to mention that, for metrics and monitoring solution functionalities, in the PHP development framework, Elastic PHP APM Agent could represent a viable solution, incorporating web frameworks, data access technologies and HTTP clients. (Kleyman, S. 2021) Another PHP monitoring feature/ function is given by PHP Monolog, with PHP frameworks Laravel & Symfony, implementing a common interface for logging libraries, an important part in the monitoring process. (PHP Monolog tutorial: A step by step guide, 2018) To test / experiment with different data sets and indicators, it is important to incorporate different data structures into developed PHP functions for monitoring, making different test scenarios and monitoring operation simulations. One of the simplest and most efficient PHP monitoring functions frameworks is represented by PHP Server Monitor which comes with the following important capabilities: monitors services and websites, generates history graphs of uptime and latency, logs of connection errors, outgoing emails and text messages. (PHP Server Monitor, Accessed: February 2, 2022)
In terms of limitations and applicability, the proposed indicators could encounter different dataset compatibility issues when exiting a system and entering another. Since each informatic system faces its technical problems and challenges, it could be quite difficult to adjust and interpret sets of data. Even OCR (optical character recognition) systems could be prone to errors and create difficulties in the process. It is important to mention that there are numerous data preparation techniques, for an efficient operation of the monitoring system, enhancing visualizations and dashboards, such as: data mining and Map reduce (as an important programming paradigm that has been developed for processing and generating huge datasets that don’t fit in its physical memory). (Meera, S. and Sundar, C. 2021)
The network itself could also be a limitation. Since big data technologies are built to process large amounts of data with little stress over the system, sending the data from one system to another might be expensive in terms of network traffic. In this respect, even though the system itself can perform at high capacities, poorly developed network systems might represent a bottleneck in the overall process. Big data and AI (deep learning) are constantly used for collecting, processing and manipulating data, from different markets, thus robots are being deployed not only for automating industrial processes but also for collecting metrics data and valuable information for decision-taking reports. (Paolanti, M. et al., 2019)
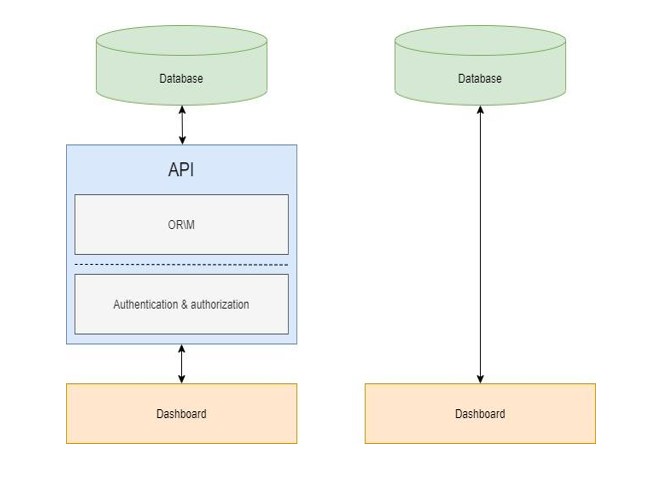
Being calculated fields, especially when one has a significant volume of data, the response time of the request can be considerably larger. If the dashboard visualization is overloaded with redundant elements (unnecessary indicators), the used resources can affect the performance of the system. Thus, carefully analyzing every indicator presented on the dashboard is crucial in optimizing the overall speed. One way to achieve this result is to scrutinize between technologies and choose the most appropriate one for the task and the context of the dashboard usage. The backend of the dashboard elements also plays an important role, since its speed can impact the performance of the whole dashboard. The problem in fetching data consists in the backend implementation used rather than just the display of this data. An unoptimized implementation of the backend system will result in a slow dashboard. The chosen technology might impact the number of operations performed by the system to achieve the same result. For example, the usage of an ORM in an API endpoint, although it makes the implementation easier, is much slower than providing a stored procedure that retrieves the same data, due to the extra operations that must be performed to successfully access the database. The latter, however, even if it skips the extra steps needed to consume the data, creates a more sensitive environment in terms of security, which sometimes represents a must. Therefore, finding the right balance between performance and security is the main challenge in optimally implementing the described IPCC indicators.
Fig 8 – Accessing the data through an API (left) vs directly call the stored procedures (right) (Authors’ processing)
Conclusions
The conclusions that can be deduced from this study are the following:
The realization of the proposed indicators contributes to the creation of an optimal monitoring solution, with a high degree of accuracy in the evaluation and display of situations.
The realization of the proposed indicators can provide a direction in the development of an optimal monitoring solution, which would feasibly combine the technical evaluation part with the procedural evaluation one.
The indicators presented can be the basis for creating an optimal monitoring solution with a high degree of applicability, at the level of an IT organization. Also, indicators can be the basis for creating other indicators of increasing relevance.
The new approach regarding the criteria used in the development of an optimal monitoring solution refers, in principle, to the combination of purely technical elements with those related to IPCC processes, within ITIL, increasingly used at the level of IT organizations. Highlighting the relationship between the two frameworks is an element that can lead to the creation of increasingly complex IT solutions, in this case, in the field of monitoring tools.
The study of IT and information systems is necessary to understand the relationship between IPCC processes and the technical side of monitored components.
The proposed indicators, in combination with other elements of ITIL, can create the basis for deepening the IPCC processes and understanding how to apply them, in the evaluation of the operational activity as well as in the evaluation of the application itself.
A monitoring solution requires data analysis, a fact which sometimes could represent a challenge, especially in the context of Big Data, therefore, when implementing mechanisms for evaluating complex data structures, we need to consider the following aspects (Witkowski, 2017):
Volume (amount of data)
Variety (variety of data)
Velocity (the speed of generation of new data and analysis)
Value (value data) – select the most important sections of the data set
Monitoring solutions can also be applied in retail, for monitoring the customers’ behavior and trajectories. Thus, two strategies can be adopted as monitoring solutions: UWB technologies and RGB-D cameras. The system using UWB technology can monitor consumer movement in stores and send tracking data to a cloud server. Relevant parameters from this solution can represent input data for a complex monitoring system, following the IPCC guidelines, framework and indicators, adapted to the context described above. (Frontoni et al, 2019)
It is important to evaluate variable usage in PHP framework when constructing the monitoring application’s functions since the development of any application using sensitive and important data in lots of transactions (like a monitoring tool) could be negatively influenced by the misuse of variables (sessions, metrics or any other function variable), especially from the security point of view. (php.net, 2022)
Monitoring metrics could represent the basis for evaluating a complex production framework but it’s important to mention that their accuracy and relevancy depend on the business case as well as the methods for applying indicator evaluations. With the complexity of the e-business solution comes the complexity of proper evaluation of the system, therefore, no actual metrics could evaluate with 100% accuracy a complex infrastructure/ system.
References to monitoring metrics could take into consideration also, the following aspects: user satisfaction/ Apdex scores, average response time, error rates, count of application instances, request rate, application & server CPU, application availability and garbage collection. (stackify.com, 2017)
Cloud solutions come with incorporated built-in monitoring functions; however these are not yet capturing important subtle details related to the actual business, hence a level of customization is required according to the business case. There are specific cloud monitoring solutions that come with dedicated functions according to specific business needs, but they are costly, especially when talking about enterprise editions or very complex e-business solutions. Even if the high cost could be a barrier for some e-business development premises, the e-markets developed and continue to develop a lot due to the following: online Mobile commerce, cloud computing and other related aspects which make part of the general technological evolution of commerce. (Kaur, J., Arora, V. and Bali, S., 2020)
An important premise in adopting monitoring solutions and metrics evaluation is the continuous development and usage of Internet of Things (IoT) platforms, hence many important business and non-business metrics need to be evaluated and monitored to obtain performance in a competing e-business world. (Fatorachian, H. and Kazemi, H., 2021)
In this article we propose a set of indicators/ metrics that can help different e-business cases, especially in the IT field, establish a baseline in monitoring, as well as representing a base for the development of other complex indicators, according to the ITIL (IPCC) applied principles.
References
8 key application performance metrics & how to measure them (2017) com. Available at: https://stackify.com/application-performance-metrics/ (Accessed: July 5, 2021).
Application Performance Monitoring (APM) (no date) net. Available at: https://www.php.net/manual/en/security.variables.php (Accessed: February 1, 2022).
Chieu, T. et al. (2010) “Cross enterprise improvements delivered via a cloud platform: A game changer for the consumer product and retail industry,” in 2010 IEEE International Conference on Services Computing. IEEE.
Fatorachian, H. and Kazemi, H. (2021) “Impact of Industry 4.0 on supply chain performance,” Production planning & control.
Frontoni, E., Mancini, A., Martini, M., Paolanti, M., Romeo, L. and Zingaretti, P., 2019, “Robotic retail surveying by deep learning visual and textual data”, Robotics and Autonomous Systems 118, pages 179-188.
Kaur, J., Arora, V. and Bali, S. (2020) “Influence of technological advances and change in marketing strategies using analytics in retail industry,” International journal of system assurance engineering and management, 11(5), pp. 953–961.
Kleyman, S. (2021) Elastic APM PHP Agent 1.0 released, co. Available at: https://www.elastic.co/blog/elastic-apm-php-agent-1-0-released (Accessed: April 10, 2021).
Meera, S. and Sundar, C. (2021) “A hybrid metaheuristic approach for efficient feature selection methods in big data,” Journal of ambient intelligence and humanized computing, 12(3), pp. 3743–3751.
Mihăescu, L., 2009, “Sisteme informaţionale şi aplicaţii informatice în administrarea afacerilor”, Editura Universităţii Lucian Blaga din Sibiu.
Pandorafms, 2017, “The importance of having a good monitoring system”, [Online], [Retrieved February 5, 2021], https://pandorafms.com/blog/why-you-need-a-monitoring-system/
Paolanti, M. et al. (2019) “Robotic retail surveying by deep learning visual and textual data,” Robotics and autonomous systems, 118, pp. 179–188.
PHP Monolog tutorial: A step by step guide (2018) com. Available at: https://stackify.com/php-monolog-tutorial/ (Accessed: August 14, 2021).
PHP Server Monitor (no date) org. Available at: https://www.phpservermonitor.org/ (Accessed: February 2, 2022).
Witkowski, K. (2017) “Internet of things, big data, industry 4.0 – innovative solutions in logistics and supply chains management,” Procedia engineering, 182, pp. 763–769.