Unitec Institute of Technology – part of Te Pūkenga, Auckland, New Zealand
Volume 2025,
Article ID 786386,
Journal of Software and Systems Development,
10 pages,
DOI: https://doi.org/10.5171/2025.786386
Received date: 30 September 2024; Accepted date: 30 January 2025; Published date: 11 June 2025
Cite this Article as:
Eltahir KABBAR and Nuwan HERATH (2025)," Customer Churn Prediction to Enhance Customer Retention Strategies in the Banking Industry: A Study Using Seven Machine Learning Algorithms ", Journal of Software & Systems Development, Vol. 2025 (2025), Article ID 786386, https://doi.org/10.5171/2025.786386
This study explores machine learning approaches to predict customer churn in the banking sector. Following Dietterich’s Machine Learning Problem Research Life Cycle, six key steps were implemented: data gathering, preparation, exploratory data analysis (EDA), model creation, training, evaluation, and hyperparameter tuning. A systematic literature review identified essential machine learning techniques and innovations applied to customer churn prediction since 2014, highlighting Random Forest, Gradient Boosting, and hybrid models as practical approaches. This review also emphasized the value of advanced preprocessing and explainable AI techniques in improving model accuracy and usability. A publicly available dataset of 10,000 entries was used to evaluate seven machine learning algorithms, K-Nearest Neighbors (KNN), Support Vector Machine (SVM), Logistic Regression, Decision Tree, Random Forest, AdaBoost, and Gradient Boosting based on accuracy, precision, recall, F1 score, and ROC-AUC. Among these, the Gradient Boosting Classifier emerged as the most effective model with an accuracy of 85.2% and an ROC-AUC of 0.87, demonstrating robust performance in predicting customer churn. The findings underscore the potential of Gradient Boosting for developing reliable churn prediction systems, aiding banks in devising targeted customer retention strategies. The results of this study can benefit both academic researchers and industry practitioners. Academics can use the findings to explore advanced machine learning applications and develop new churn prediction frameworks. At the same time, practitioners, particularly in banking and related industries, can leverage the Gradient Boosting model to improve customer retention strategies and reduce revenue losses associated with churn. Future research is recommended to validate these results using dynamic datasets.
Recent global data on customer retention rates suggest that the banking industry has a lower rate (75%) compared to other sectors like media (84%), transportation (83%), IT (81%), construction (80%), Financial (78%), and telecommunication (78%), indicating that the customer retention rates in the banking sector are considerably lower than other sectors. Hence, banking organizations must improve customer retention strategies. (Shopify 2024). Customer behavior is critical for any company, but this is especially true for businesses that rely heavily on it for survival. (Amin et al., 2019; Ahmad, Jafar and Aljoumaa, 2019). Further, customer retention is critical for generating profits in a competitive environment. (De Caigny, Coussement and De Bock, 2018), Attrition will occur when clients are not happy with the product or service offered by the organization, leading to disconnecting behavior. (Elik and Osmanoglu, 2019; Amin, Al-Obeidat, et al., 2020).
The churn rate refers to the proportion of customers who disengage from a business within a given time frame. A low churn rate reflects effective customer relationship management and satisfactory service delivery. Conversely, a high churn rate indicates underlying issues that require immediate attention, necessitating an analysis of the root causes (Keramati, Ghaneei & Mirmohammadi, 2016; Sabbeh, 2018).
In the context of the banking sector, the large customer base presents challenges for implementing personalized client retention strategies, as dedicating resources to analyzing individual churn rates is neither feasible nor cost-effective. Furthermore, the financial and operational constraints associated with investigating the root causes of churn for each customer exacerbate these challenges. However, by leveraging predictive analytics to forecast which customers are most likely to churn, banks can prioritize their retention efforts on high-risk clients, optimizing resources and enhancing overall retention strategies.
To identify early indicators of potential churn, banking organizations must first understand their customers and their interactions across various factors, including product purchase histories, store/branch visits, web-based transactions, customer service calls, and social media interactions (Saran Kumar and Chandrakala 2016). In addition to maintaining their market position, companies can grow, expand, and maximize their profit by managing churn. (Ismail, et al. 2015). The best companies prioritize their customers’ needs over bringing in new ones because they depend on building solid and long-lasting relationships with their present clients. (Vafeiadis, et al. 2015). Moreover, the churned customers encourage others in their social network to adopt similar behaviors, and loyal customers maximize profits and minimize business expenses because they are more likely to make repeat purchases and encourage others in their social network to adopt similar behaviors. (Amin, Shah, et al. 2019).
Therefore, the success of any company in the banking industry revolves around reducing client attrition and implementing a solid retention plan to keep existing customers from leaving the organization. Businesses can start customer retention programs by analyzing the root causes of customer churn.
Research Objectives
This study uses machine learning techniques to predict customer churn in banking organizations. A machine learning model was developed to predict the customers most likely to leave using factors like Credit Score, Gender, Age, and Balance. In addition, the study compares seven machine learning models (KNN, SVM, Logistic Regression, Decision Tree, Random Forest, AdaBoost, and Gradient Boosting) to predict customer churn in the banking sector and select the best-performing model using several accuracy measures.
Literature Review
To better understand the research conducted on customer churn prediction, we followed a systematic literature review process to identify high-quality sources published since 2014. Articles of relevance to the research objectives were initially identified. The researchers screened the papers obtained from Google Scholar, IEEE Explore, and ACM library using the titles and abstracts of the documents, resulting in a manageable number of articles. Papers were deemed out-of-scope if they did not focus on customer churn and prediction using machine learning. This section summarizes the literature reviewed to identify the approaches and techniques used to predict churn rates and the various customer retention strategies to protect their customer base.
Customer Relationship Management (CRM) is used to lower expenses and boost profitability through developing customer loyalty. (Boadu and Achiaa 2019). A study that used several machine learning classification techniques (Random Forest (RF), k-nearest neighbors, and decision tree Classifier) is used to analyze customer churn data in the Telecom industry. This study compared the accuracy measures of these techniques and concluded that the Random Forest classifier best fits Customer churn prediction. (Wagh, et al. 2024). Similarly, (Lalwani, et al. 2022) used predictive models like logistic regression, Naive Bayes, support vector machines, random forests, and decision trees to predict customer churn in the telecommunications sector and found the highest accuracy of the Adaboost and XGboost classifiers was 81.71% and 80.8%, respectively.
Another study used machine learning models, such as k-means clustering, logistic regression, decision trees, random forests, support vector machines, and k-nearest neighbors. It concluded that the random forest model had a maximum accuracy of 97% (Tran and Nguyen 2023).
Furthermore, a recent study on credit card user attrition prediction recommended using several machine learning models and feature selection techniques. (Al-Najjar, Al-Rousan and Al-Najjar 2022). In addition, (Matuszelański and Kopczewska 2022) suggest an innovative approach to forecasting user attrition in a Brazilian e-commerce retail business using a three-step approach: textual after-purchase reviews, numerical order data, and socio-geodemographic census data. Latent Dirichlet Allocation, Gibbs sampling, and Dirichlet A multinomial Mixture are used in the pre-processing step to extract themes from text reviews. DBSCAN is used in geographical analysis to pinpoint rural and urban locales and consumer communities using zip codes. During the modeling phase of the study, logistic regression and machine learning extreme gradient boosting are used, and the model quality is confirmed using lift and area-under-curve metrics. The goal of explainable artificial intelligence is to identify churn predictors. According to (Matuszelański and Kopczewska 2022), the factors influencing customer churn are payment amount, product categories, location, and demographic surroundings, but not population density, a quantitative or qualitative review of the initial purchase. Another study suggests using a deep learning model to forecast future customer churn in the retail sector when considering different technologies for churn prediction. The models commonly employed in churn prediction research, such as artificial neural networks and logistic regression models, were compared. The model outcomes were compared using the AUC accuracy classification tool, precision, and recall. The findings showed that the deep learning model performed better than the other comparison models. (Seymen, Dogan and Hiziroglu 2020).
A different study investigated hybrid models for churn prediction. Two hybrid models have been employed, combining self-organizing maps (SOM) and back-propagation artificial neural networks (ANN). While the second method builds a prediction model based on the filtered data, the first model reduces data by removing unrepresentative training data. Three sets and two fuzzy and general testing sets were used to test the ANN and SOM models. Regarding Types I and II errors and prediction accuracy, the hybrid models performed better than the single neural network model used as a baseline. The ANN + ANN hybrid model outperformed the SOM + ANN hybrid and ANN baseline models. This emphasizes how crucial hybrid data mining methods are for predicting customer attrition and retaining existing customers. (Tsai and Lu 2019). Compared with other studies, a different approach is present in another study, a churn prediction model that uses classification and clustering techniques in the telecom sector. The model employs the Random Forest (RF) method for classification, with 88.63% successfully classified instances. After that, the data are segmented to generate retention offers by classifying clients based on cosine similarity. The model also identifies churn characteristics necessary to determine the underlying causes of churn. Metrics such as ROC area, f-measure, accuracy, precision, and recall are used to assess the performance. The findings demonstrate that the model outperforms the competition in customer profiling with k-means clustering and churn categorization using the RF algorithm. (Ullah, et al. 2019).
Furthermore, another study conducted in the United Kingdom based on an online retail gift store uses UCI Machine Learning to analyze transactions from December 2010 to 2011. Data are pre-processed, verified, and aggregated to create customer and invoice datasets to predict customer turnover. Each data point has a variable churn value, and three algorithms, Random Forest, Support Vector Machines, and Extreme Gradient Boosting, are used to forecast the churn value. Finally, different algorithms were compared to find the best model to predict customer churn. (Patil, et al. 2017).
Research Methodology
This exploratory study utilizes a publicly available dataset containing 10,000 data points (Kaggle, n.d.) to develop a machine learning model for customer churn prediction within the banking sector. The research design is guided by Dietterich’s Machine Learning Problem Research Life Cycle framework (Dietterich, n.d.), encompassing six key phases: data collection, data preparation, exploratory data analysis (EDA), model development, training and evaluation, and hyperparameter optimization.
To identify the most effective predictive model, seven machine learning algorithms were implemented and evaluated: K-Nearest Neighbors (KNN), Support Vector Machine (SVM), Decision Tree, Logistic Regression, Random Forest, AdaBoost Classifier, and Gradient Boosting Classifier. The evaluation process employed multiple performance metrics to comprehensively assess each model’s predictive accuracy and reliability.
Analysis and Discussion
Before the data analysis, the researchers went through a data-wrangling process to clean, transform, and prepare the data for further study. The researchers checked the dataset for possible anomalies, such as missing and duplicate values, but found none; therefore, we did not need to pursue any of the recommended data imputation processes (van Smeden et al., 2021; Johnson et al., 2021; Bharambe, Jain, and Jain, 2012).
Exploratory analysis is a necessary step commonly used by data scientists (Walse, Kurundkar and Bhalchandra, 2018; Muraina et al., 2023) to understand the dataset better. The results of the exploratory analysis are presented in the following section.
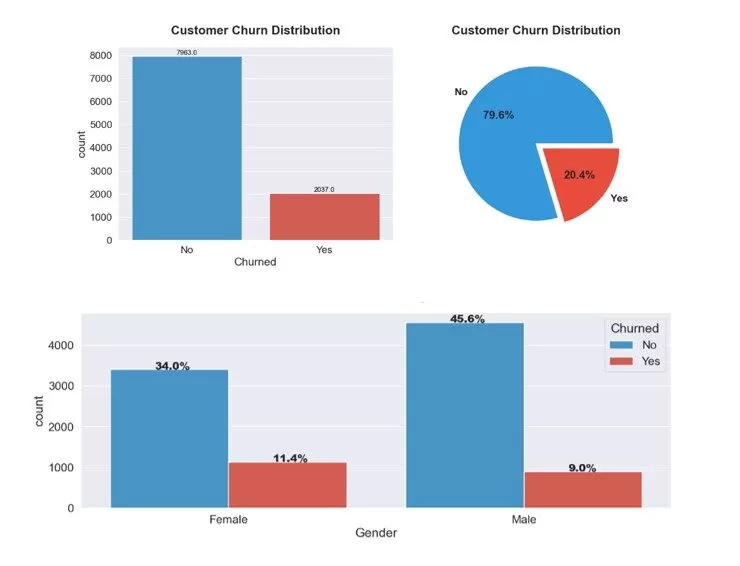
Of the (n=10,000) data points, 20.4% (n=2,037) were identified as churn customers. The exploratory analysis revealed identified class imbalance, with 11.4% of the customers being females with varying male vs female churn rates, as shown in Figure 1. The class imbalance could lead to bias in model performance; therefore, we used over-sampling techniques to address this issue.
Figure 1: Customers Churn Rates and Gender
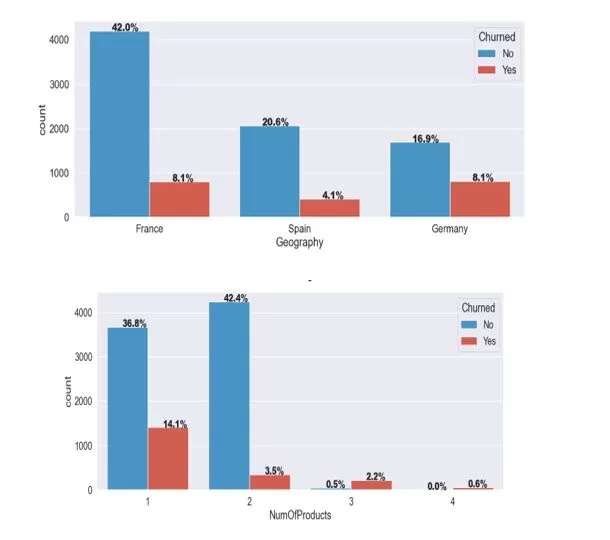
Half of the customers in the dataset are from France, Germany, and Spain (see Figure 2). The churn rate of customers in France and Germany is comparable despite the varying number of customers based in those countries (France=5014, Germany=2509, and Spain=2477). The churn rate in Germany and France is twice that of Spain.
Moreover, most clients (96.8%) have one or two banking products, with a significant churn rate (14.1%) for the customers holding one banking product compared to (3.5%) for customers with two products. The number of customers with more than two products is minimal, as shown in Figure 2.
Figure 2: Customers Churn by Location and Number of Products
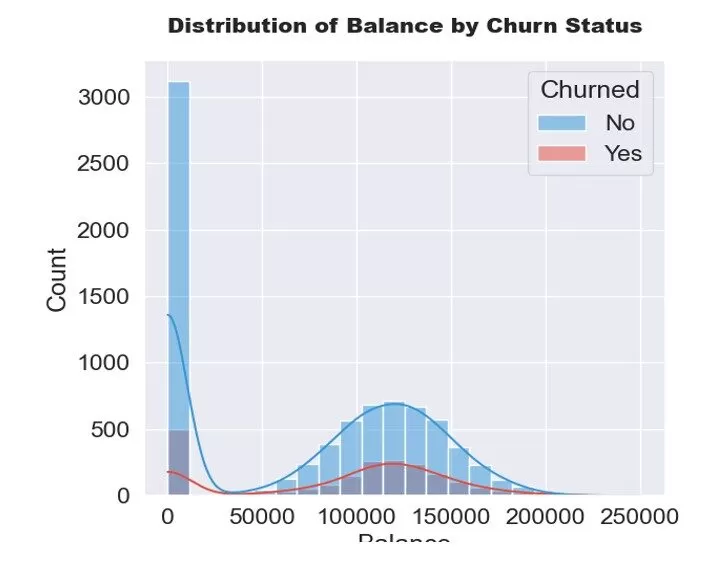
In addition, the exploratory data analysis shows that over (n=3,000) customers in the dataset have zero balances on their accounts, leading to a distorted normal distribution. We excluded customers with zero balances from further analysis. Once customers with zero balance values are removed, the rest of the records exhibited a normal distribution for customers with and without churn status, as shown in Figure 3.
Figure 3: Distribution of Balance by Churn Status
Furthermore, we created the ‘Account Balance’ feature by applying conditions to the ‘Balance’ Feature for Zero Balance and more than Zero Balance. Feature engineering aims to add new features or change preexisting ones to enhance the functionality of machine learning models.
Model Creation Training & Evaluation
The study separated attributes from the target variable ‘Churned’ to form feature set X and label Y. The dataset was split into 80% training and 20% testing and the target variable’s class imbalance was addressed using the Synthetic Minority Over-sampling Technique (SMOTE). This method produced a more balanced training dataset by artificially increasing the number of instances in the minority class (churned customers).
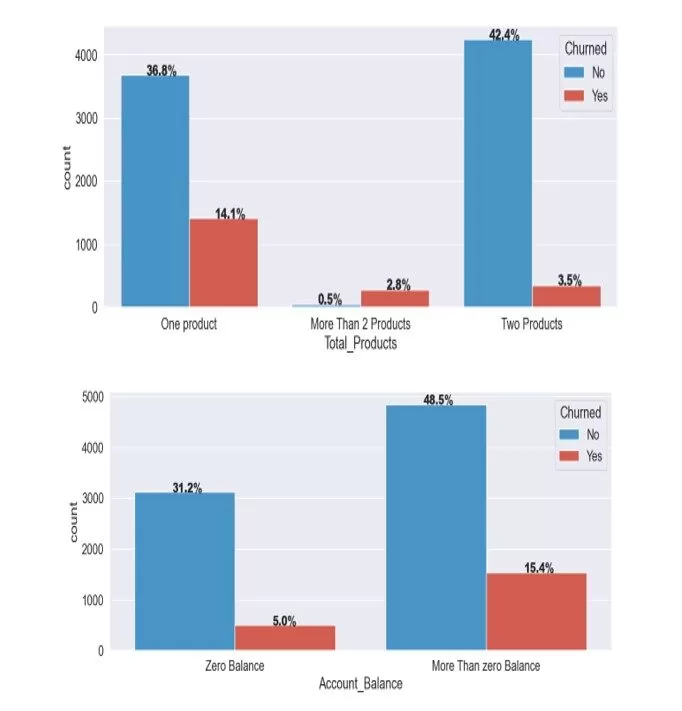
Figure 4: Customer Churned by Product
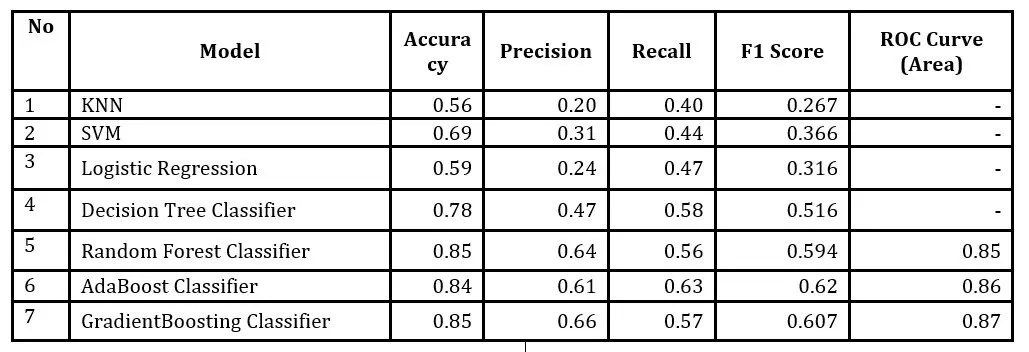
Several machine learning models were trained on the resampled data, including KNN, SVM, Logistic Regression, Decision Tree, Random Forest, AdaBoost, and Gradient Boosting. The best-performing model was evaluated and selected considering Accuracy, precision, Recall, F1 Score, and ROC Curve matrices to predict customer churn. The results of this evaluation are shown in Table 1.
Table 1 : ML Model Evaluation
Among all the machine learning models evaluated, the GradientBoosting Classifier is the most effective for predicting customer churn model, considering its highest overall accuracy (0.852) and the superior ROC Curve AUC (0.87). This model can correctly classify positive and negative cases, making it particularly important for customer churn prediction. While the AdaBoost Classifier and Random Forest Classifier also perform well, ROC Curve AUCs (0.86) and (0.85) fall slightly behind the GradientBoosting Classifier regarding accuracy and AUC. High precision and balanced recall further underscore the robustness of the GradientBoosting Classifier, making it the most favorable among the models evaluated for effectively addressing the customer churn problem.
Conclusion
This study investigates applying seven distinct machine learning models for predicting customer churn in the banking sector to improve customer retention strategies. The machine learning algorithms explored include K-Nearest Neighbors (KNN), Support Vector Machine (SVM), Random Forest, Logistic Regression, Decision Tree, AdaBoost, and Gradient Boosting. Each model was trained and evaluated using a dataset that underwent extensive preprocessing, including the Synthetic Minority Oversampling Technique (SMOTE), to address class imbalance by oversampling the minority class.
The Gradient Boosting Classifier emerged as the most effective model, demonstrating superior performance compared to the other algorithms. Performance was evaluated using a range of metrics, including accuracy, precision, recall, F1-score, and Area Under the Curve (AUC), with Gradient Boosting achieving an accuracy of 85.2% and an AUC of 0.87. This result underscores the model’s robustness and suitability as a reliable tool for customer churn prediction in the banking industry.
Given that the performance evaluation was conducted using a static dataset, the study recommends extending future research by testing these findings on dynamic datasets to improve model generalizability and scalability in real-world applications.
References
Ahmad, Abdelrahim Kasem and Jafar, Assef and Aljoumaa, Kadan. 2019. ‘Customer churn prediction in telecom using machine learning in big data platform.’ Journal of Big Data 6 (Springer): 1–24.
Al-Najjar, Dana and Al-Rousan, Nadia and Al-Najjar, Hazem. 2022. ‘Machine learning to develop credit card customer churn prediction.’ Journal of Theoretical and Applied Electronic Commerce Research 17 (MDPI): 1529— 1542.
Amin, Adnan and Al-Obeidat, Feras and Shah, Babar and Adnan, Awais and Loo, Jonathan and Anwar, Sajid. 2019. ‘Customer churn prediction in telecommunication industry using data certainty.’ Journal of Business Research 94 (Elsevier): 290–301.
Amin, Adnan and Al-Obeidat, Feras and Shah, Babar and Tae, May Al and Khan, Changez and Durrani, Hamood Ur Rehman and Anwar, Sajid. 2020. ‘Just-in-time customer churn prediction in the telecommunication sector.’ The Journal of Supercomputing 76 (Springer): 3924–3948.
Amin, Adnan and Shah, Babar and Khattak, Asad Masood and Moreira, Fernando Joaquim Lopes and Ali, Gohar and Rocha, Alvaro and Anwar, Sajid. 2019. ‘Cross-company customer churn prediction in telecommunication: A comparison of data transformation methods.’ International Journal of Information Management 46 (Elsevier): 304–319.
Bharambe, Dewendra and Jain, Susheel and Jain, Anurag. 2012. ‘A survey: detection of duplicate record.’ International Journal of Emerging Technology and Advanced Engineering 2 (Citeseer): 298–307.
Boadu, Kankam and Achiaa, Ama. 2019. ‘Customer relationship management and customer retention.’ Customer Relationship Management and Customer Retention (October 20, 2019).
De Caigny, Arno and Coussement, Kristof and De Bock, Koen W. 2018. ‘A new hybrid classification algorithm for customer churn prediction based on logistic regression and decision trees.’ European Journal of Operational Research 269 (Elsevier): 760–772.
elik, Ozer and Osmanoglu, Usame O. 2019. ‘Comparing to techniques used in customer churn analysis.’ Journal of Multidisciplinary Developments 4 (1): 30–38.
Ismail, Mohammad Ridwan and Awang, Mohd Khalid and Rahman, M Nordin A and Makhtar, Mokhairi. 2015. ‘A multi-layer perceptron approach for customer churn prediction.’ International Journal of Multimedia and Ubiquitous Engineering 10: 213–222.
Johnson, Thomas F and Isaac, Nick JB and Paviolo, Agustin and Gonz{‘a}lez-Su{‘a}rez, Manuela. 2021. ‘Handling missing values in trait data.’ Global Ecology and Biogeography 30 (Wiley Online Library): 51–62.
d. Kaggle. Accessed 02 05, 2024. https://www.kaggle.com/datasets/shantanudhakadd/bank-customer-churn-prediction/data.
Keramati, Abbas and Ghaneei, Hajar and Mirmohammadi, Seyed Mohammad. 2016. ‘Developing a prediction model for customer churn from electronic banking services using data mining.’ Financial Innovation 2 (Springer): 1–13.
Lalwani, Praveen and Mishra, Manas Kumar and Chadha, Jasroop Singh and Sethi, Pratyush. 2022. ‘Customer churn prediction system: a machine learning approach.’ Computing 104 (Springer): 271–294.
Matuszela{‘n}ski, Kamil and Kopczewska, Katarzyna. 2022. ‘Customer churn in retail e-commerce business: Spatial and machine learning approach.’ Journal of Theoretical and Applied Electronic Commerce Research 17 (MDPI): 165–198.
Muraina, Ismail Olaniyi and Adesanya, Olayemi Muyideen and Agoi, Moses Adeolu and Onen, Solomon. 2023. ‘The Necessity of Exploratory Data Analysis: How are preprocessing activities beneficial to Data Analysts and Professional Researchers in Academia?’ Int. J. Sci. Res. in Computer Science and Engineering Vol 11 (3).
Patil, Annapurna P and Deepshika, MP and Mittal, Shantam and Shetty, Savita and Hiremath, Samarth S and Patil, Yogesh E. 2017. ‘Customer churn prediction for retail business.’ In 2017 International Conference on Energy, Communication, Data Analytics and Soft Computing (ICECDS), 845–851. IEEE.
Sabbeh, Sahar F. 2018. ‘Machine-learning techniques for customer retention: A comparative study.’ International Journal of Advanced Computer Science and Applications 9 (Science and Information (SAI) Organization Limited): 2.
Saran Kumar, A and Chandrakala, D. 2016. ‘A survey on customer churn prediction using machine learning techniques.’ International Journal of Computer Applications 975: 8887.
Seymen, Omer Faruk and Dogan, Onur and Hiziroglu, Abdulkadir. 2020. ‘Customer churn prediction using deep learning.’ International Conference on Soft Computing and Pattern Recognition (Springer): 520–529.
Tran, Hoang and Le, Ngoc and Nguyen, Van-Ho. 2023. ‘CUSTOMER CHURN PREDICTION IN THE BANKING SECTOR USING MACHINE LEARNING-BASED CLASSIFICATION MODELS.’ Interdisciplinary Journal of Information, Knowledge & Management 18.
Tsai, Chih-Fong and Lu, Yu-Hsin. 2019. ‘Customer churn prediction by hybrid neural networks.’ Expert Systems with Applications 36 (Elsevier): 12547–12553.
Ullah, Irfan and Raza, Basit and Malik, Ahmad Kamran and Imran, Muhammad and Islam, Saif Ul and Kim, Sung Won. 2019. ‘A churn prediction model using random forest: analysis of machine learning techniques for churn prediction and factor identification in telecom sector.’ IEEE Access 7 (IEEE): 60134–60149.
Vafeiadis, Thanasis and Diamantaras, Konstantinos I and Sarigiannidis, George and Chatzisavvas, K Ch. 2015. ‘A comparison of machine learning techniques for customer churn prediction.’ Simulation Modelling Practice and Theory 55 (Elsevier): 1–9.
van Smeden, Maarten and de Vries, Bas BL Penning and Nab, Linda and Groenwold, Rolf HH. 2021. ‘Approaches to addressing missing values, measurement error, and confounding in epidemiologic studies.’ Journal of Clinical Epidemiology 131 (Elsevier): 89–100.
Wagh, Sharmila K and Andhale, Aishwarya A and Wagh, Kishor S and Pansare, Jayshree R and Ambadekar, Sarita P and Gawande, SH. 2024. ‘Customer churn prediction in telecom sector using machine learning techniques.’ Results in Control and Optimization 14 (Elsevier): 100342.
Walse, RS and Kurundkar, GD and Bhalchandra, PU. 2018. ‘A Review: Design and Development of Novel Techniques for Clustering and Classification of Data.’ International Journal of Scientific Research in Computer Science and Engineering 6 (01): 19–22.