Shanghai Key Laboratory of Forensic Medicine, Institute of Forensic Science, Ministry of Justice, China, Shanghai, China
Volume 2015 (2015),
Article ID 374688,
Research in Genetics,
9 pages,
DOI: 10.5171/2015.374688
Received date: 23 June 2014; Accepted date: 14 August 2014; Published date: 13 March 2015
Academic Editor: Jian Tie
Cite this Article as:
Li Li, Yan Liu and Yuan Lin (2015), "Typing of 67 SNP Loci on X Chromosome by PCR and MALDI-TOF MS," Research in Genetics, Vol. 2015 (2015), Article ID 374688, DOI: 10.5171/2015.374688
A set of single nucleotide polymorphisms (SNP) on X chromosome was selected with the aim of forensic identification in Chinese Han population to complement the analysis of autosomal, Y-chromosomal or mitochondrial markers, especially in deficiency cases. 67 forensically relevant X-SNPs were screened in a Chinese Han population sample. Genomic DNA samples extracted from 295 unrelated Chinese Han individuals were typed using three 17-plex and one 16-plex amplification reactions in combination with genetic analysis assisted by mass-spectrometry based on MassARRAY MALDI-TOF MS platform (Sequenom Inc.). All the investigated loci except rs12849634 were found to be in Hardy-Weinberg equilibrium. A total of 52 of the loci showing independent inheritance and high polymorphisms with minor allele frequency (MAF) above 0.3 were finally screened out. The accumulative exclusion probabilities (CPE) in trio cases and duo cases were above 0.999999. The combined discrimination power (CDP) in female population and male populations were above 0.999999999999999. It is concluded that the panel of informative SNP markers on X chromosome may be used for forensic genetic purposes. The mass spectrometry-based method for X-SNPs profiling was suitable for high-throughput application and could have promising prospects.
Keywords: Forensic genetics; SNP; X chromosome; MALID-TOF Mass
Introduction
Single nucleotide polymorphisms (SNP) typing on X chromosome could effectively complement the analysis of autosomal, Y-chromosomal or mitochondrial markers very efficiently. The markers may be easily amplified in samples with low-quality and degraded DNA.
In some deficiency kinship cases, e.g. relationship between paternal grandmother and granddaughter or relationship between half-sibling sisters who have the same father, X-chromosome markers are valuable and necessary, as reviewed by Pereira et al (2011). Additionally, for solving special father-daughter duos or mother-daughter-father trios, in which only 1~2 loci (out of 19~39) autosomal STR(Short Tandem Repeat)loci were exclusionary, X-SNP loci with genetic stability may be used as supplementary markers to autosomal STR loci to further confirm or exclude paternity or maternity.
Therefore, we planned this study. 67 SNPs on X chromosome were amplified in four multiplex PCR systems followed by matrix-assisted laser desorption/ionization time-of-flight mass spectrometry (MALDI-TOF MS, mentioned by Storm N et al 2003 and Tost et al 2005) in Chinese Han population samples. Hardy-Weinberg equilibrium was analyzed and forensic genetic parameters were calculated.
Materials and Methods
Sample
295 blood samples were collected from unrelated Chinese Han individuals (215 males and 80 females) under informed consent. DNA was extracted from whole blood by using BLOOD DNA EXTRACTION kit according to manufacturer’s instructions (Sangon Biotech, Shanghai, China).
Primer Design
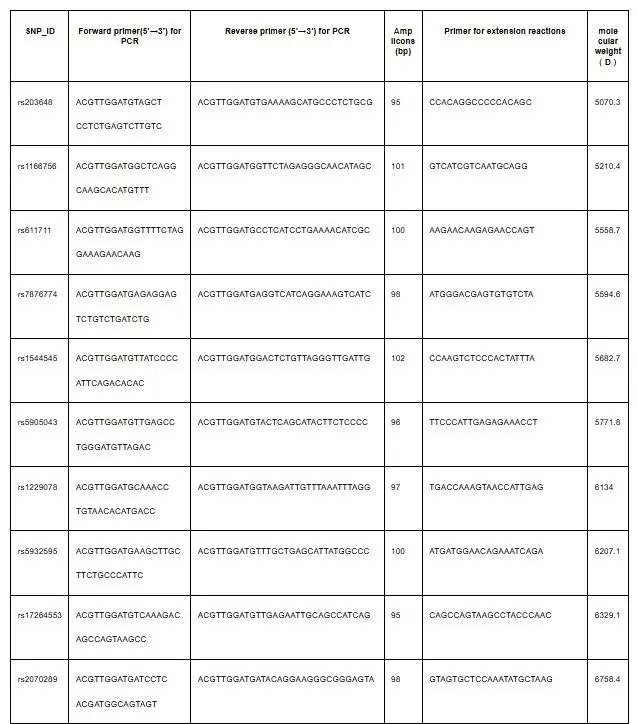
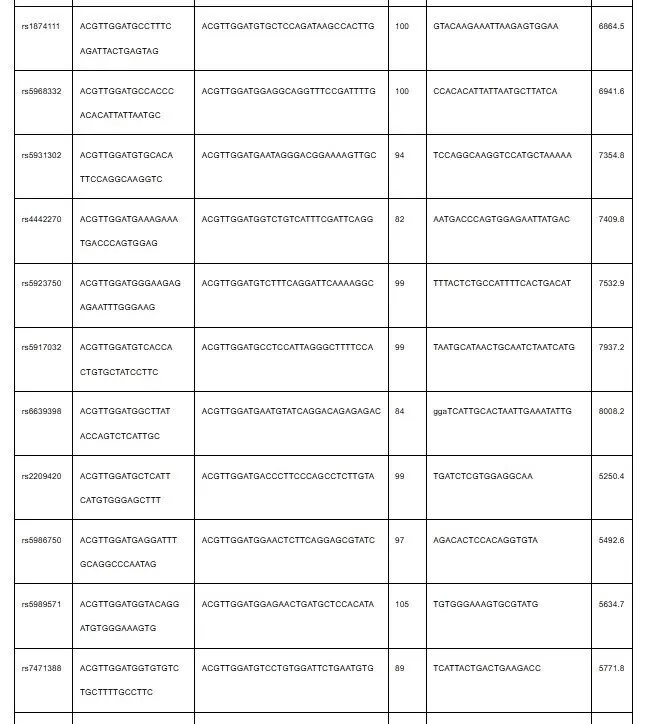
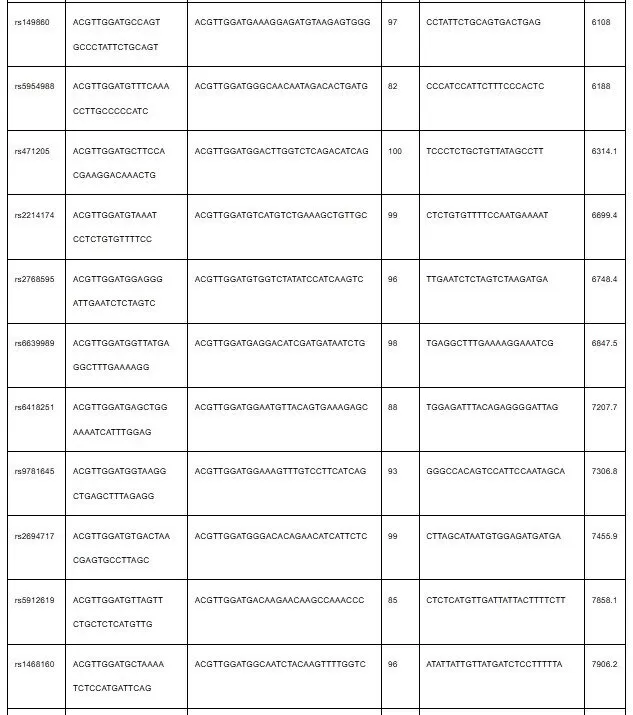
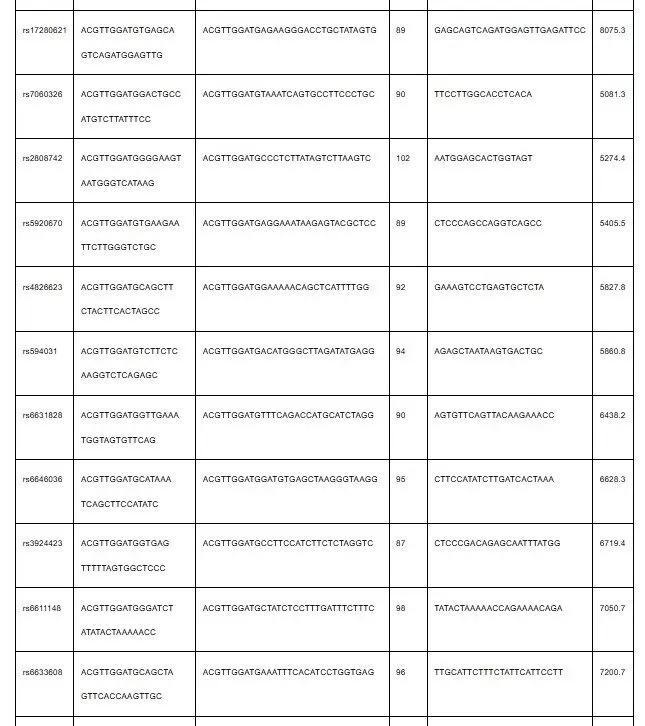
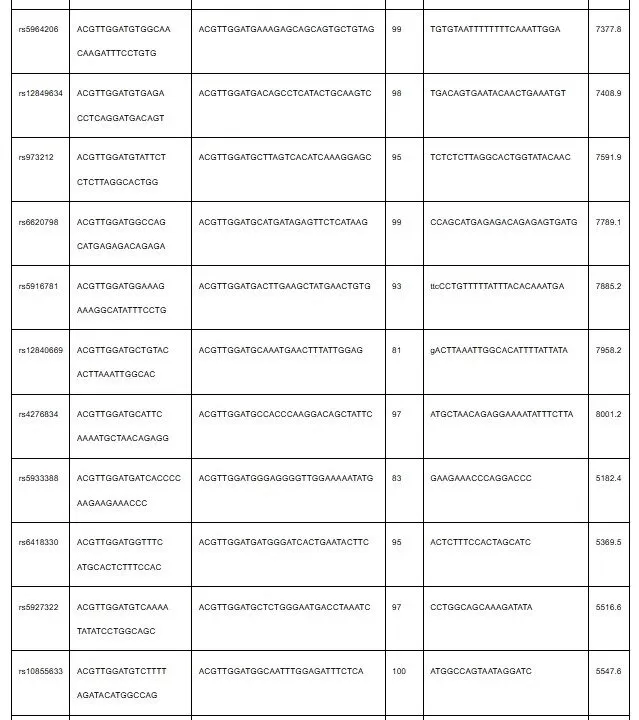
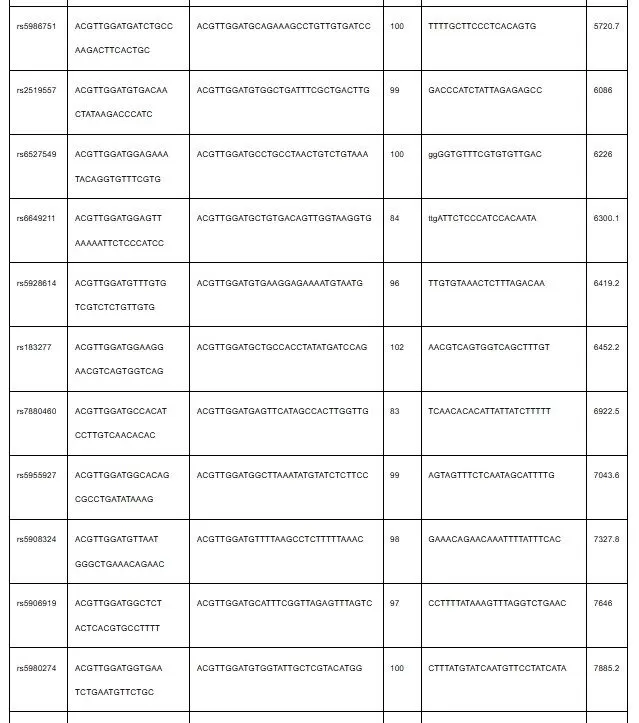
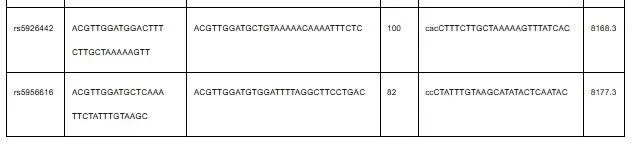
67 SNP markers (Table 1) on X chromosome with high minimal allele frequency (MAF>0.4) were selected from HapMap (www.hapmap.org) and NCBI SNP database (http://www.ncbi.nlm.nih.gov/SNP). The locus to locus space was about 3~20Mb. 67 groups of primers were designed via MassARRAY Assay Design software (Sequenom Inc.). Each group has three primes, including a pair of PCR primes and a single base extension prime (Table 2). Primers were synthesized by Sangon Biotech (Shanghai, China).
Table 1: Primers for Amplification and Extension Reactions of 67 X-SNPs
SNP Typing
SNP genotyping was performed using the MassARRAY MALDI-TOF MS platform (Sequenom Inc.). Briefly, three 17-plex and one 16-plex amplification reactions were processed following standard protocols for iPLEX chemistry. The reaction products were used as templates for the primer extension reactions. All reactions were performed in 384 microtiter plates (Sequenom, Inc.). PCR amplification and primer extension reaction were carried out on a GeneAmp PCR System 9700 (Applied Biosystems, Norwalk, CT), and no-template controls were carried along in every plate to exclude contaminations. A panel of genomic DNA samples genotyped by the assay was sequenced simultaneously for quality control.
Multiplex PCR
SNP genotyping was performed using the MassARRAY MALDI-TOF MS platform (Sequenom Inc.). PCRs (final volume, 5 μL) contained 1μL the desired primers at their optimized concentrations, 0.625μL PCR buffer(10×) (Qiagen GmbH), 0.325μL 25 mmol/L MgCl2, 1μL dNTP (2.5mmol/L) (Tatara Inc.), 0.1μL of HotStarTaq polymerase (5U/μL), 1μL of DNA , and 0.95μL H2O. A tag (5’-ACGTTGGATG) was included in the primer sequence. PCR conditions were 94 °C for 15 min followed by 45 cycles at 94 °C for 20 s, 56 °C for 30 s, and 72 °C for 1 min; and finally 72 °C for 3 min.
SAP Dephosphorylation
After amplification, the products of four reactions (i.e. 17-plex, 16-plex, 17-plex and 17-plex) were treated with shrimp alkaline phosphatase (SAP) to remove excess dNTPs. This reaction contained 0.17μL SAP buffer (10×), 0.3μL SAP (1U/μL), 1.53μL H2O (all from Sequenom Inc.). The reaction conditions were 37 °C for 40 min, followed by 85 °C for 15 min.
Primer Extension Reactions
The PCR products were then used as templates for the primer extension reactions. This reaction (final volume was 9μL) contained 0.94μL extension primers at optimized concentrations,0.1μL iPlex termination mix, 0.2μL iPlex buffer (10×), 0.0205μL iPlex enzyme and 0.7395μL H2O (all from Sequenom Inc). Extension reactions were performed at 94 °C for 30 s followed by 40 cycles at 94 °C for 5 s and 5 cycles of 52 °C for 5 s, 80 °C for 5 s; and finally 72 °C for 3 min. The extension products were treated with a cationic exchange resin (AG® 50W-X8 Resin; Bio-Rad Laboratories, Inc.) for 30 min to remove salts.
MALDI-TOF MS
The products were spotted onto the MassARRAY SpectroCHIP with an auto-spot arm (Sequenom, Inc.) and then the target plate was inserted into the MALDI-TOF mass spectrometer of MassARRAY compact System (Sequenom, Inc.). The mass range of the MS instrument was set at 3920—12023 Da. SNP loci was genotyped by MassArray Typer Analyzer software version 4.0 (Sequenom, Inc.).
Statistical Analysis
Tests of Hardy-Weinberg equilibrium (HWE) and linkage disequilibrium were performed using the Power marker v3.25 program. The formula for calculation of expected heterozygosity (H) and polymorphism information contents (PIC) were introduced by Nei and Roychoudhury (1974) The formula for calculation of discrimination power and exclusion probability were published by Szibor et al (2003).
Results and Discussion
Validation
The procedure to type SNPs used in this study was convenient with multiplexes where 67 X-SNP markers were amplified in four reactions. Validating carried out on control DNA 9947A and DNA extracts prepared from blood samples with known X-SNP profiles from MALDI-TOF MS assay by sequencing revealed fully consistent and reproducible results.
The MALDI-TOF MS technique requires the initial concentration of DNA is not less than 50ng/µL. If the amount of DNA is limited, it may be necessary to use other platform such as SNaPshot (Bouakaze et al 2007 and Wei et al 2012) or to perform a whole genome amplification of the sample previously.
Testing of Linkage Disequilibrium and Calculation for ‘Forensic Statistics’
Population data of 67 X-SNPs were obtained. The exact test of 67 X-SNPs showed no deviation from Hardy-Weinberg equilibrium (p>0.05) except for rs12849634 (p=0.0007).
Two out of the other 66 X-SNP loci (i.e.rs1229078, rs1544545) were found to be low informative (MAF<0.3).Tight LD were observed at six groups (rs5986750- rs5986751, rs183277 – rs7060326, rs6611148 – rs4826623, rs5923750 – rs1166756, rs6620798 – rs5917032, rs2519557 – rs6649211)and slight LD were found at two groups (rs4276834 – rs5928614ï¼›rs5968332 – rs6418330). 52 X-SNP loci showing independent inheritance and high polymorphisms were finally selected out (Table 2). Based on the population data (Table 2), the combined values of Discrimination Power in female population and male populations are as follows: CDPf=0.9999999999999999999 and CDPm=0.99999999999999931. The combined values of Exclusion Probabilities in trio cases and duo case were are as follows: CPEtrios=0.99999999996 and CPEduos=0.9999995. The results revealed that the SNP panel on X chromosome yield the equivalent power in forensic identification as 15 STR markers currently used.
Table 2: Forensic efficiency of 52 X-SNPs
No
X-SNP
allele
frequency
H
PIC
DPfemale
DPmale
PEtrios
PEduos
1
rs6639398
A/G
0.50/0.50
0.5017
0.3750
0.6250
0.5000
0.3750
0.2500
2
rs6631828
C/T
0.50/0.50
0.5017
0.3750
0.6250
0.5000
0.3750
0.2500
3
rs5917032
C/G
0.50/0.50
0.5017
0.3750
0.6250
0.5000
0.3750
0.2500
4
rs5912619
A/G
0.51/0.49
0.5016
0.3750
0.6250
0.4999
0.3750
0.2500
5
rs2070289
A/G
0.49/0.51
0.5016
0.3750
0.6250
0.4999
0.3750
0.2500
6
rs3924423
C/T
0.51/0.49
0.5015
0.3749
0.6249
0.4998
0.3749
0.2499
7
rs9781645
C/T
0.51/0.49
0.5014
0.3748
0.6248
0.4997
0.3748
0.2498
8
rs183277
G/A
0.51/0.49
0.5013
0.3748
0.6248
0.4996
0.3748
0.2498
9
rs2209420
A/C
0.51/0.49
0.5013
0.3748
0.6248
0.4996
0.3748
0.2498
10
rs5933388
C/T
0.51/0.49
0.5013
0.3748
0.6248
0.4996
0.3748
0.2498
11
rs5908324
A/G
0.48/0.52
0.5010
0.3746
0.6246
0.4993
0.3746
0.2496
12
rs5980274
C/T
0.52/0.48
0.5004
0.3744
0.6244
0.4987
0.3744
0.2494
13
rs6639989
G/T
0.53/0.47
0.4998
0.3741
0.6240
0.4981
0.3741
0.2490
14
rs5954988
C/T
0.54/0.46
0.4990
0.3737
0.6237
0.4973
0.3737
0.2487
15
rs1874111
A/T
0.46/0.54
0.4989
0.3734
0.6236
0.4972
0.3734
0.2486
16
rs2808742
A/G
0.54/0.464
0.4987
0.3735
0.6235
0.4970
0.3735
0.2485
17
rs5931302
C/G
0.54/0.46
0.4983
0.3733
0.6233
0.4966
0.3733
0.2483
18
rs6611148
G/T
0.46/0.54
0.4982
0.3731
0.6231
0.4963
0.3731
0.2481
19
rs5986750
A/G
0.55/0.45
0.4973
0.3728
0.6228
0.4956
0.3728
0.2478
20
rs5964206
C/G
0.45/0.55
0.4957
0.3718
0.6220
0.4940
0.3718
0.2470
21
rs6646036
C/T
0.45/0.55
0.4957
0.3718
0.6220
0.4940
0.3718
0.2470
22
rs7876774
C/T
0.56/0.44
0.4950
0.3717
0.6216
0.4934
0.3717
0.2467
23
rs2694717
A/C
0.44/0.56
0.4945
0.3714
0.6213
0.4928
0.3714
0.2464
24
rs5920670
A/G
0.44/0.56
0.4945
0.3714
0.6213
0.4928
0.3714
0.2464
25
rs594031
C/T
0.44/0.56
0.4938
0.3710
0.6210
0.4921
0.3710
0.2461
26
rs5906919
A/G
0.57/0.43
0.4931
0.3708
0.6206
0.4915
0.3708
0.2457
27
rs471205
A/G
0.43/0.57
0.4931
0.3708
0.6206
0.4915
0.3708
0.2457
28
rs7471388
C/G
0.43/0.57
0.4931
0.3707
0.6206
0.4915
0.3707
0.2457
29
rs5928614
A/G
0.57/0.43
0.4926
0.3702
0.6203
0.4909
0.3702
0.2454
30
rs1166756
C/G
0.43/0.57
0.4924
0.3703
0.6202
0.4908
0.3703
0.2454
31
rs5926442
C/T
0.43/0.57
0.4907
0.3694
0.6193
0.4889
0.3694
0.2445
32
rs2214174
A/G
0.42/0.58
0.4902
0.3692
0.6191
0.4885
0.3692
0.2443
33
rs6418330
A/G
0.42/0.58
0.4901
0.3692
0.6190
0.4884
0.3692
0.2442
34
rs149860
C/G
0.58/0.42
0.4901
0.3692
0.6190
0.4884
0.3692
0.2442
35
rs5905043
C/T
0.42/0.58
0.4901
0.3693
0.6190
0.4884
0.3693
0.2442
36
rs6649211
A/C
0.42/0.57
0.4900
0.3691
0.6190
0.4883
0.3691
0.2442
37
rs5989571
A/T
0.58/0.42
0.4887
0.3682
0.6182
0.4870
0.3682
0.2435
38
rs17280621
A/G
0.58/0.42
0.4887
0.3684
0.6182
0.4870
0.3684
0.2435
39
rs5956616
A/G
0.42/0.58
0.4875
0.3678
0.6176
0.4859
0.3678
0.2429
40
rs203648
A/G
0.58/0.42
0.4875
0.3678
0.6176
0.4859
0.3678
0.2429
41
rs2768595
A/T
0.58/0.42
0.4874
0.3678
0.6176
0.4857
0.3678
0.2429
42
rs6633608
A/T
0.40/0.60
0.4837
0.3661
0.6156
0.4821
0.3661
0.2410
43
rs1468160
A/G
0.60/0.40
0.4829
0.3655
0.6151
0.4813
0.3655
0.2406
44
rs5955927
C/T
0.60/0.40
0.4827
0.3653
0.6150
0.4811
0.3653
0.2405
45
rs7880460
G/T
0.61/0.39
0.4792
0.3638
0.6130
0.4776
0.3638
0.2388
46
rs12840669
C/T
0.62/0.38
0.4752
0.3614
0.6107
0.4736
0.3614
0.2368
47
rs6418251
A/C
0.62/0.38
0.4734
0.3605
0.6097
0.4718
0.3605
0.2359
48
rs973212
C/T
0.62/0.38
0.4718
0.3597
0.6088
0.4702
0.3597
0.2351
49
rs5916781
A/G
0.62/0.38
0.4710
0.3592
0.6083
0.4694
0.3592
0.2347
50
rs5927322
A/G
0.64/0.36
0.4624
0.3549
0.6031
0.4608
0.3549
0.2304
51
rs5932595
G/T
0.34/0.66
0.4512
0.3486
0.5960
0.4496
0.3486
0.2248
52
rs17264553
G/T
0.34/0.66
0.4501
0.3480
0.5953
0.4486
0.3480
0.2243
Comparison of Population Genetic Data
Of the 67 X-SNP loci, 10 loci (i.e. rs1229078, rs1544545, rs4442270, rs1874111, rs5968332, rs1166756, rs12849634, rs5932595, rs203648 and rs611711) has been reported the power of discrimination and power of exclusion among Spanish population from coastal area and Pas valley by Zarrabeitia (2007). Analysis of pairwise genetic data between the Spanish population and the Chinese Han groups revealed strong similarities at seven X-SNP loci (i.e. rs4442270, rs1874111, rs5968332, rs1166756, rs5932595, rs203648 and rs611711), but highly significant differences at three X-SNP loci (i.e. rs1229078, rs1544545 and rs12849634). For example, the discrimination power of rs12849634 in Chinese Han female population and male populations were 0.0616 and 0.0316 respectively, but the values were as high as 0.6 and 0.5 respectively in the Spanish population. As for the other two loci, rs1229078 and rs1544545, their polymorphisms in the Spanish population were also higher than that in Chinese Han population.Therefore, it is necessary to investigate the polymorphisms in particular race in order to apply the X-SNP markers to the race.
The results in this study showed that the panel consisting of 52 X-SNP markers was high informative in Chinese Han population. It gives reasonable discrimination and paternity exclusion power that is sufficient for forensic identification.
Acknowledgements
This work was supported by grants from Shanghai Natural Science Foundation and National Institute Scientific Program (Nos.08ZR1419800 and GY0805).