Introduction
Cardiovascular hemodynamics are largely determined by the viscoelastic properties of the large arteries (O’Rourke and Mancia 1999), and pulse wave velocity (PWV) is generally accepted as the simplest non-invasive and most reproducible method for assessing large artery stiffness (Laurent et al 2006). Blacher et al (1999) suggest that measurement of PWV should therefore play a more important role in the clinical care of patients with cardiovascular diseases than what is currently the case.
PWV is usually recorded between the carotid and femoral arteries. The pressure wave can be recorded directly with applanation tonometers, mechanotransducers or ultrasonographic systems. A surrogate for PWV is the stiffness index (SI), a variable that may be measured using photoplethysmography. The SI has generated much interest as a method to assess the consequences of arterial stiffness on the capillaries (Takazawa et al 1998, Chowienczyk et al 1999, Millasseau et al 2000, Millasseau et al 2002, Millasseau et al 2006). The correlation between the SI and the carotid-femoral PWV may, however, not be very good (Salvi et al 2008).
Variations in the performance of the devices and the measurement procedure itself, together with a lack of appropriate reference values, have largely excluded the use of PWV from clinical practice. Also, the measurement of the carotid-femoral PWV is quite complicated and too time consuming to be of use in general practice. In this study, we compared Doppler ultrasound carotid-femoral PWV measurement to a simpler and easier photopletyshmographic SI measurement for the assessment of cardiovascular risk (the European guidelines for the management of high blood pressure 2013).
Patients, Materials and Methods
The study population was recruited among successive drug-treated hypertensive patients in Health Center Pulssi in Turku, Finland, and in the outpatient clinic of the Department of Medicine of the Turku University Hospital, Turku, Finland. The study protocol was approved by the local ethics committee and the study conducted in accordance with the Helsinki Declaration. The participants provided written informed consent.
Arterial stiffness was measured after the patient had rested for 15 minutes supine in a room at a constant temperature at 22-24 ºC. Before the examination, the subjects were not allowed strenuous physical exercise, alcoholic beverages since the previous evening and smoking and drinking caffeine-containing beverages for the two preceding hours. They were allowed to have a breakfast in the morning of the measurement day. Along with the examination, blood pressure and heart rate were measured 5 times to ensure a stable state. A conventional automatic sphygmomanometer was used and the reading was taken from the patient’s right brachium. The average of the 5 measurements was calculated. After this, all subjects underwent doppler ultrasonography and photoplethysmography for assessment of the PWV and SUI, respectively.
Doppler Ultrasonography
A Doppler ultrasonography device (Micro Medical PulseTrace PWV, Micro Medical Ltd; Rochester, Kent, UK) was used to measure the carotid-femoral (C-F) PWV. The conventional foot-to-foot method was used; here, the time delay between the feet is measured on basis of the waveforms obtained at the two arterial sites. The transit time between the two measurement sites is automatically calculated by the device and was the mean value of three successful recordings, successful meaning 10 seconds of non-interfered waveform.
The measurement sites were located exclusively on the right side of the body, and the distances were measured manually. The carotid-femoral distance was measured as a straight line between the jugular notch and the femoral measurement site. The PWV was calculated by the device simply by dividing the distance with the transit time.
Photoplethysmography
The PulseTrace photoplethysmography device is a combination device integrating both Doppler US and photoplethysmographic measurements) (Micro Medical PulseTrace PWV, Micro Medical Ltd; Rochester, Kent, UK). This device was used for photoplethysmography, which was carried out with a finger clip transducer placed on the right index finger of the patient. The stiffness index (SI) was formulated automatically by the computer as the subject’s height (meters) divided by the transition time (seconds) from the first systolic peak to the inflection point of the reflection waveform by the digital volume pulse. The mean within-subject coefficient of variation of SI for measurements at weekly intervals has been 9.6 % (Millasseau et al 2002). Three consecutive measurements of stable quality, each at least 10 seconds long, were used for calculating the mean SI values.
Demographic Factors
The following variables were collected of each patient: gender, age, smoking history, alcohol drinking habits, exercise habits, duration of hypertension and hypertensive medication, presence of diabetes mellitus or hypercholesterolemia, medication, cardiovascular diseases in the close family, Raynaud’s sign, height, weight, body mass index (BMI) and waist circumference.
Laboratory Tests
Fasting plasma creatinine, glucose, lipids and the urine albumin/creatinine ratio were assessed with conventional laboratory methods in the laboratory of the Turku University Hospital. An ECG was recorded and examined for voltage criteria (Sokolow-Lyon and Cornell) compatible with left ventricular hypertrophy (LVH), signs of left ventricular strain, arrhythmia and conduction disturbances.
Statistical Analyses
The continuous variables are expressed as mean (SD). Database management and statistical analyses were performed using IBM’s SPSS statistics software, version 21.0. Group differences of continuous variables were analyzed by analysis of variance. The cut-off level for statistical significance was set at a P-value
Results
The study population consisted of 337 subjects (189 men and 148 women) aged 32-88 (mean age 65.4 (14.2) years. The male patients were older, longer and heavier and their waist circumference was larger. They smoked more and had type 2 diabetes mellitus more often. Both systolic and diastolic blood pressure were higher among the females, but their heart rate was lower, as was their total cholesterol, HDL-cholesterol and LDL-cholesterol. Their carotid-femoral PWV was higher (Table 1). Twenty-eight of the 337 subjects (8.3 %) had left ventricular hypertrophy as assessed by electrocardiography.
Of the patients, 13.9 % used one and 84.1 % two or more pharmaceuticals to treat their hypertension. An ACE-inhibitor or an angiotensin II receptor antagonist was used by 78.4 %, a beta blocker by 27.7 %, a calcium antagonist by 39.4 %, a diuretic by 46.3 % and some other antihypertensive medication by 2.2 % of the patients. Statin medication was used by 42.4 %.
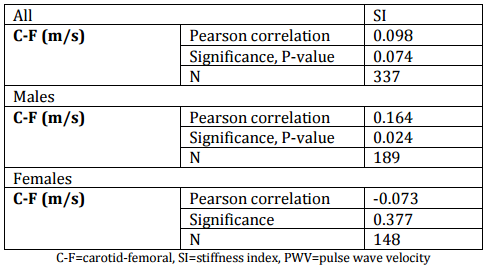
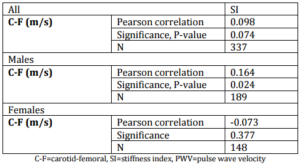
The photoplethysmographically measured SI correlated significantly, but weakly (r=.164, p=0.024) with the carotid-femoral PWV in males, but this was not the case for females (r=.-0.074, p=0.377) nor the whole study population (r=0.098, p=0.074) (table 2).
The correlation coefficient describing the correlation between SI and C-F was SI=8.773+0.087 x C-F. Thus, the a value of C-F>12.0 m/s (11) corresponds to >9.82 m/s. The sensitivity of the SI measurement was 54.4 % and specificity 56.2 % compared to the C-F Doppler US measurement. The positive predictive value of the SI measurement was 27.6 % and the negative predictive value 80.1 % compared to US C-F measurement. The probability of a false positive value (not true positive) was 43.8 % and of a false negative value (not true negative) was 45.6 %. The patients in whom no correlation was seen were older (high C-F but low SI, age 71.0 (5.8) years). Otherwise no demographic differences were noticed. No difference was seen in patients with high SI but low C-F.
Discussion
In this study there was a significant, albeit weak, correlation between the golden standard (the carotid-femoral pulse wave velocity) and the photoplethysmographic SI value only in males. The SI was not sensitive and specific enough and its positive and negative predictive values were not good enough to separate the patients with high (>12.0 m/s) pulse wave velocity from other patients. Our results suggest, then, that photoplethysmograpgic pulse wave velocity measurement, although simple and fast, cannot identify the same patients with high pulse wave velocity as Doppler ultrasound.
Commercial devices based on the photoplethysmographic technique have gained popularity for PWV measurements. Photoplethysmography is easy to perform, necessitates no special training and is harmless for the patient. There are a number of studies to relate the digital volume pulse to the peripheral pressure pulse and these have suggested that the digital volume pulse might be a simple, non-invasive measure of large artery stiffness and vascular reactivity (Takazawa et al 1998, Millasseau et al 2000, Chowienczyk et al 1999, Millasseau et al 2002, Millasseau et al 2006). C comparative evaluations with photoplethysmography and conventionally assessed PWV have been scare.
In our study, the PulseTrace PWV device was used for photoplethysmography, i.e., the same device as used by Salvi et al (2008). They compared three commercial methodologies of pulse wave velocity measurement [(Complior, Pulse Pen and Pulse Trace (photoplethysmography)] in 50 patients aged 20-84 years (mean age 49.3 years). They reported a significant correlation between Pulse Trace and the reference method between carotid-femoral PWV and the photopletyshmographic SI only in the males, which was the same as we found. In our study, there was no correlation between PWV and SI over the whole population. Only about 20 % of the patients in the study by Salvi et al (2008) were hypertensive and more than half of them did not have cardiovascular disease. Our patients were older and all were on antihypertensive medication, i.e., a target group for future cardiovascular risk. The number of patients in our study was also much higher (50 vs. 337). About 30 % of our patients reached the target blood pressure. In the study of Millaseau et al (2002) a significant correlation between PWV velocity (determined by SphygmoCor) and SI (based on digital volume pulse waves) was also reported. The authors proposed, in consequence, that analysis of the digital volume pulse could be a simple measure of large artery stiffness.
Salvi et al (2008) used the Bland-Altman method to analyze their own data as well as the data of Millasseu et al (2002). The reported that the difference between the reference method and analysis with Pulsetrace or DVP differed by more than 1 m/s in 66 % (51 %) of the subjects and by more than 2 m/s in 26 % (23 %) of the subjects. Accordingly, Salvi et al (2008) stated that these results show that PulseTrace is not an appropriate way tio measure aortic PWV in the clinic. We evaluated also the sensitivity, specificity and positive and negative predictive values and agree with the conclusion made by Salvi et al (2008).
In our study, we used a cut-off value of 12.0 m/s, not the 10 m/s, as suggested in a recent expert consensus document in 2012 (vanBortel). This new cut-off value is based on a reduction of the measured distance between the carotid artery and the common femoral artery by multiplying it with 0.8. Accordingly 12 m/s using the exact distance equals 9.6 m/s using the distance reduced by 20%. There is no significant difference between the cut-off value used in the present study and the 10 m/s suggested in the consensus document. Many of our measurements were also made before the consensus document was published.
In previous studies, the results of the photoplethysmographically measured SI values have been associated with hypertensive target organ damage in untreated hypertensive patients (Chen et al 2005, Tsai et al 2007), with non-alcoholic fatty liver (Chen et al 2012) and with insulin resistance (Chou et al 2013). We have not studied these associations in this paper. Salvi et al (2008) reported a significant correlation between age and PWV measured in different ways – by applanation tonometry, by dedicated mechanotransducers (Complior II) and by photoplethysmography. Despite neither Salvi et al (2008) nor we could establish that photoplethysmographic SI measurements detected the same patients with high PWV as Doppler ultrasound or applanation tonometer. The arterial compliance index introduced by Chen et al (2007) and Wang et al (2011) carries a specific clinical significance and may be a better indicator of PWV. A drawback of the arterial compliance index is that a special dual-channel photoplethysmography system is needed for the measurements.
Conclusion
Our study confirms the results by Salvi et al (2008) but in much larger population of hypertensive patients. There was a significant correlation between the golden standard (carotid-femoral pulse wave velocity) and SI measured photoplethysmographically, but only among males. The SI is not sensitive and specific enough and its positive and negative predictive values were insufficient to separate patients with high (>12.0 m/s) pulse wave velocity from the other patients. Our results suggest that measuring pulse wave velocity photoplethysmographically, although simple and fast, does not detect the same patients with high pulse wave velocity as Doppler ultrasound.
Table 1: Data on the Study Population (n=337). Figures are Mean (Standard Deviation)
Table 2: Correlations between Sonographically Measured PWV (Carotid-Femoral PWV) and Photoplethysmographically Measured SI
Acknowledgements
We shall thank Robert Paul MD, PhD, Adjunct professor for editing the English language of this article. We shall thank Taru Kantola, BA for editing the raw data of this study.
References
Blacher, J., Asmar, R., Djane, S., London, G. M. & Safar, M. E. (1999). “Aortic Pulse Wave Velocity as a Marker of Cardiovascular Risk in Hypertensive Patients,” Hypertension, 33 (5) 1111-1117.
Publisher – Google Scholar
Chen, J.- Y., Chou, C.- H., Tsai, W.- C., Wang, M.- C., Ho, C.- S., Li, Y.- H., Tsai, Y.- S. & Tsai, L.- M. (2012). “Effects of Increased Systemic Inflammation and Central Obesity on Arterial Stiffness in Patients with Nonalcoholic Fatty Liver Disease,” Journal of American Society of Hypertension, 6 (4) 253-260.
Publisher – Google Scholar
Chen, J.- Y., Tsai, W.- C., Lin, C.- C., Huang, Y.- Y., Hsu, C.- H., Liu, P.- Y. & Chen, J.- H. (2005). “Stiffness Index Derived from Digital Volume Pulse as a Marker of Target Organ Damage in Untreated Hypertension,” Blood Pressure, 14 (4) 233-237.
Publisher – Google Scholar
Chen, J.- Y., Tsai, W.- C., Wu, M.- S., Hsu, C.- H., Lin, C.- C., Wu, H.- T., Lin, L.- J. & Chen, J.- H. (2007). “Novel Compliance Index Derived from Digital Volume Pulse Associated with Risk Factors and Exercise Capacity in Patients Undergoing Treadmill Exercise Tests,” Journal of Hypertension, 25 (9) 1894-1899.
Publisher – Google Scholar
Chou, C. H., Tsai, W. C., Wang, M. C., Ho, C. S., Li, Y. H., Tsai, L. M., Tsai, Y. S. & Chen, J. Y. (2013). “Effects of Deranged Glucose Homeostasis on Peripheral Arterial Stiffness Index in Patients with Pre-Diabetes Mellitus,”International Heart Journal, 54 (1) 27-32.
Publisher – Google Scholar
Chowienczyk, P. J., Kelly, R. P., MacCallum, H., Millasseau, S. C., Andersson, T. L. G., Gosling, R. G., Ritter, J. M. & Änggård, E. E. (1999). “Photoplethysmographic Assessment of Pulse Wave Reflection,” Journal of American College of Cardiology, 34 (7) 2007-2014.
Publisher – Google Scholar
Laurent, S., Cockcroft, J., Van Bortel, L., Boutouyrie, P., Giannattasio, C., Hayoz, D., Pannier, B., Vlachopoulos, C., Wilkinson, I. & Struijker-Boudier, H. (2006). “Expert Consensus Document on Arterial Stiffness: Methodological Issues and Clinical Applications,” European Heart Journal, 27 (21) 2588-2605.
Publisher – Google Scholar
Millasseau, S. C., Guigui, F. G., Kelly, R. P., Prasad, K., Cockcroft, J. R., Ritter, J. M. & Chowienczyk, P. J. (2000). “Noninvasive Assesment of the Digital Volume Pulse: Comparison with the Peripheral Pressure Pulse,” Hypertension, 36 (6) 952-956.
Publisher – Google Scholar
Millasseau, S. C., Kelly, R. P., Ritter, J. M. & Chowienczyk, P. J. (2002). “Determination of Age-Related Increases in Large Artery Stiffness by Digital Pulse Contour Analysis,” Clinical Science, 103 (4) 371-377.
Publisher – Google Scholar
Millasseau, S. C., Ritter, J. M., Takazawa, K. & Chowienczyk, P. J. (2006). “Contour Analysis of the Photoplethysmographic Pulse Measured at the Finger,” Journal of Hypertension, 24 (8) 1449-1456.
Publisher – Google Scholar
O´Rourke, M. F. & Mancia, G. (1999). “Arterial Stiffness,” Journal of Hypertension, 17 (1) 1-4.
Publisher
Salvi, P., Magnani, E., Valbusa, F., Agnoletti, D., Alecu, C., Joly, L. & Benetos, A. (2008). “Comparative Study of Methodologies for Pulse Wave Velocity Estimation,” Journal of Human Hypertension, 22 (10) 669-677.
Publisher – Google Scholar
Takazawa, K., Tanaka, N., Fujita, M., Matsuoka, O., Saiki, T., Aikawa, M., Tamura, S. & Ibukiyama, C. (1998). “Assessment of Vasoactive Agents and Vascular Aging by the Second Derivative of Photopletysmografic Waveform,”Hypertension, 32 (2) 365-370.
Publisher – Google Scholar
The Task Force for the management of Arterial Hypertension of the European Society of Hypertension (ESH) and of the European Society of Cardiology (ESC). 2013 ESH/ESC. (2013). ‘Guidelines for the Management of Arterial Hypertension,’Journal of Hypertension, 31 (7) 1281-1357.
Google Scholar
Tsai, W.- C., Lin, C.- C., Huang, Y.- Y., Chen, J.- Y. & Chen, J.- H. (2007). “Association of Increased Arterial Stiffness and Inflammation with Proteinuria and Left Ventricular Hypertrophy in Non-Diabetic Hypertensive Patients,” Blood Pressure, 16 (4) 270-275.
Publisher – Google Scholar
Van Bortel, L., Laurent, S., Boutouyrie, P., Chowienczyk, P., Cruickshank, J. K., deBacker, T., Filipovsky, J., Huybrechts, S., Mattace-Raso, F. U. S., Protogerou, A. D., Schillaci, G., Segers, P., Vermeersch, S. & Weber, T. on behalf of the Artery Society, the European Society of Hypertension Working Group on Vascular Structure and Function and the European Network for Noninvasive Investigation of Large Arteries. (2012). “Expert Consensus Document on the Measurement of Aortic Stiffness in Daily Practice Using Carotid-Femoral Pulse Wave Velocity,” Journal of Hypertension, 30 (3) 445-448.
Publisher – Google Scholar
Wang, M.- C., Wu, A.- B., Cheng, M.- F., Chen, J.- Y., Ho, C.- S. & Tsai, W.- C. (2011). “Association of Arterial Stiffness Indexes, Determined from Digital Volume Pulse Measurement and Cardiovascular Risk Factors in Chronic Kidney Disease,” American Journal of Hypertension, 24 (5) 544-549.
Publisher – Google Scholar