Introduction
Following the identification of its impact on organizational structure, innovation has been the focus of much academic research in various sectors (Woodward 1965). Technological innovation, in particular, plays an active role in managing the organization, decision making, structural performance and the apprehension of the environment (Gillespie and Mileti 1977). Banking services are among the most concerned sectors by these effects since, in the current international and competitive framework, banks seek innovative solutions for their specific development and set up a differentiated identity. A crucial component of the future of organizations such as technological innovation offers opportunities but also risks; hence the decision of its integration into banks should match with the ensuing consequences at all levels.
The present economic situation, for its part, is undeniably marked by a more demanding customer, an increasingly tough competitive situation through multiple points of sales and relational contact with the client. Therefore, the latter is entitled to choose the type of media of a given contact with a company or brand. The banking sector has not escaped this trend where the social contact between the client and the provider is no longer mandatory for the issuance of a requested service. Rightly, “E-banking” technological innovation provides banks -which are faced with these interrelated demands- with a plausible solution capable of satisfying the constraints system imposed by the client and the competitors (Daft 2001). However, and as surprising as it may seem, technological innovation in the banking sector is often not systematically adopted, or at least, the level of adoption is very disparate from one bank to another, which reveals, on the one hand, the decisive role of some factors determining the behavior of banks towards innovation and, on the other hand, the complexity of this phenomenon (Toufaily, Daghfous, 2005). Thus, we focus in this article on the identification and analysis of the most decisive variables in the behavior of banks towards technological innovation through a factor analysis approach.
The Literature Review
Definitions of Technological Innovation and Electronic-Banking
The level of impact on typical consumption patterns determines the character of a new product or service (Robertson, 1971). Thus, by adopting the criterion of the type of the impact on consumption patterns Robertson (1971) proposes a classification of innovations as follows: A continuous innovation (does not generate a categorical change in pre-established consumption patterns and is usually manifested by the fact of making changes on what already exists instead of creating a new product / service), a discontinuous innovation (encourages the creation of all that is new by bringing, consequently, new patterns of consumption) and a dynamically continuous innovation (an intermediary innovation between the two preceding patterns).
The concept of innovation was introduced by Rogers and Shoemaker (1971) as “an idea, practice or object perceived as new by an individual.” And although it was initially applied to products, the concept of innovation is of no obstacle to be duplicated on services, which some authors have defined as part of this particular sector (Rolland, 2003). Indeed, according to Robertson (1971) “a new service is considered as a technological innovation when its characteristics and method of use are either totally new or significantly improved on the level of quality or in terms of performance and used technologies”. Technological innovation is also defined by the OECD (Manuel from Oslo, 1997) “as the development of a higher performing offer in order to provide consumers with objectively new or improved services”. Hence, the innovation that subverted the banking sector the most is definitely e-banking using electronic media distribution services and communication with the client (ATM, telephone, Internet …) by integrating remote services. Balbi and Kirsner (1997) admit that this technology can provide any type of financial service by any means of efficient information system where accessibility is based on the level of technology implemented.
The increased competition, the extension of technology and particularly the Internet, the increased demand for more accessible, flexible and personalized services, the difference in cost of service delivery between electronic channels and traditional ones, are all factors that have contributed to the development of electronic banking channels (Sawhney and Parikh, 2001). The various services offered by a bank where the mediating support is a contact of electronic type are called electronic banking services or “e-banking”. Vilattes (1997) suggests the grouping of services that may be issued through the electronic-banking into four categories: consulting and planning, sales and marketing (customer targeting, sales prospecting, study design), financial operations and, finally, information transfer. Moreover, we distinguish, in chronological order of innovation occurrence:
– The “phone banking”, which is any service performed by the customer with a simple phone call to the bank. In this case, the technological support is a land line phone where the service is usually maintained by a call center.
– The ATM machine or cash dispenser, which is a fairly large distribution in number of ATM machines in various locations geographically dispersed to ensure a certain proximity for the customer with the possibility of reaching different services without necessarily going through the bank branch.
– “Internet-banking” or also “online banking”, which is the set of services available through the web channel and based on the performance of its potential means of networking and online activities. This is the most technological and complex channel.
– The “mobile banking” in which the support of service delivery is a cell phone attached to the WAP or Wireless Application Protocol. This service allows customers, via his/her cell phone to access certain services of the bank through an agreement between a bank and one of the mobile operators.
Closely-Related Concepts: Adoption of Innovation and Innovativeness
In literature, the concept of adoption of innovation is often positioned in two different angles of study. Robertson (1971) is among the supporters of the first angle that defines the adoption of innovation as “the process of accepting a novelty (idea, product or brand), by a decision unit (an individual or a firm) operating in a particular social system. Adversely, Rogers (1983) defines this concept from a different angle by considering it as “a mental process through which an individual or a decision-making unit moves from the mere knowledge of an innovation to forming an attitude with respect to the latter, to the decision of adoption or rejection, and, finally, to the confirmation of this decision”
In this article, we advocate the approach of Robertson (1971) where the adoption of innovation is regarded rather as the decision to use the innovation on a permanent basis. In a similar vein, Robertson (1971), in his definition of innovation adoption, emphasizes the distinctive feature of the continuous use of innovation as a commitment and not as a purchase test.
Moreover, the concept of innovativeness is closely linked to that of innovation. In fact, several authors have attempted to define this notion: Hirschman (1980) defines innovativeness as “the inherent search for novelty resulting in a tendency to introduce novelty in one’s life in general, regardless of external influence. While Toufaily (2004) defines the behavior of innovativeness as “the tendency to make decisions for or against the adoption of innovation of E-banking, in other words, the adoption of the whole or part of the electronic channels offered by this innovation”.
The Variables Influencing the Adoption of Innovation in Literature
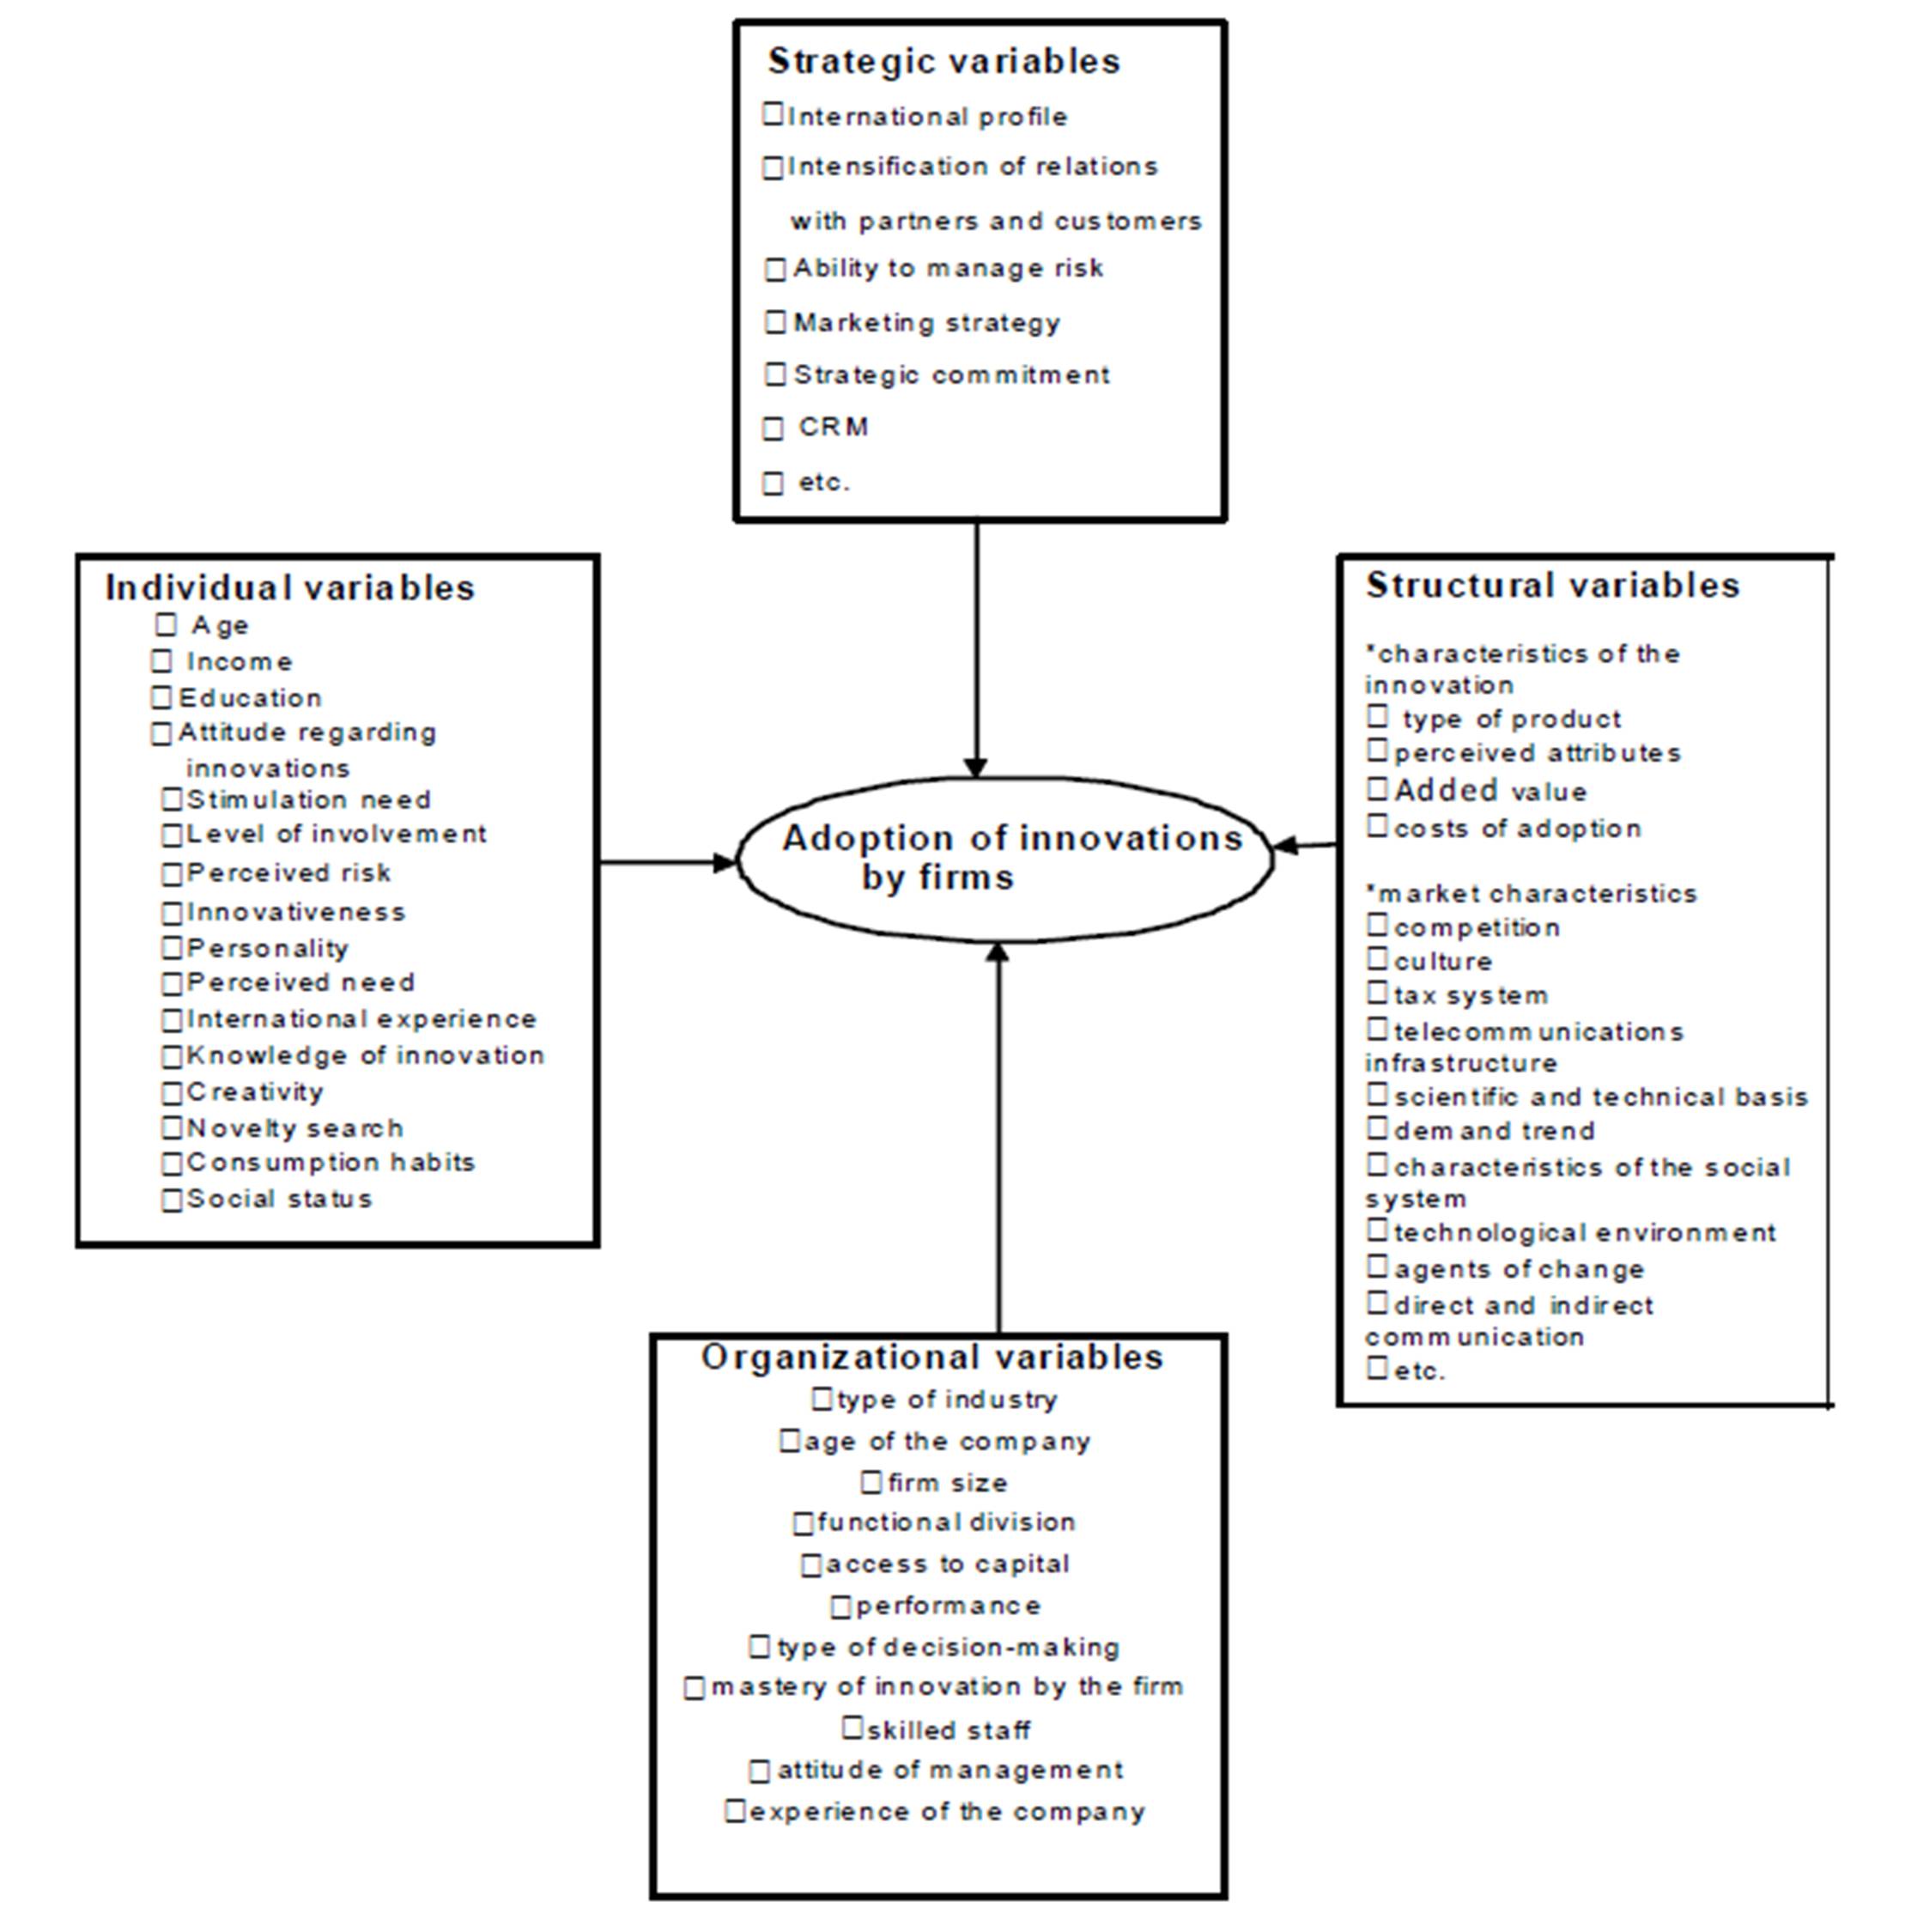
The fact that a large number of variables of different types come out to influence the adoption of innovation makes of the latter a multidimensional phenomenon. A complementary type marks some of these variables, which implies similar results, whereas some others are rather more controversial (Toufaily, 2004). It should be noted that our objective is not to exhibit the results and the theoretical relationships between these variables and the central concept of this study but rather to select the most relevant variables identified in the literature and relating to the adoption of innovation to adapt and apply them ,later, as predictors of the adoption of e-banking. Nevertheless, we rely on the classification proposed by Toufaily (2004) about the variables influencing the adoption of innovation in various categories so as to simplify their reading. Thus, four different categories can be identified:
– Structural variables (Robertson, 1989; Gauvin and Sinha, 1991; Riddle, 2001; Nicoletti, 2003): These are factors related to innovation itself and target market. For example: The competitive situation, the technological environment, the estimated costs following the adoption, the category of product or service, and the potential added value generated by innovation …
– Organizational variables (Mansfield, 1986; Levin et al, 1987; Langley and Truax, 1994; Diniz, 1998): These are the specific characteristics of each business as an entity and that may impact its adoption behavior of innovation. For example: The experience of the business, its size, its financial strength, the type of decision, and the full control of innovation.
– Strategic variables: These are the factors that explain the strategic choices of a given company as marketing orientation (Song and Parry, 1997) and the internationalization of business (Kotler et al, 1991).
– Individual variables (Roehrich et al, 1999; Tan and Teo, 2000; Frini and Limayem, 2001): These are specific personal factors attached to the decision maker in the company such as the perceived need, the age, the attitude to innovation, and the need for stimulation…
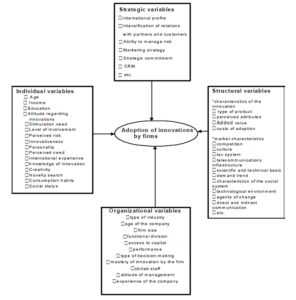
Figure1: General conceptual framework of adoption of innovations by firms
All of these factors of different types set the basis of variables retained to explain the adoption of E-banking. We have relied in our selection on the relevance of these variables and their use by researchers Indeed, although some variables occasionally intervene in explaining the behavior of innovation adoption, others recur frequently. Some features have never been proposed to study the behavior towards innovation.
Our focus on the adoption behavior of innovation specific to the organization as an indivisible entity with specific characteristics to it, regardless of the characteristics of individuals and particularly the decision maker, has motivated our choice to remove the category of individual variables. Thus, we maintain three categories of variables (organizational, structural and strategic) out of the four initially presented and we also retain the variables considered as the most relevant. We should bear in mind for the purpose that we wish to develop a typology of banks on the basis of their degree of adoption of e-banking that we explain, specifically, from the variables included in each category.
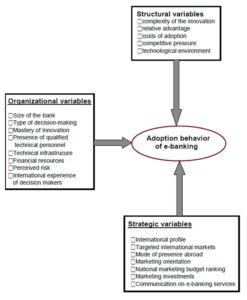
Figure 2: Conceptual framework specific to the study
Empirical Study
Methodology
In order to serve the purposes of this section, the nature of the empirical research is both descriptive and explanatory. It is performed in instantaneous divisions because we limit ourselves to the study of the behavior of banks facing e-banking in a virtually punctual way (the data collection stage has lasted for two years). For the sake of accuracy, empirical study has involved all the banks operating in the domestic market and consists of a personal interview survey conducted through a questionnaire administered by an interviewer. Likewise, the profile of respondents is quite specific given the nature and importance of the quality of information collected. Consequently, the respondents should be well informed and in direct contact with the decision making regarding the adoption of new E-banking channels, namely, marketing managers, directors of information and communication technology (possibly E-banking manager), Heads of Agencies.
The choice of the method of data analysis on our study mainly depends on the satisfaction of various constraints at the same time. Indeed, it amounts to dealing with variables of different types; quantitative and qualitative. In addition, the number of the latter remains relatively high; which could adversely affect the quality of analysis and interpretation, thereafter, as a great deal of information will be scattered over a large amount of variables. Finally, it should be borne in mind that the purpose of this research, beyond the determination of the factors explaining the behavior of innovation adoption by banks, is the development of a typology thereof on the basis of these factors. Thus, we believe that a method based on factorial correspondence analysis (FCA) (Escoffier, 1973; Escoffier and Pagès, 1998) is the most appropriate in keeping these constraints since:
– It reduces a large amount of variables into a few factors that concentrate a large part of the information through the elimination of redundancies in the original data.
– An extension of the FCA method can meet these conditions but also meant to treat the variables with quantitative and qualitative nature at the same time: the method of factor analysis with multiple correspondences (MCA) (Escoffier, 1973; Escoffier and Pagès , 1998).
The basic idea of the MCA method is to eliminate redundancy in the original data, by attempting to summarize the variations with a smaller number of variables (factors) that are a combination of the original variables. It is an inductive method, used as an exploratory tool to update the basic empirical regularities of data set and which has a significant capacity for data description. The primary objective of the MCA is to analyze the dependence structure between individuals (banks) and the variables studied and to highlight the main features, thus representing on one graph all the variables in order to see the interdependence between them. It is, then, possible to determine the focus groups and deduce some links. For this purpose, the SPAD software (version 5.5) has been selected for its performance and adaptability to the MCA method.
In brief, instead of trying to validate assumptions of correlations between explanatory variables of the adoption phenomenon of innovations, achieved by econometric models, we prefer to identify proximity relationships and similarities between these variables which allows us to rank the banks in relation to each other according to their patterns of adoption of E-banking innovations; That is where lies the contribution of the MCA method compared to the econometric method.
Analysis and Results
Given the relatively confidential nature of information provided for the study and the strategic nature of the results, we are committed to respective respondents of banks to submit our results anonymously through coding as follows: Bank 1 (BQ1) Bank 2 (BQ2) … Bank 20 (BQ20). For variables (53 variables) and methods (155 modalities) coding has been used to facilitate the processing of information.
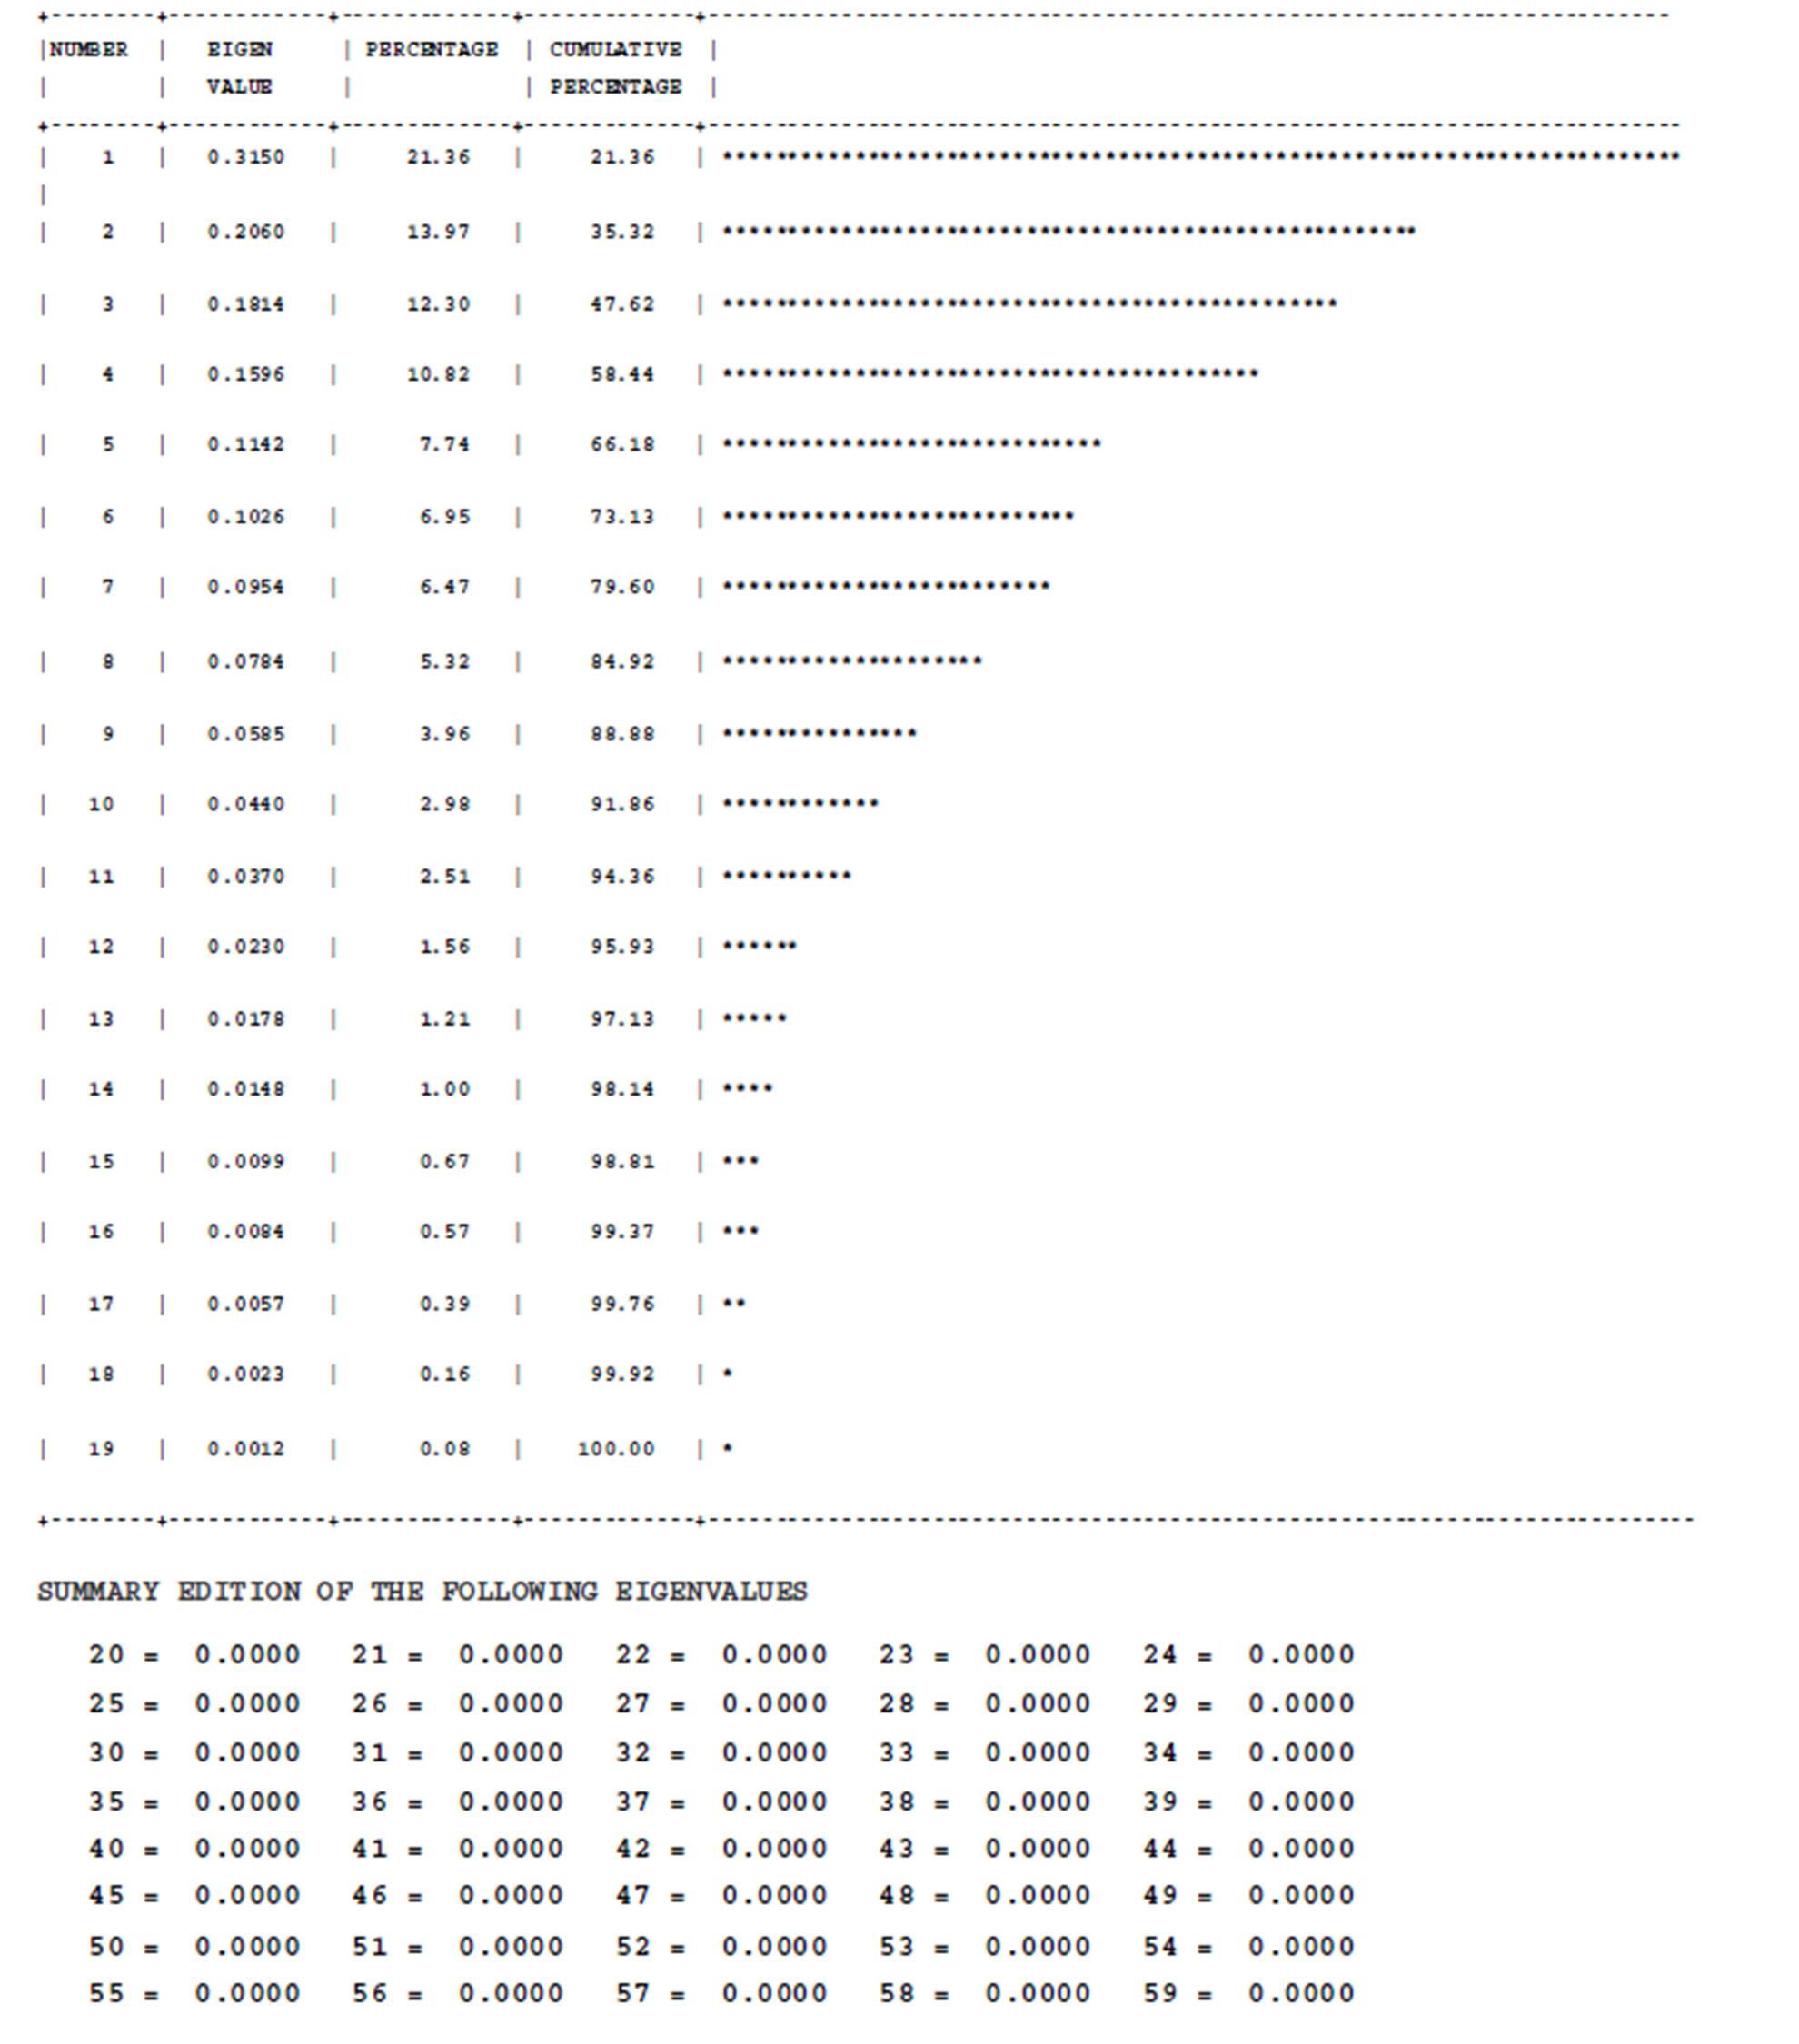
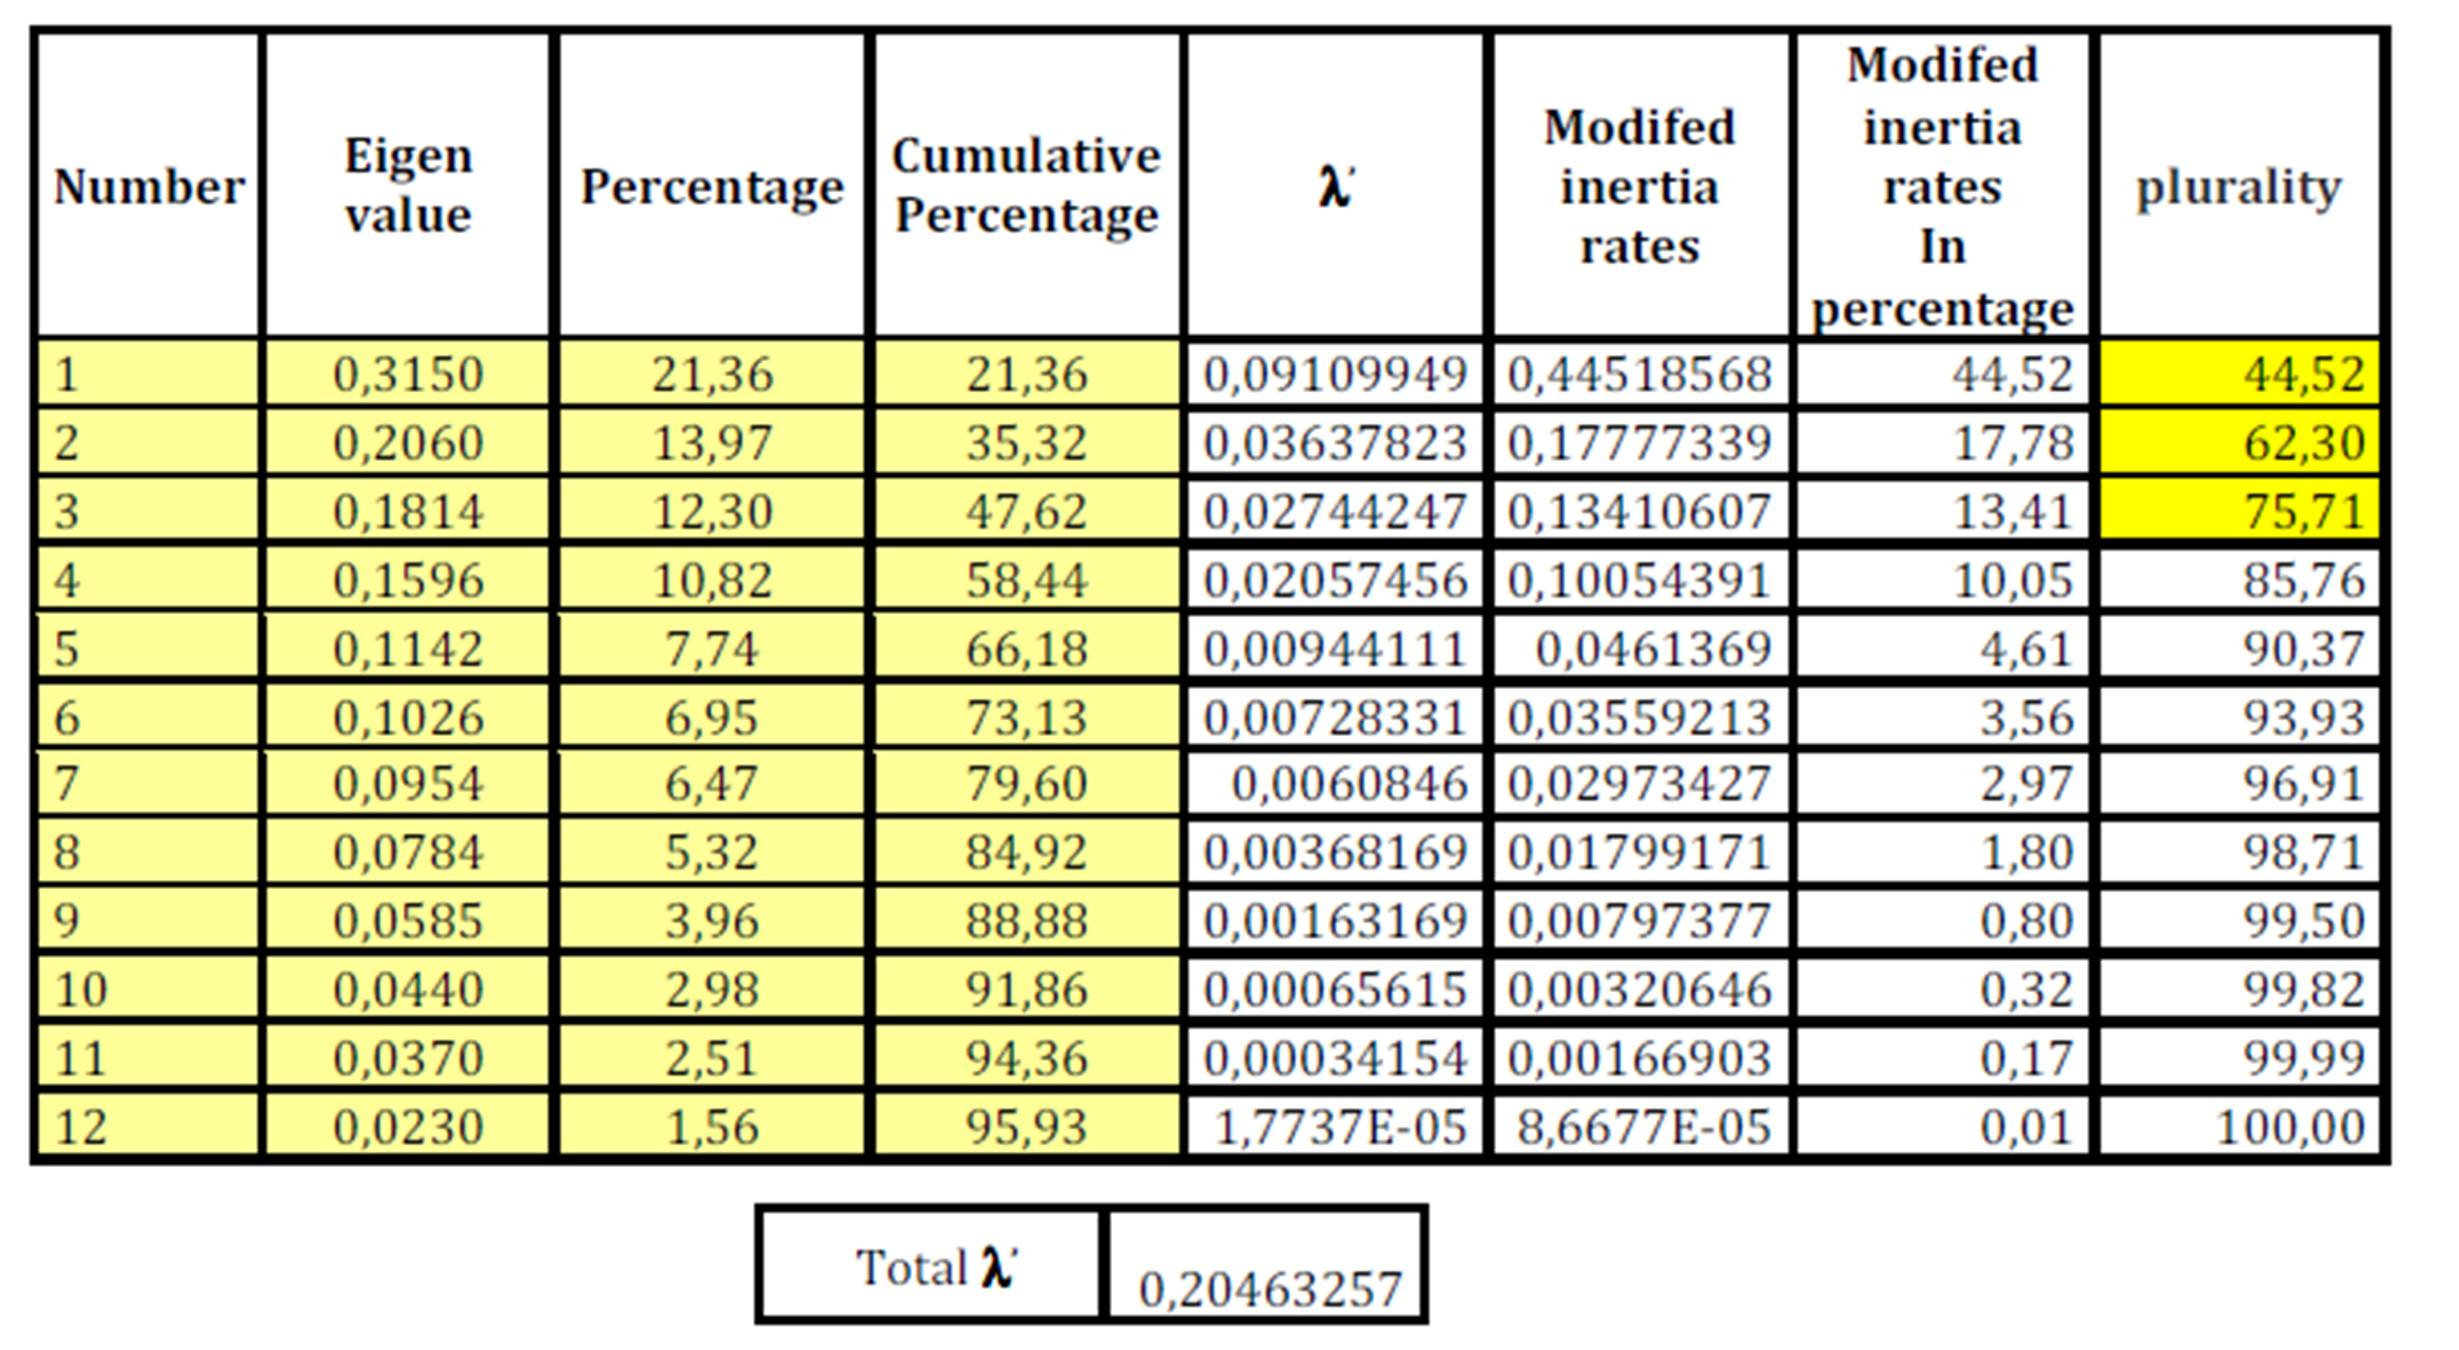
Analysis of eigenvalues and their contributions to the total inertia followed by the study of eigenvalues and modified inertia rate (Benzekri, 1980) bring back three main factors that account for 75% of the total information (See Annex 1 and 2).
Study of Factors (Factorial Axes)
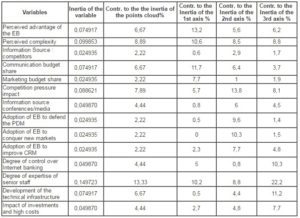
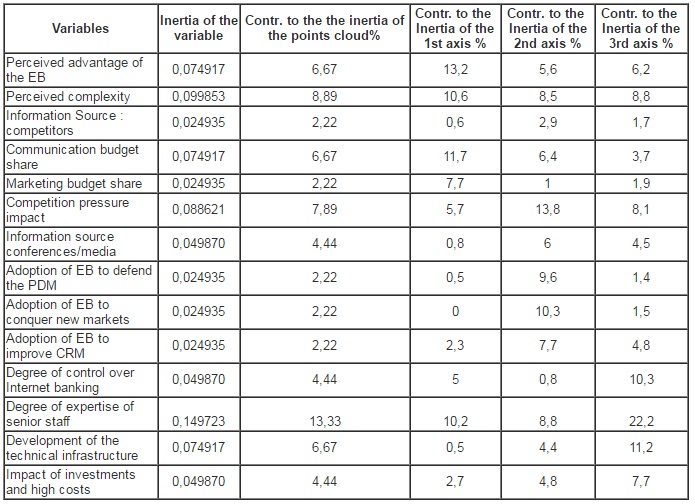
To investigate a given factor, the process should go through two critical stages: The study of contributions and the review of cosine. In the first step, it is to determine the variables that contribute significantly to the composition of the factor in question by judging the importance of these variables in the factor formation and identify those which have contributed the most – in this regard, we should rely on the comparison of their contribution- to the development of factors and their contributions to the inertia of the point cloud and subsequently keep only those with a contribution to the inertia of the axis α, which exceeds the contribution to the inertia of the cloud of points. Thus, the crucial variables selected for each factor should meet this condition (see Appendix 3). Thereafter, the second stage allows further analysis of the composition of each factor in identifying the different modalities for the variables used previously with a strong contribution to the formation of the factor with a (Cos2) high. Indeed, (Cos2) measures the quality of the alignment of variables on the axis that is to say, it shows the importance of the axis in the interpretation of the modality, and hence it can be interpreted by the fact that this variable is substantially aligned on this axis and explains it in a better way. Subsequently, the study of signs of the coordinates of crucial variables will determine whether the variable influences positively or negatively the factor in question.
Study of the first factor
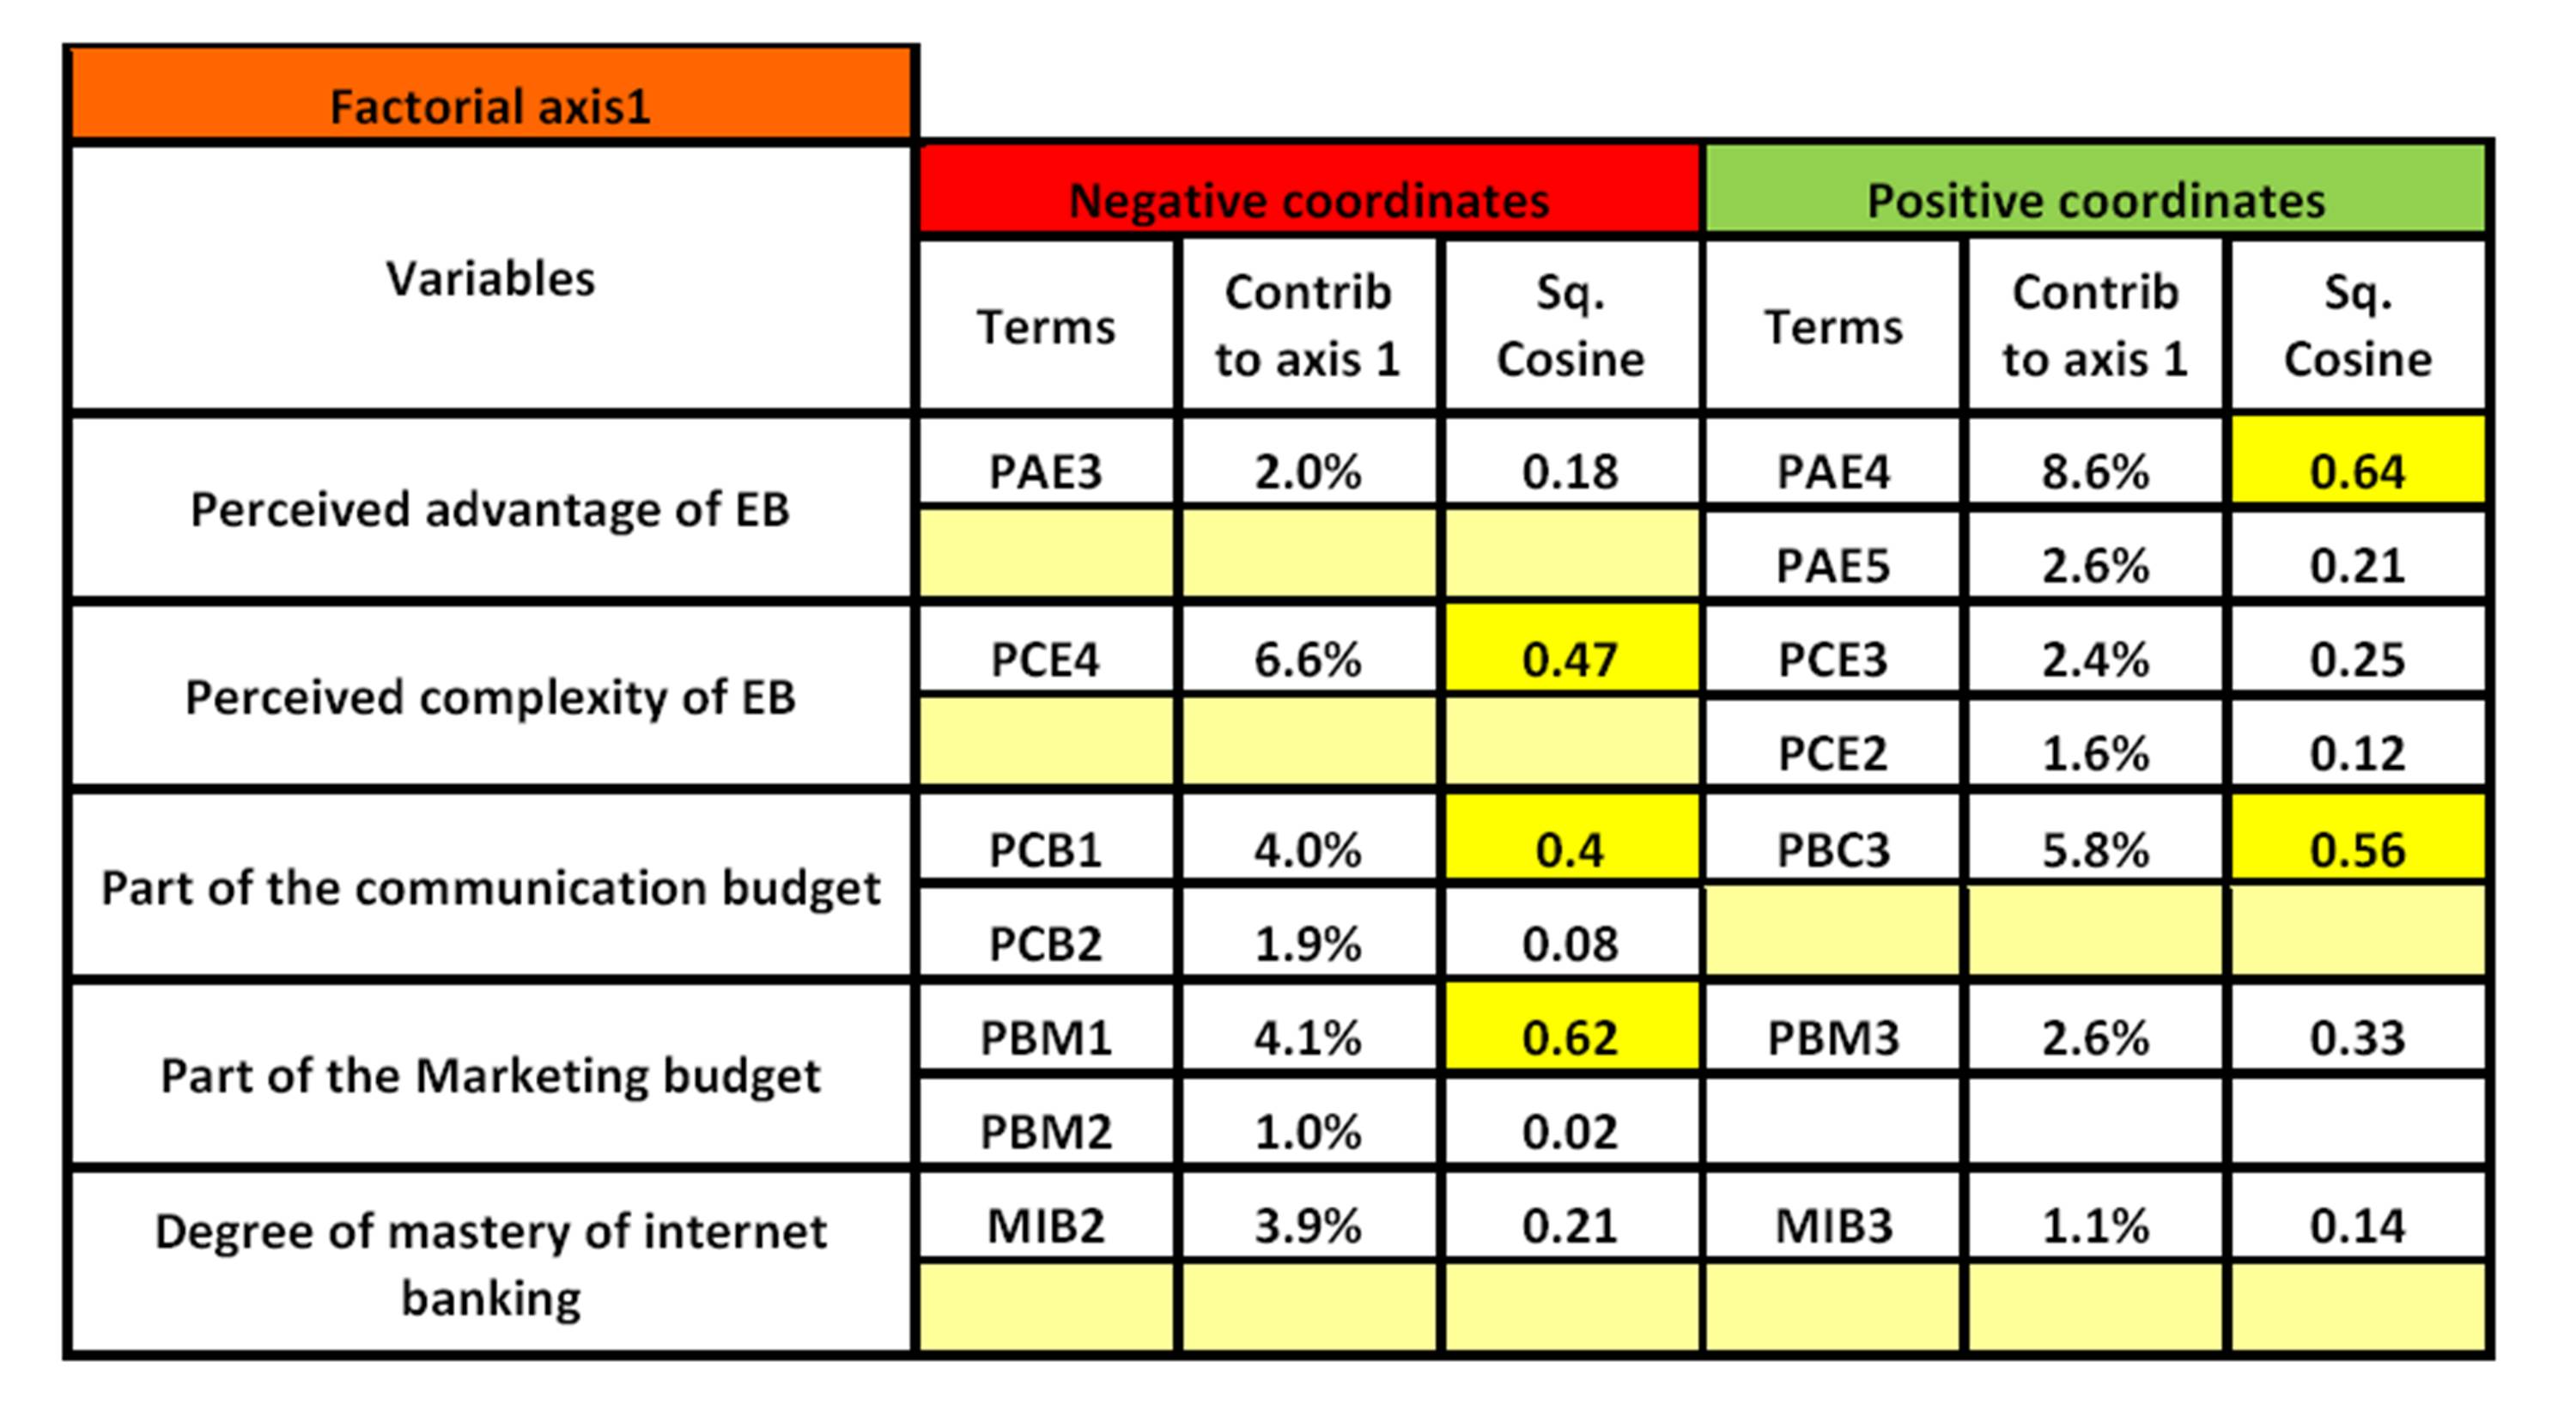
The first factorial axis contributes with 44.52% in the construction of information and is influenced by five variables contributing with 48.2% of its composition. The study of the contribution of variables (Appendix 3), the summary of the composition of the first factor (Annex 4) and the representative graph (Appendix 5), lead to the conclusion that the variables “perceived advantage of the E-banking adoption “,” perceived complexity of the E-banking adoption “,” part of the marketing budget with regard to the annual budget “and” part of the communication budget in relation to marketing budget ” are better aligned variables on the first factorial axis and, therefore, they explain and represent that in the best way. Let us note that, on the one hand, the negative part of the first factor mainly contains the following procedures, respectively with the four variables mentioned “moderately important”, “complex”, “less than 10%” and “less than 3%.” On the other hand, the positive part consists essentially of the following procedures, always with the four variables mentioned: “important”, “moderately complex”, “over 20%” and “more than 10%.”
Henceforth, we can assume that the first factorial axis represents, on the positive side of the axis, the banks which have a customer focus strategy supported by a large share of investment in marketing, especially in communication on the E-banking services. These banks perceive the technological services as a phenomenon with important advantages and, more important, as a phenomenon whose complexity is not an obstacle to its adoption. The negative side of the axis represents the banks which perceive e-banking technology as a phenomenon that does not generate significant benefits and remains a complex technology to implement. Thereafter, these banks allocate a small proportion of budget to marketing and to communication on E-banking services and do not rely on a customer-oriented-strategy.
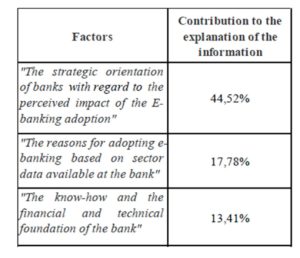
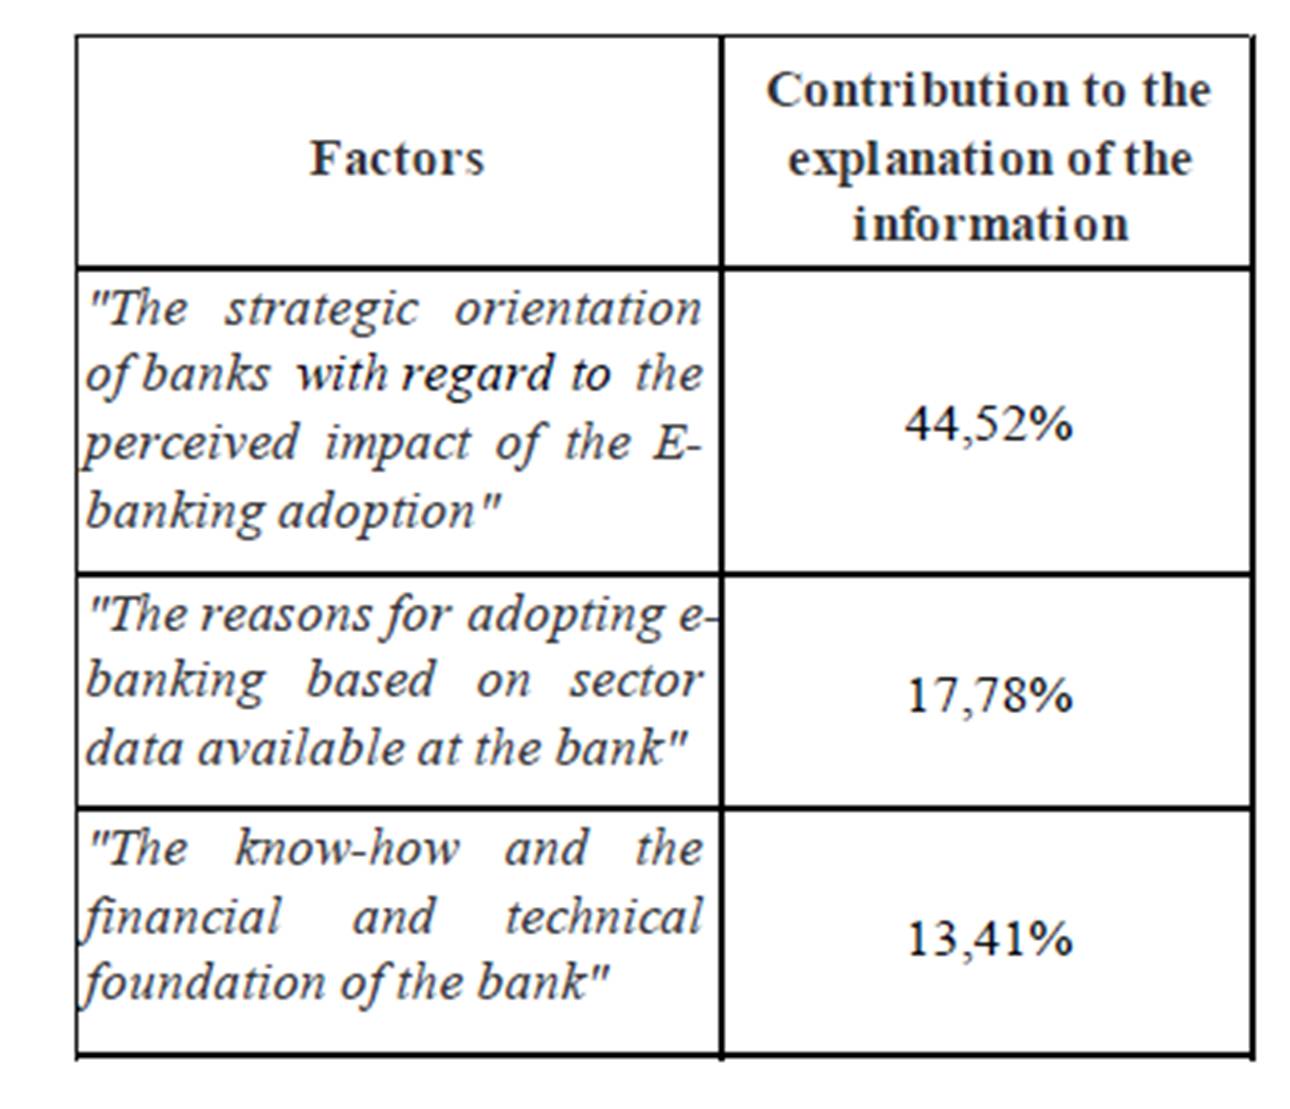
Therefore, we consider that the first factor is mainly “the strategic direction of the bank with regard to perceived impact of the adoption of E-banking.”
Study of the second factor
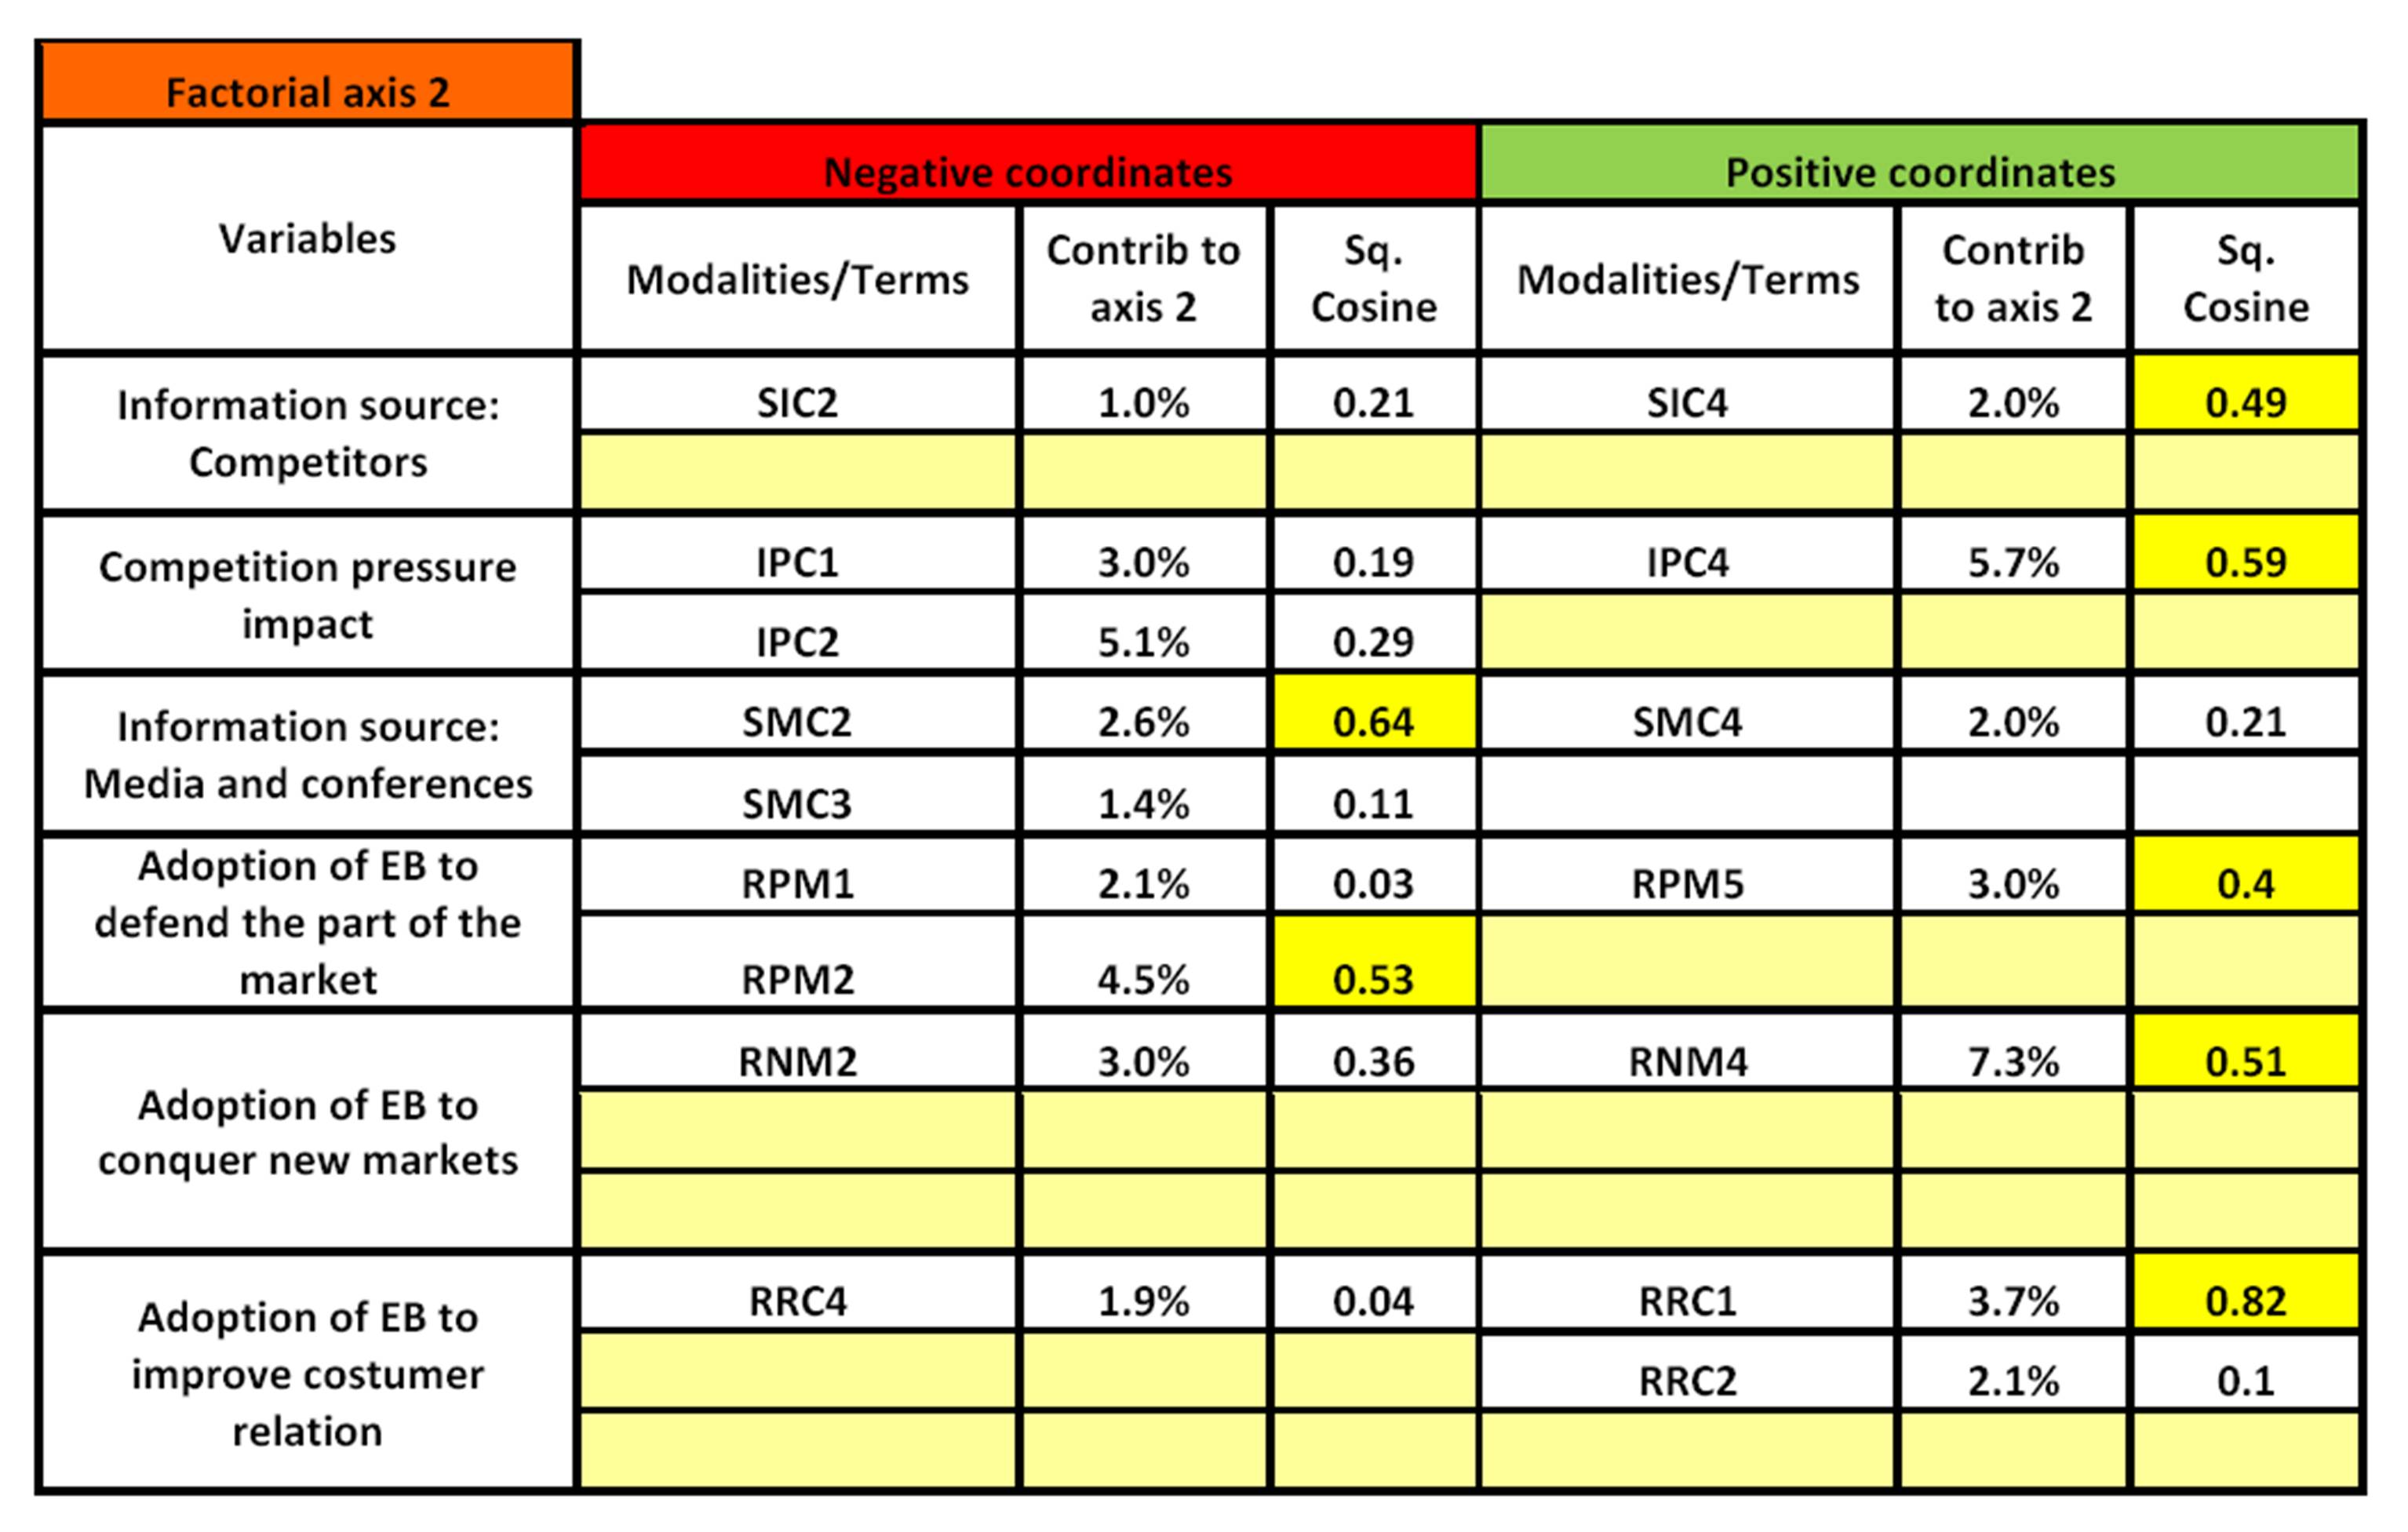
The second factor represents 17.78% of the total inertia of the cloud; this axis is influenced by six variables contributing 50.3% to its composition. Following the same analysis approach based on data in Annex 3 and 6 and then 5, we find that the following terms and their corresponding variables that most influence this factor: The modality “SIC4″ (frequently used) which is on the variable ” information source: the competitors,” modality “IPC4” (high impact) on the variable “impact of competitive pressure,” modality “SMC2″ (rarely used) on the variable ” information source : conference and media “modality” RPM2 “(second position) on the variable ‘adoption of e-banking to defend market share,” modality “RNM4” (fourth position) on the variable “adoption of e-banking to conquer new markets, “and finally the modality” RRC1 “(first position), which is related to the variable ‘adoption of e-banking to improve customer relations.”
Thus, the second factorial axis represents, on the negative side, the banks that are not sufficiently informed and interested in e-banking, and not deeply affected by competitive pressure in their decision-making and have reasons for the adoption of E-banking far from being related to the quality and the relationship with the customer, but rather quantitative reasons, including the conquest of new markets and the defense of the current PDM.
On the other side of the second factorial axis, the positive side is that banks are well informed about the E-banking; they have a strong competitive intelligence and adopt technological innovations for qualitative and strategic considerations such as improving customer relationship and proximity. Thus, we find that this axis mainly represents “the reasons for adopting e-banking sector based on data available at the bank.”
Study of the third factor
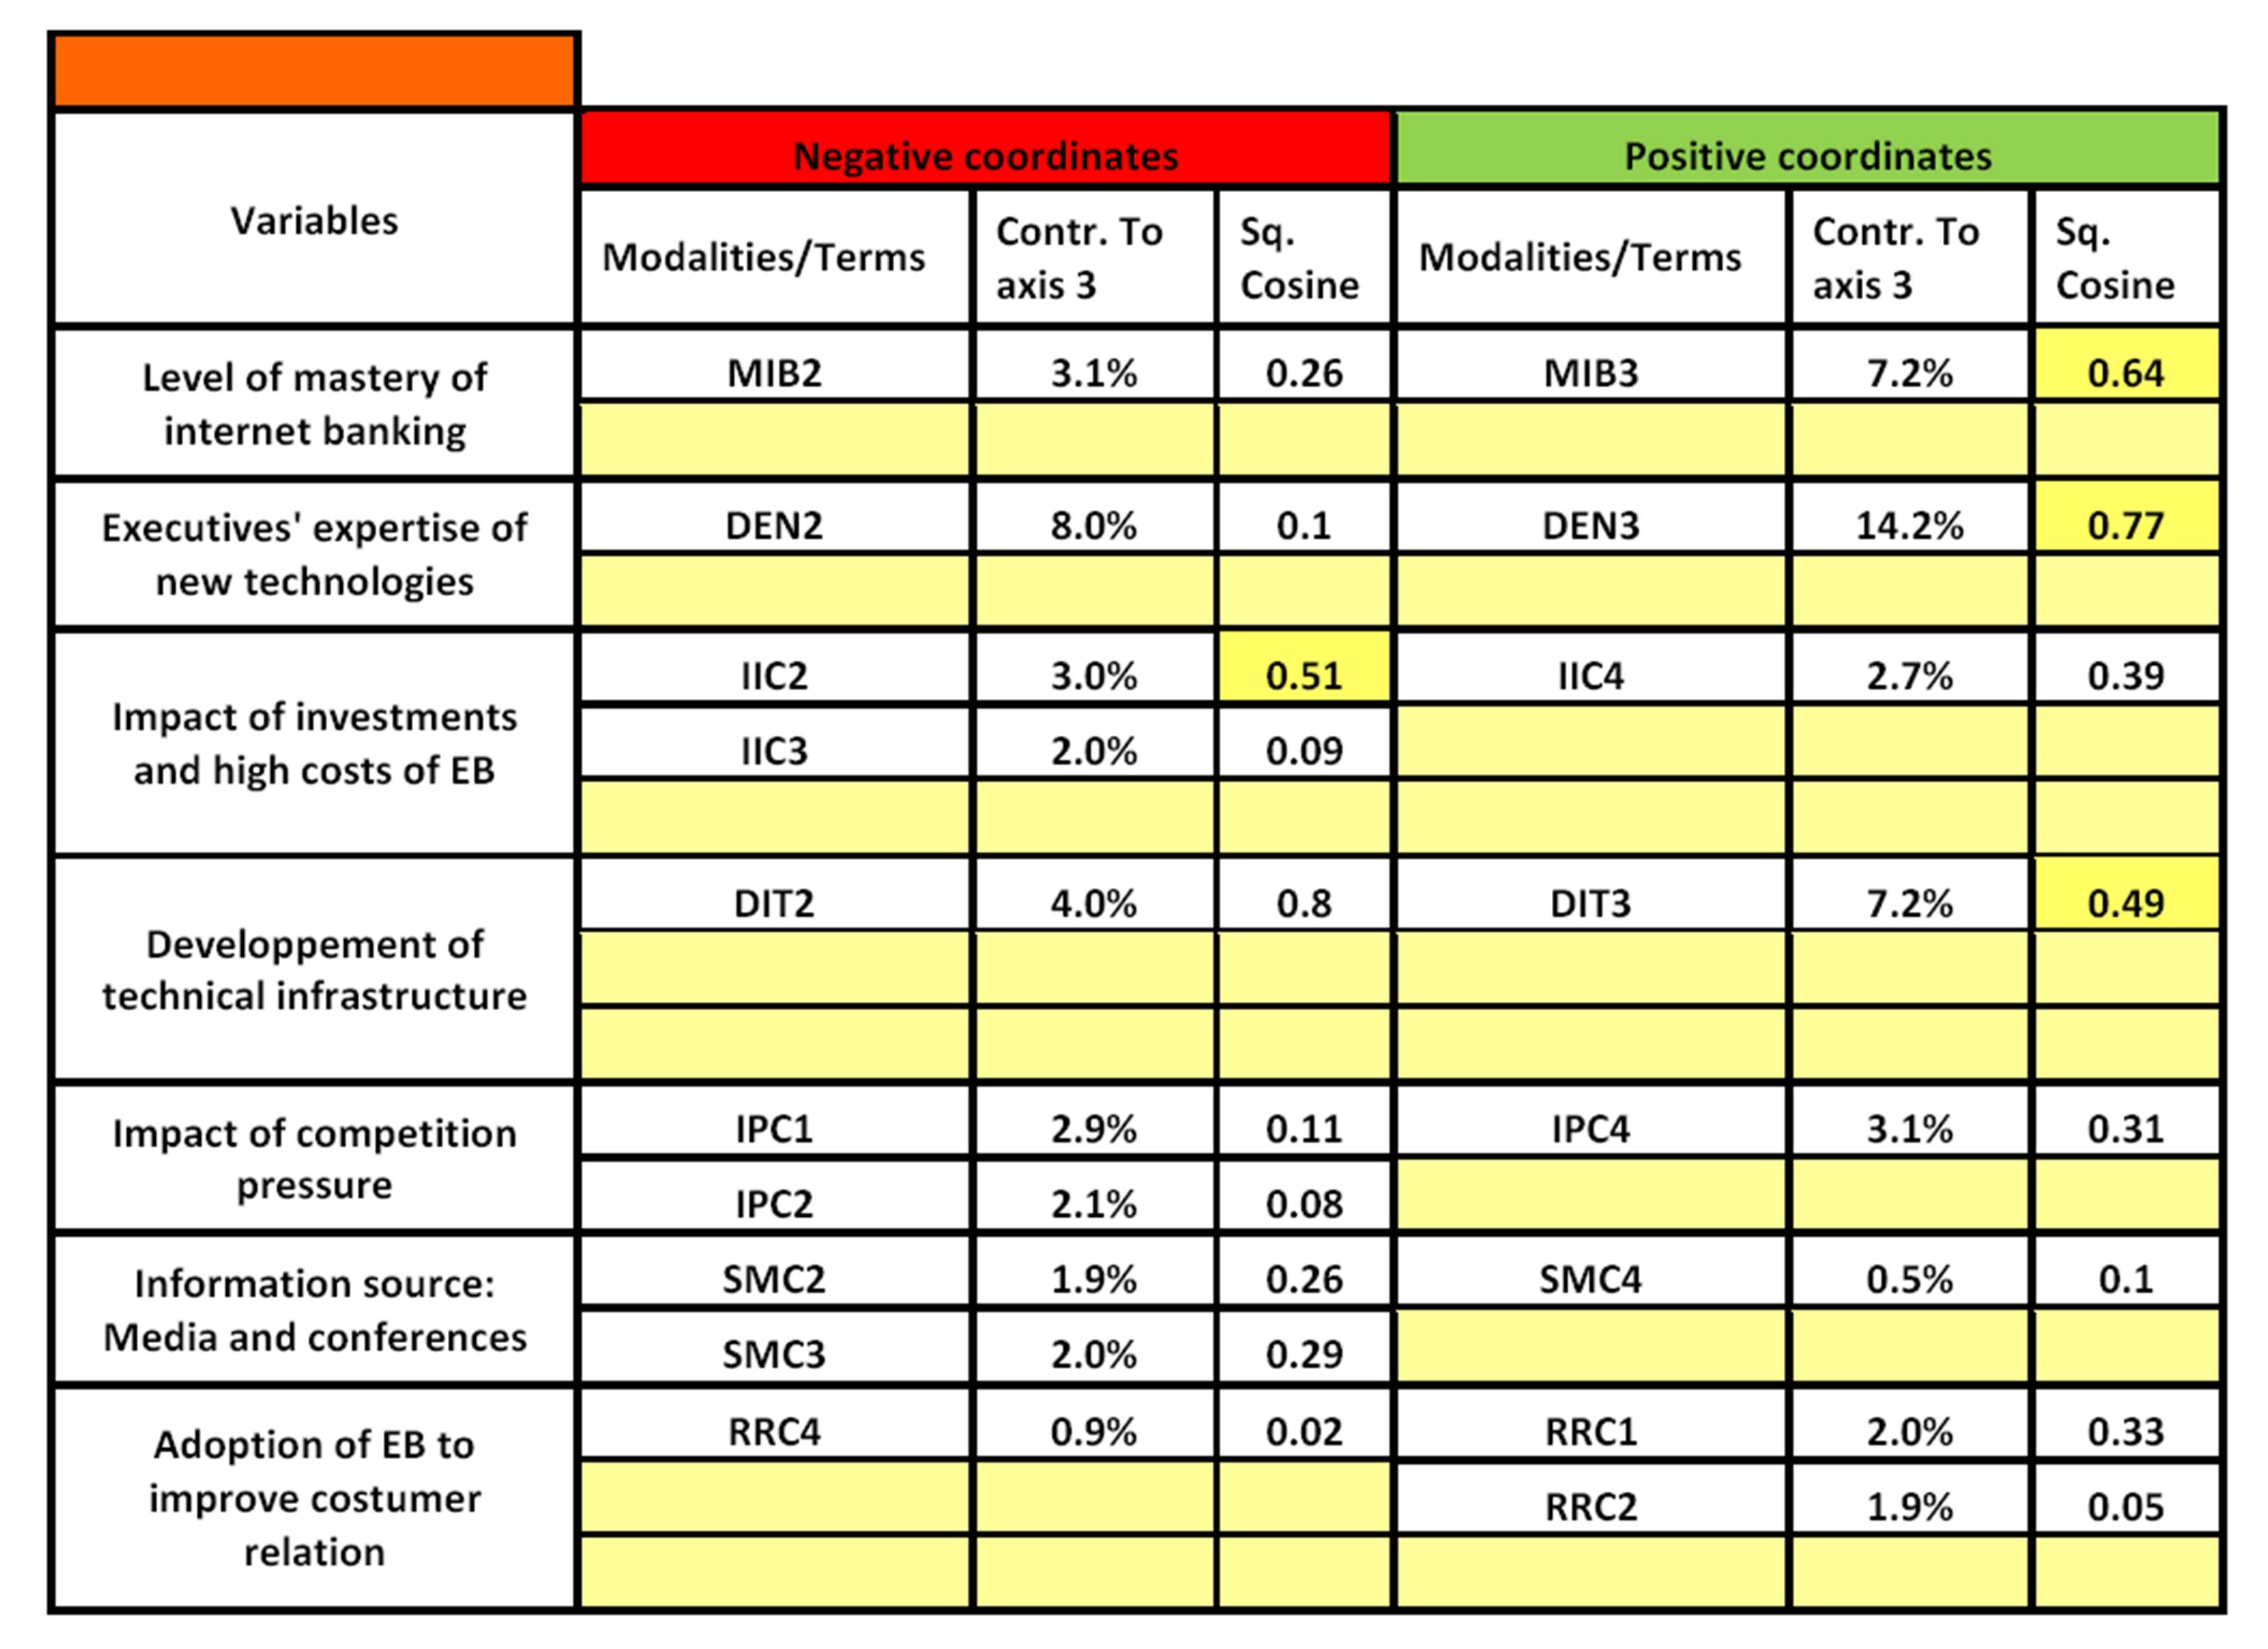
The third factor retained represents13.41% of the total inertia; it is influenced by four variables contributing 51.4% to its composition. It should be noted that we did not take into consideration certain variables because they have a higher cosine on another axis, so it would be more appropriate to consider their representativity of the axis on which they have most aligned modalities.
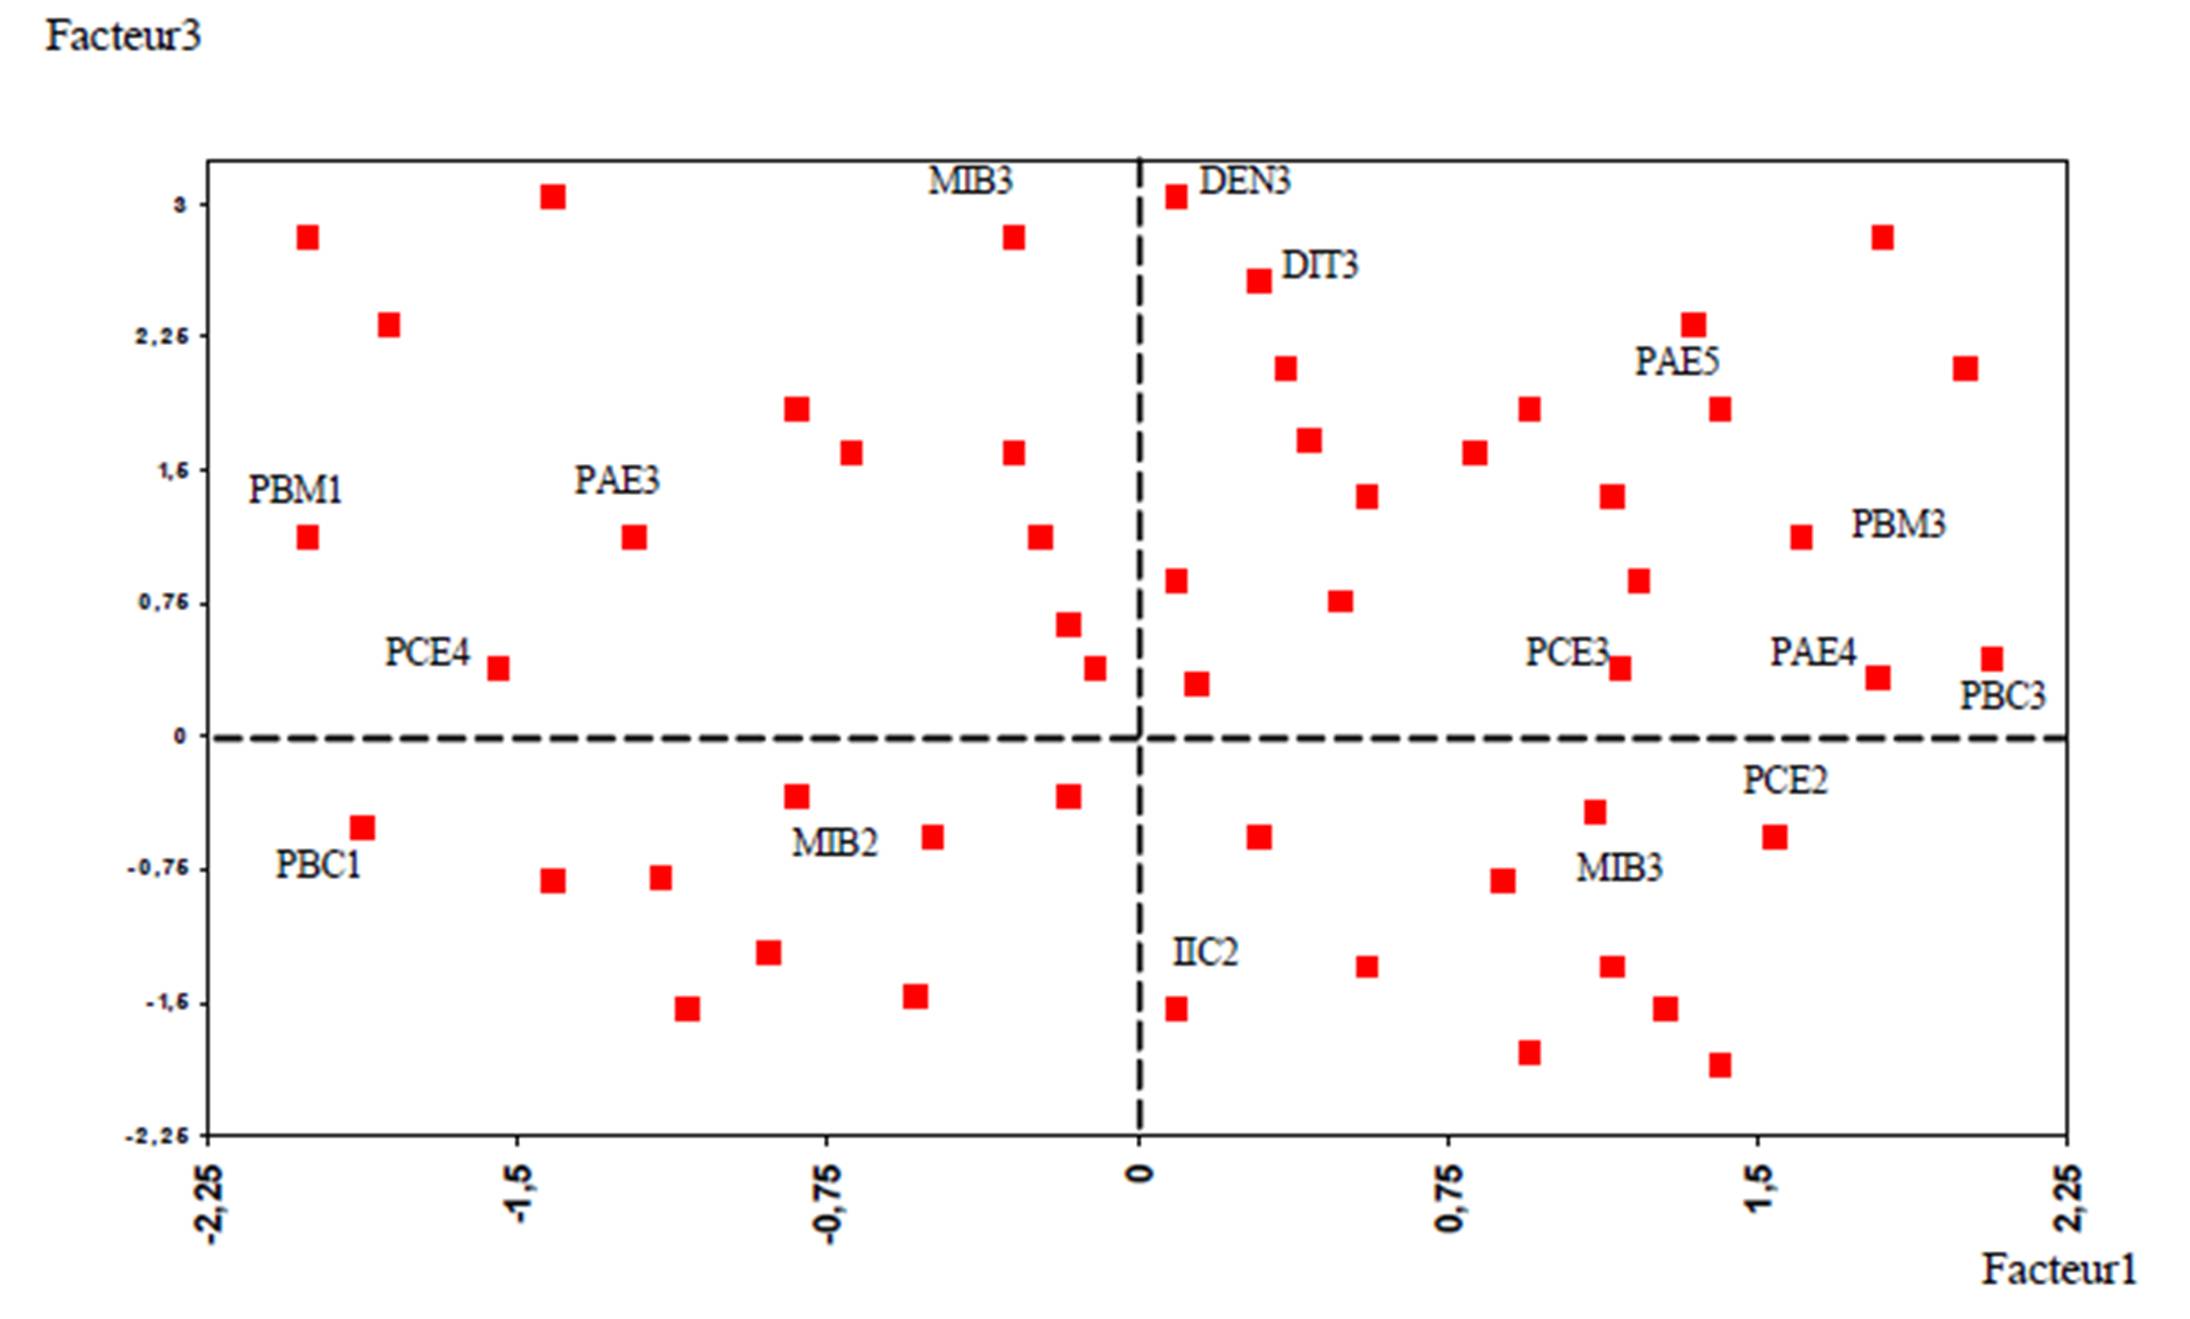
Based on data provided in Appendix 3, 7 and 8, we note how “MIB3” (fluent) on the variable “degree of control of Internet banking within the bank,” the modality “DEN3” (high expertise) on the variable “degree of expertise in ICT in the bank,” modality “IIC2” (minimal) on the variable “impact of investments and high costs on the decision to adopt e-banking ‘and finally the modality “DIT3” (highly developed) on the variable “development of technical infrastructure.”
We have found that the positive side of the third factor represents the banks that know best innovations of E-banking through an adapted and developed technical infrastructure, in addition to dedicated employees. These banks provide the means to implement these innovations because they are the least affected or deterred by the high investments that this phenomenon generates. This informs us about the ability of financial resources and the quality of human resources of the bank.
On the other hand, the negative side of this factor includes the banks that have a low level of mastery of the new technology of e-banking, with a modest technical infrastructure and are influenced by the high costs of this technology which increases their resistance to its adoption. We conclude that the third factorial axis represents “the know-how and the financial and technical base of the bank.”
Projection of individuals and representation of factorial designs
The objective of this stage is to analyze the projection of banks on different factorial designs. It is based on the observation that the proximity of individuals (banks) is interpreted as a profile similarity. We have already noted the contribution of each of the factor axes in the total inertia. Nevertheless, it would be inappropriate to consider the three combinations of the factorial axes:
– The first factorial design/plan (1-2): its contribution to the total inertia is the sum of the contributions of the two factorial axes 1 and 2, which is 62.3%.
– The second factorial design (1-3), as well, contributes with 57.93% to the total inertia.
– The third factorial design (2-3) contributes with 31.19% to the total inertia.
We reject the third factorial plan (2-3) because of the weakness of its contribution in the total composition of information. However, the study of the other two factorial plans secures almost two-thirds of the information.
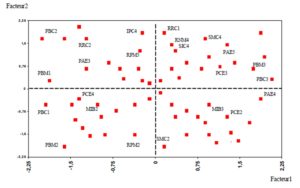
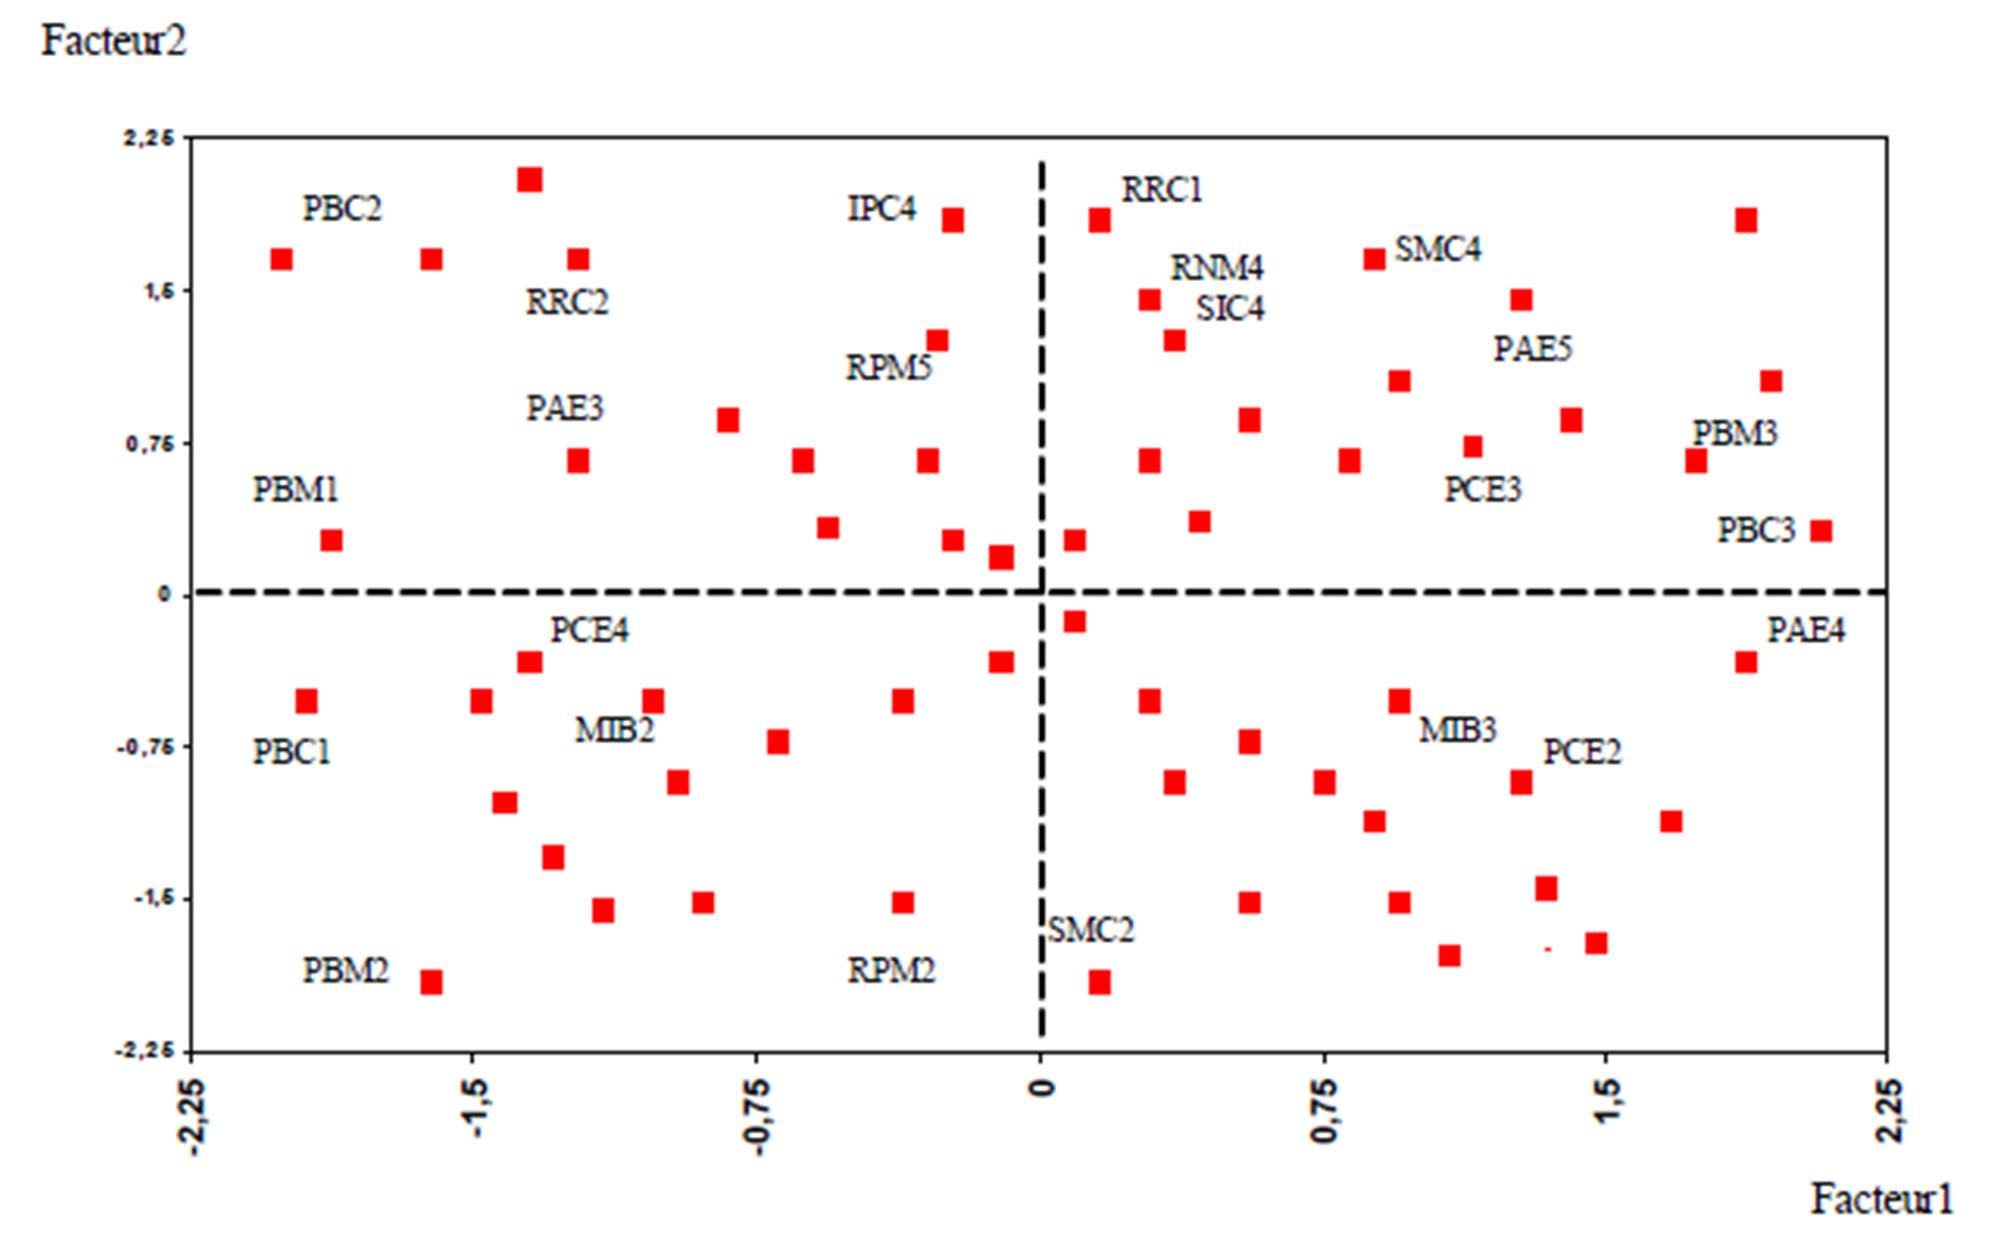
Study of factorial design (1-2) (See Appendix 9)
We rely, at this level, on a notion of similarity as two individuals are so much closer that they have many terms in common. Practically, this means that we initially identify analogies and similarities between banks on the basis of their organizational, structural and strategic characteristics, which will, eventually, enable us to distinguish groups of banks according to their behavior towards e-banking.
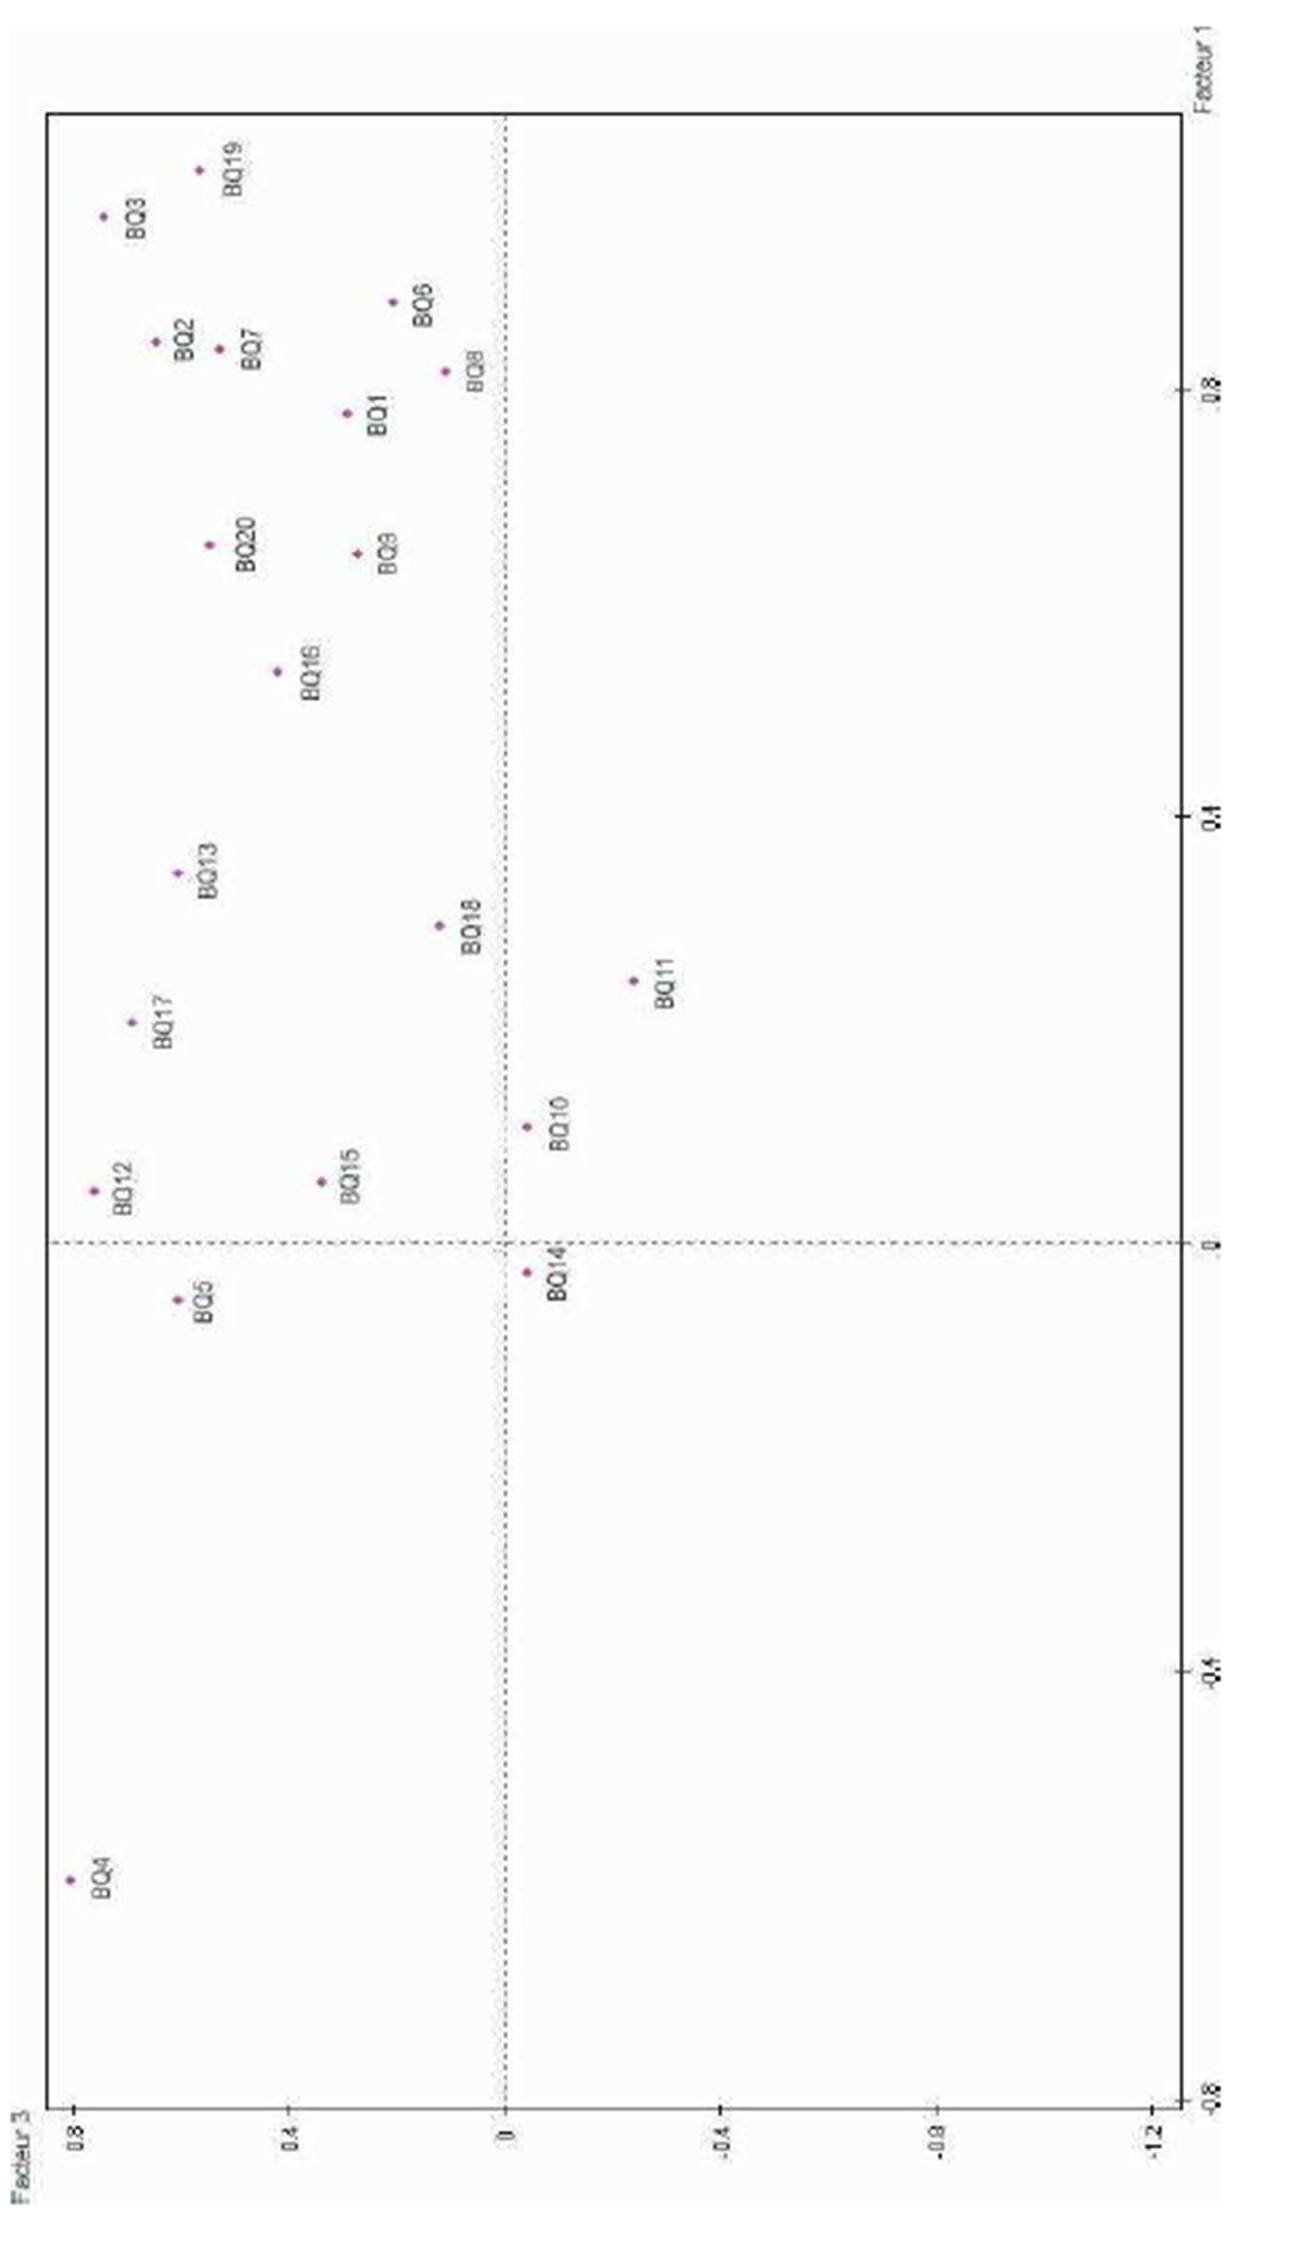
The factorial (1-2) shows a concentration of banks in the intersection of the two positive dials of the two factors 1 and 2. According to the composition of the two factors these banks combine, on the one hand, a more aggressive strategy of customer focus, fueled by large marketing budgets based on a positive perception of the impact of e-banking, and on the other hand, a strategic and competitive approach that promotes adoption of E-banking, motivated essentially by qualitative and relational objectives.
However, we notice a gap between a group that is closer to customer orientation and a positively perceived impact in the adoption of e-banking; and another group that is rather closer to an efficient business intelligence system and in an attempt to improve customer relations by adopting e-banking. From the outset, the first group consists of banks BQ16, BQ9, BQ8, BQ1, BQ20, BQ6, BQ19, BQ3, BQ7 and finally BQ2; whereas the second group consists of four banks: BQ18, BQ11, BQ14, BQ10.
Regarding the lower side of our factorial design, we notice the presence of a third group where there is closeness between five banks (BQ15, BQ13, BQ12, BQ17, BQ5) that have no fixed strategic orientation and remain fairly neutral with regard to their perception of the impact of e-banking. This reveals a certain lack of interest and low involvement of this group of banks in the field of adopting e-banking.
A rather “rebel” position on the first factorial design has drawn our attention, that of the bank BQ4 which is better positioned in terms of business intelligence and desire to improve customer relations but is closer to a bank that is not enough invested in marketing and carries a somewhat negative perception of e-banking. We believe, for the moment, that it is the only individual bank to a fourth group. At this level, the point is to know whether the above findings are justified after consideration of the second factorial design (1-3).
Study of factorial design (1-3) (See Appendix 10)
Banks forming the first group defined on the first factorial plan emerge even more on this one by taking a positive attitude marked by a strong closeness to the positive part of the third factor that reflects the level of know-how, financial and technical background of the bank. Regarding the second and third group previously identified, we note a proximity on the factorial (1-3) which is less visible on the factorial design (1-2). However, the separation between these two groups is easily identifiable thanks to the distinguished position of the third group in connection with the second level of the organizational profile. The unique position of the fourth group containing bank BQ4 is confirmed on this factorial plan where it monopolizes the best organizational position in terms of skills, financial resources and technical infrastructure.
The projection on this factorial plan induces us to emphasize that the banks which are best positioned in terms of investment in e-banking and the positive perception towards the latter are not necessarily those that have the best ranking in the organizational profile. Similarly, if we refer to the factorial plan (1-2), we assume that banks which invest more in e-banking are not necessarily those that rely most on a business intelligence system and, therefore, are not the most informed about the technologies of e-banking.
Let us note that the groups defined in our study of the first factorial plan are still confirmed. It should be also noted that these results are limited and the groups that we have identified need to be confirmed by the results of the method of “ascending hierarchical classification.” At this level, this method turns out to be of particular importance and relevance so as to decide on the categorization of banks.
Conclusion, Managerial Implications, Limitations and Future Areas of Research
The bank branch is no longer a compulsory point of passage for the client at a time when the media and technological innovations combine to meet his growing demands. Therefore, banks deploy strategies of multi-channel distribution where technological innovation plays an essential role and e-banking raises a particular interest. This topic has already been addressed using econometric methods aiming to validate assumptions of correlations between explanatory variables of the phenomenon of adoption of innovations. By cons, our interest in this subject aspires to a study using a novel method treating the problem from a different angle: The MCA which is an exhaustive method comprising the best possible synthesis of information contained in a large data table. However, this method generates an inevitable loss of information in order to gain readability.
This article has helped highlight the most critical variables in the adoption behavior of e-banking synthetic form of three different factors. To do this, closeness relationships and similarities between the variables selected from the literature were identified in order to set up these explanatory factors. This has allowed us to position the banks according to their profiles (the largest number of variables in common terms) over three factorial designs. The table below summarizes these factors and their contribution to the explanation of the total information.
The results of our research are important for banks, downstream, and for suppliers and subcontractors of technological innovations and banking services, upstream.
For banks operating on the Tunisian market our results are a competitive benchmarking tool that allows the bank to consider its position in relation to its competitors in terms of electronic distribution strategy and technology integration in the banking distribution network. In addition, our results are useful for banks that are not yet part of the Tunisian market but who are willing to integrate it. This study presents a comprehensive overview of the banking sector according to the profile of the banks that more or less foster the innovations of E-banking. The latter can be considered as a competitive and strategic advantage for the integration of Tunisian banking market. For suppliers of technological innovations in banking services, our results give an idea on the possibilities of marketing media technology based on the main motivations for banks to incorporate in their structures.
The study of the adoption of innovations in the banking sector is a huge research topic which could be exploited in different perspectives. Thus, it would be interesting to conduct a study of the determinants of the adoption of each electronic distribution channel separately and make a comparative study of the determinants of electronic distribution channels for banking services with a thorough the analysis of commonalities and disparities. In addition, the recovery of the same study but in a longitudinal way would turn out to be interesting by comparing results so as to derive a possible tendency and especially to learn the effect of time and change of situation in the banking market which would move out of its transitional period. Finally, we recommend the use of an additional method to MCA allowing a thorough typological and confirmatory study of each group of banks identified in factorial designs: it is the method of ascending hierarchical classification with the aim of seeking, at each step, the two closest clusters to merge until obtaining a single class. Ascending hierarchical classification is, therefore, meant to provide a set of more or less fine partitions obtained by successive mergers of clusters. The latter will enable us to confirm or invalidate groups of individuals previously identified on factorial plans of the MCA method and lead, where appropriate, to a rigorous cluster analysis.
(adsbygoogle = window.adsbygoogle || []).push({});
References
1. Bakos,J.Y. 1991. « A strategic Analysis of electronic Marketplace». MIS Quarterly, vol. 15, no.3, p.295-310.
Publisher – Google Scholar
2. Barnett, H.G. 1953, “Innovation: The Basis of Cultural Change”, New York: McGraw-Hill.
Google Scholar
3. Cooper,R.B. et Zund, R.W. 1990. « Information Technology Implementation Research : A Technological Diffusion Approach». Management Science, vol 36. 2, p.123-139.
Google Scholar
4. Crance, Philippe. 2001. « Le marketing de l’innovation: des outils de valoriser la recherche et les technologies nouvelles». Revue Française Du Marketing, no. 182.
5. Cronin, M. J. 1996. « The Internet as a Competitive Business Resource ». Cronin, M. J., The Internet Strategy Handbook. Harvard Business School Press.
6. Daft, R. L. 2003. Management. Edition: Mason, OH, South-Western.
7. Der Velde, H.V. 1996. « Etablir un pont entre la banque et la technologie». Banque, n°571, juin, p14-16.
8. Dickerson , M.D. et Gentry, J.W. 1983. « Characteristics of Adopters and Non-adopters of Home Computers». Journal of Consumer Research, vol10, p.225-235.
Publisher – Google Scholar
9. Dietsch, Michel 1997. « L’efficience: Un nouvel outil de mesure des performances », Banque, n°586, p52-55.
10. Diniz, E. 1998. ” Web banking in USA “, Journal of Internet Banking and Commerce, n°2, Vol. 3, p36-39
Google Scholar
11. Dixon, Mary et Nixon, Brian. 2000. “E-banking: Managing your money and transactions online”. SAMS publishing, p. 224.
12. Dodson, J. 2000 «Find out why your customers leave». Internet Week Online. 14 Février 2000
13. Dodson, J. 2000 «Some measures need that soft touch». Internet Week Online, 29 Mai 2000.
14. Escoffier B., 1973, “Recherche d’un scalogramme par l’analyse factorielle”. In : Benzekri J. P., L’analyse des données. 2. L’analyse des correspondances. Dunod. Paris p. 323-325.
15. Escoffier B., Benali H., Backar K., 1990. “Comment introduire de la contigüité en analyse des correspondances ? Application en segmentation d’image”. Statistiques et Analyse des données, vol. 16, n°3 p61-92.
16. Escoffier B., Pagès J, 1998. “Analyses factorielles simples et multiples : objectifs, méthodes et interprétation”. DUNOD, Paris, p284.
17. Frini, Anissa et limayem, Moez. 2001. « Facteurs influençant les intentions d’achat à partir le Web : Étude comparative des acheteurs et des non acheteurs». Université de Laval.
18. Gatignon, Hubert, Jehoshua Eliahberg et Thomas S., Robertson. 1989. «Modelling Multinational Diffusion Patterns : An efficient Methodology ». Marketing Science, vol 8, p.231- 247.
19. Gatignon, H., Robertson Thomas S. 1985. “A proposal Inventory for new Diffusion Research”, Jounal of Consumer Research, no 1(Mars), p 249-267.
20. Gatignon, H., Robertson Thomas S. 1989. « Technology Diffusion : An Empirical Test of Competitive Effects». Journal of Marketing, vol.53 (1), p.35-49.
Publisher – Google Scholar
21. Gatignon, H., Robertson Thomas S. 1989. « Determinants of Diffusion Patterns : A cross- Country Analysis». Marketing Science, vol.8, p.231-247.
22. Gatignon, H., Xuereb, J.M. 1997. « Strategic orientation of the Firm and new product performance». Jounal of Consumer Research, no 34 (février), p. 77-90.
Google Scholar
23. Gattiker, U.E, Perlusz,S. et Bohmann, K. 2000. «Using the Internet for B2B activities: a review and future dirctions for research», Internet research, Electronic Networking Applications and Policy, vol 10, no 2, p. 126-140.
Publisher – Google Scholar
24. Gauvin, Stéphane, Rajiv, Sinha. 1991. « Innovativeness In industrial Organisations : A two- Stage Model of Adoption». Document de travail, Univerité Laval.
25. Gillespie, David F., Dennis S. Mileti. 1977. “Technology and The Study of Organizations: An Overview and Appraisal.” Academy of Management Review (Janvier), p.7-16.
Publisher – Google Scholar
26. Hirchman, Elizabeth C. 1980. « Innovativeness, Novelty Seeking And consumer Creativity». Journal of Consumer Research, vol.7, p.283-295.
Publisher – Google Scholar
27. Hultink, E. J., Langerak, F. 2002. “Launch decisions and competitive reactions: an exploratory market signaling study”. The Journal of Product Innovation Management, n°19, p.199-212.
Publisher – Google Scholar
28. Hultink, E. J., Hart, S., Robben, H. S.J., Griffin, A. 2000. “Launch decisions and new product success: an empirical comparison of consumer and industrial products”. The Journal of Product Innovation Management, n°17, p.5-23.
Publisher – Google Scholar
29. Jacob, R. et Raymond, L. 1997. « Compétitivité, savoirs stratégiques et innovation : Les leviers de l’apprentissage collectif en contexte de réseau». Gestion, vol. 2, no.3, p.93-100.
30. Kirsner, D. et Balbi D .(1997), “ Les besoins des banques”, Banque, no 586, p.38-39.
31. Kotler, Di Maulo, McDougall, Amstrong, « Le Marketing de la théorie à la pratique », Edition : Gaëtan Morin 1991, p.13.
32. Lamouline, Olivier. 1998. «L’innovation technologique dans les établissements de crédit et les sociétés d’assurance». SESSI, no.95. www.industrie.gouv.fr
33. Langley ,A. 1989.« In search for rationality: The purposes behind the use of formal analysis in organisations».Administrative Science Quarterly, vol.34, no.4, p.598-631.
Publisher – Google Scholar
34. Langley, Ann et Truax, Jean. 1994. « A Process Study of new Technology Adopion In Smaller Manufacturing firms». Montréal, Presses de l’université de Québec à Montréal.
Google Scholar
35. Levin RC., Klevorick RR., Nelson R., Winter S., « Appropriating the returns from industrial research and development », Brooking Papers on economic activity, 1987, p.783-821.
Google Scholar
36. Lewis, D. 2000. «Pressure mounts to gauge e-biz ROI». Internet Week Online, 30 octobre 2000.
37. Lewis, D.20000. « Some retailers de-emphasize web payback». Internet Week Online, 23 octobre 2000.
38. Limayem, Moez, Poisson, Marie-Andrée et Dhrif, Hichem. 1998. « Impact de l’utilisation du réseau Internet sur la performance organisationnelle». Document de travail. FSA, Université Laval.
39. Limayem, M., Haloui N. 1997. « Impact de l’investissement en Technologies en l’Information sur la performance des entreprises: une nouvelle vision ». Document de travail. FSA, Université Laval.
40. Limayem, M., Chabchoub, N. 1997. « Les facteurs motivateurs de l’utilisation du réseau Internet ».Comptes rendus, 3 eme colloque de l’Association Internationale de Management, mai 1997.
41. Mansfield, E. 1986. Patents and innovation: an empirical study. Management Science, Vol. 32, No. 2. (Février), p.173-181.
Publisher – Google Scholar
42. Morgan, R.M. et Hunt, S.D. 1994. « The commitment- trust theory of relationship marketing », Journal of Marketing, vol.58. p.20-38.
Publisher – Google Scholar
43. Nicoletti, Giuseppe. 2003. « Concurrence, Innovation et Croissance». OCDE.
44. Nicoletti, Giuseppe et Scarpetta, Stefano,. « Regulation, productivity and growth». OCDE. Documents de travail du Département des affaires économiques, n°347, et de OCDE Economic Outlook 72, chapitre VI.
45. Nicoletti, Giuseppe « Product and labour markets interactions in OCDE countries» Documents de travail du Département des affaires économiques, n°312, et de OCDE Economic Outlook 71, chapitre VII.
Google Scholar
46. OCDE. Manuel d’Oslo. 1997. La mesure des activités scientifiques et technologiques. OCDE.
47. OCDE 2002. Dynamiser les systèmes nationaux d’innovation. OCDE.
48. Pagès J., 1996. « Eléments de comparaison entre l’Analyse Factorielle Multiple et la méthode STATIS ». Revue de Statistique Appliquée. Vol.4. p.81-95.
Google Scholar
49. Reimund, Donn A., Martin, J. Rod and Moore, Charles V. 1981, “Structural Change in Agriculture: The Experience for Broilers, Fed Cattle, and Processing Vegetables” Washington, DC, US Department of Agriculture.
Google Scholar
50. Riddle, D.I. 2000. « Offshore back office operations: Supplying support services to global markets”.Geneva: International Trade Centre, UNCTAD/WTO.
51. Riddle, D.I. 2000. « Services to global markets: A profile of Canadian women who export services”. Foundation of Canadian Women Entrepreneurs.
52. Robertson, T.S. 1967. “The Process of Innovation and the Diffusion of Innovation” Journal of Marketing, January, p. 14-19.
Publisher – Google Scholar
53. Roehrich, Gilles. 2001. « Causes de l’achat d’un nouveau produit: Variables individuelles ou caractéristiques perçues», Revue française du Marketing, no 182. p.48-66.
Google Scholar
54. Roehrich, Gilles.1994. «Innovativité hédoniste et sociale:proposition d’une échelle de mesure». Recherche et Applications en Marketing, vol 9, no 2, p.19-41.
Publisher – Google Scholar
55. Roehrich, Gilles. 1993. « Nouveauté perçu d’une innovation». Recherche et Applications en Marketing, vol.2, no 1, p1-15.
Publisher – Google Scholar
56. Roehrich, G., Valette-Florence P. et Rappacchi B. « Combined incidence of personal values, inlvolvement and innovativeness on innovative consumer behaviour». In « Is Marketing keeping up with consumer?». Séminaire ESOMAR, Vienne, 1989, p.261-278.
57. Rogers, Everett M. 1961. “diffusion of innovations”, New York: The Free Press.
58. Rogers, Everett M. 1983 “diffusion of innovations”, New York: The Free Press.
59. Rogers, Everett M., Shoemaker, F.F. 1971. Communications of Innovations. New york : The Free Press.
60. Sawhney, Mohanbir, Parikh, Deval. 2001. “ Where value lives in networked world”, Harvard Business Review (Janvier) p79-86.
Google Scholar
61. Skhiri, Sameh. 2000. “ Adoption des innovations en technologie de l’information par les entreprises internationales”. Mémoire de maîtrise, Montréal, Université de Québec à Montréal.
62. Song, X.M., Parry Mark E. 1997. « The Determinants of Japanese New Products Success», Journal of Marketing Research, 34 (février), p. 64-76.
Publisher – Google Scholar
63. Steenkamp, J.B., Baumgartner H. 1992. «The Role of Optimum Stimulation Level in Exploratory Consumer Behavior». Journal of Consumer Behavior, no 19, p. 434-448.
Publisher – Google Scholar
64. Sutherland, A. 1959, “The diffusion of an innovation in cotton spinning”, Journal of industrial economics, Mars. p.88-106.
Google Scholar
65. Tan, Margaret, Teo, Thompson S.H. 2000. «Factors Influencing the Adoption of Internet Banking». Journal of the Association for Information Systems, vol.1, p.1-44.
Google Scholar
66. Toufaily, Daghfous, Toffoli. 2009 «The Adoption of “E-Banking” by Lebanese Banks: Success and Critical Factors». International Journal of economic studies and management analysis vol.1(1): p.67-93.
67. Villarmois, O. 1999. “ Evaluer la performance des réseaux bancaires- la méthode DEA”. Décisions Marketing, no 16 (janvier), p39-50.
Google Scholar
68. Villates, Dominique. 1997. « Demain, la banque à distance». Banque, no. 585, p.68-70.
69. Wiegran,G., Koth A., «Customer Retention in on-line Retail». Journal of Internet Banking and Commerce. www.arraydev.com/commerce/jibc/articles.htm
70. Zaichkowsky, J.L. 1986. « Conceptualizing involvment». Journal of Advertising, vol. 15, no.2, p.4-14.
Publisher – Google Scholar
71. Zmud, R.W., 1982. “Diffusion of modern software practices: Influence of centralization and formalization”, Management Science, n°28, vol 12, (Décembre), p.421-431.
Google Scholar
Appendix 1: Histogram of eigenvalues
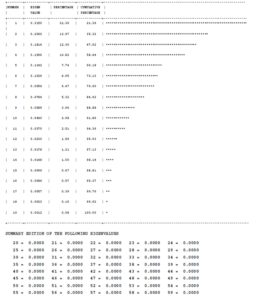
Appendix 2: Table of eigenvalues and modified inertia rate
Appendix 3: Contribution to the inertia of the cloud and the inertia of the first three factorial axes
Appendix 4: Summary of the composition of the first factor
Appendix 5: Graph projection modalities (factors 1 and 2)
Appendix 6: Summary of the composition of the second factor
Appendix 7: Summary of the composition of the third factor
Appendix 8: Graph projection of modalities (factors 1 and 3)
Appendix 9: Factorial plan (1-2)
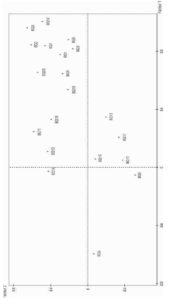
Appendix 10: Factorial plan (1-3)


