Introduction
The ever growing challenge of the increasing prevalence of non-communicable diseases, namely diabetes mellitus, hypertension and obesity, throughout the world has led to an equally increasing spectrum of research into different strategies to respond effectively to this epidemic. In the Caribbean, the four leading causes of death are heart disease, cancer, stroke and diabetes, and in 2000 they accounted for over 51% of all mortality as reported by the Caribbean Commission (2006). Obesity is a common underlying risk factor for heart disease, stroke and diabetes and it has increased to epidemic proportions across the region as suggested in the global Caribbean Connection (2011).
Clinical practice guidelines or protocols of care have been developed by the Caribbean Health Research Council (2006) to improve the quality of health care for many chronic conditions with the more commonly used protocols for chronic disease being directed at primary care. Practice guidelines for nutrition care have been developed for patients with Type 2 diabetes in various countries, and evaluation studies carried out on the therapy that follows these guidelines have shown that the management is more cost effective when the guidelines are followed (Dijkstra, 2006). Over the last fifteen years various regional institutions in the Caribbean have developed protocols for the clinical management of diabetes and hypertension which have been used to improve the quality of care of persons living with these conditions (CHRC, 2006). However, the nutritional component of care has not been adequately addressed in these protocols and no standard guidelines existed in the region for the nutritional management of obesity, diabetes and hypertension. The Caribbean Food and Nutrition Institute (CFNI), in 2004, launched a regional protocol for the nutritional management of diabetes, obesity and high blood pressure (hypertension). The launch of the protocol was followed by a training program in its use in five Caribbean Countries. The training involved all the members of the healthcare team at the primary health setting to ensure that a whole team approach is facilitated, and allow all the members of the team to be well equipped to participate efficiently in the patients’ management.
The delivery of health care by a coordinated team of individuals has always been assumed to be a good delivery process. Team care has generally been acknowledged by most as a criterion for high quality care. Successful chronic disease interventions usually involve a coordinated multidisciplinary care team. However, team care, especially in the primary care setting, is sometimes treated with skepticism and confusion. Wagner (1995) stated that population based care is an approach to planning and delivering care to defined patient populations that tries to ensure that effective interventions reach all patients who need them. It begins with a protocol or guideline that defines the components of high quality care. The steps required to deliver the intervention are specified and delegated to members of the team. Weingarten et al (2002) in a meta-¬analysis on interventions used in disease management programmes for patients with chronic illness reported that patient education was the most commonly used intervention that worked. This was followed by education of healthcare providers, whilst provider education, feedback and reminders were associated with significant improvements in provider adherence to guidelines and with significant improvements in patient disease control.
The aim of this research was to evaluate, through a chart audit, if the training on the use of the protocol had improved the quality of care being delivered to patients with Type 2 Diabetes in five Caribbean Countries. Outcomes of this change were not measured during this phase of the research as it formed part of a further phase conducted at a later stage.
Research Design and Methods
This study looked at healthcare professionals from five Caribbean countries and evaluated the practice change following training, through continuing professional development (CPD), in the use of the Protocol for the Nutritional Management of Obesity, Diabetes and Hypertension (CFNI, 2004). The sample was selected from healthcare workers in Jamaica, Guyana, Belize, St. Vincent and the Grenadines, and Suriname. All five countries were classified by the Organization for Economic Cooperation and Development (2003) as lower middle-income countries with per capita Gross National Income (GNI) ranging from US$746-2975. The participants for the training were chosen by the respective Ministries of Health and Diabetes Associations after an invitation letter was sent to them by CFNI explaining the aims and objectives of the training. The Ministries were encouraged to nominate physicians, dietetic professionals, nurses, medex (these are persons registered in Guyana to advise, under the supervision of a duly registered medical practitioner, members of the public on the promotion of health generally and the prevention of disease. They also diagnose and manage certain common ailments and identify such ailments as need referral to the supervising medical practitioner, or in an emergency directly to a hospital), and assistant nurses/nursing aides who were working in primary care and managed persons with obesity, diabetes and hypertension. A total of 279 healthcare professionals were nominated and trained.
The training was conducted in each country and consisted of a two and half day capacity building workshop facilitated by two experts from the Caribbean Food and Nutrition Institute (CFNI) in conjunction with national nutrition experts from the respective Ministries of Health. The training included an overview of the noncommunicable disease profile of the Caribbean region; the role of nutrition in the management of obesity, diabetes and hypertension; detailed hands-on the training of the tools included in the protocol relating to anthropometric and biochemical measurement; analysis of the nutrition related data; how to provide basic nutritional education and when and how to refer for expert dietetic advise.
A pre-training knowledge test was undertaken to ensure that all those chosen for training had a good knowledge of the management of diabetes, hypertension and obesity and were actively working in the management of patients with non-communicable diseases. Although not all the trained healthcare professionals had the legal facility to write directly in the patients’ notes (charts), they were under professional obligation to pass on the results of any interventions or evaluations that they had performed to the professional that had the legal facility to record this in the patients’ records. Different mechanisms existed in each of the countries but all healthcare professionals expressed the fact that if they intervened or evaluated a patient there were mechanisms to ensure this was recorded in the patients’ charts.
Of the total number of participants, one hundred and thirty three (133) were randomly selected by the national coordinators for a chart audit. Each country selected a proportion of the total cohort similar to the proportion of persons that attended the training using random generated numbers (Kendall, 1939) and logistical convenience with regards to location of the healthcare professionals. The cohort selected gave a ninety five percent (95%) confidence level with a confidence interval of 6. For each healthcare professional, up to ten patient charts were randomly selected using random generated numbers (Kendall, 1939), which gave a maximum of one thousand three hundred and thirty (1330) charts to be selected from the five countries. The number of charts selected followed the same number as that used in the Harris et al Canadian DICE study (2005). The same number was also used by Hearnshaw et al (2002) in the Health Technology Assessment Programme in the United Kingdom in its review criteria for clinical audit.
Ethical approval was sought from the University of the West Indies Medical Ethics Committee and this was given in May 2005.
The audit was done by the same investigator during country visits. The ten (10) patient record charts were randomly selected using random generated numbers (Kendall, 1939) and having the following criteria:
– Patient diagnosed with at least one of the following conditions; diabetes, hypertension, obesity
– Patient had to be initially diagnosed before the healthcare professional was trained on the use of the protocol
– Patient had to have been seen again after the healthcare professional attended the training for the protocol
A standardized evaluation instrument was developed and used for the medical chart audit. This instrument was divided into two sections. Section one had medico-social data of the patient while the second section had a list of sixteen (16) measurements or actions which the healthcare professional should have carried out, measured or completed and recorded in the medical charts, in accordance with the protocol. The medical notes were reviewed to identify if these parameters were carried out, measured or completed during the year prior to the date of training as well as during the year following the training. The parameters recorded were: Anthropometry following the protocol (height, weight, body mass index(BMI), waist measurement, hip measurement), capillary blood glucose (fasting and/or random), Haemoglobin A1c (HbA1c), serum cholesterol, HDL and LDL cholesterol, triglycerides, blood pressure, counselling on diet, and/or on physical activity and referral to a nutritionist/dietitian. All of these parameters were included in the protocol with references to international standards. All these parameters were included in the CPD training. Each parameter was given a one point score if it had been carried out and recorded. A maximum of 16 points (100%) were used for the pre and post training audit.
The medical chart audit results were analyzed using a McNemar test to establish statistical significance in the change. This test was selected as it can be used on paired nominal data from the same subjects before and after intervention, to determine whether there is change.
Results
A total of 1140 medical records met the established criteria for audit and were taken from Belize (26%), Guyana (12%), Jamaica (26%), St Vincent and the Grenadines (25%) and Suriname (10%). The audited clinics made up a geographical representation of the country. There was a gender distribution of 25% male and 75% female. Of these, 68% had a diagnosis of hypertension, 69% had a diagnosis of diabetes and 11.4% a diagnosis of obesity. These diagnoses were taken from the official medical record so that if the diagnosis was not written on the record, it was not registered as being available. Thus, the percentages stated above are only those that are registered in the medical charts and not necessarily a complete reflection of the diagnosis of the complete cohort.
Of those diagnosed with hypertension, 90% were being given oral medication for their disease management, the other 10% were only being treated by lifestyle modification and behavior change. This percentage was similar in all the countries except Guyana where this percentage was 66% of those diagnosed. Those diagnosed with diabetes were also predominantly treated with oral medication (69.2%) and another 0.9% had changed from lifestyle modification only to oral medication during the two year period of this research. Another 16.8% had changed from oral medication to insulin during the two year period of this research. Insulin was used as the main source of medication in 16.8% of the cohort and 7.1% were being managed through lifestyle modification only. Suriname had the largest insulin using group with 15.5% using insulin as a form of medication and a further 25% being converted to this form of management during the course of the study.
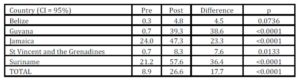
Of the total cohort, 20% had height measurement taken at any time prior to the training; which increased to 38.4% after the training, a change of 18.4%. In Guyana, no height measurement was recorded on the medical chart. However, following training, 52% of the charts had the height measurement recorded. In all the countries, the changes were statistically significant (Table 1), with the largest change being in Guyana with 52% and the smallest change in Belize with 4.4%
The measurement of body weight for the clients was registered in 67.1% of the charts prior to the training and increased to 77.2% after the training. The increase was reflected in all the individual countries except in St Vincent and the Grenadines where a decrease of 0.4% was noted in the post training (Table 1). The biggest change was again seen in the Guyana cohort with a pre to post training difference of 37.9%. Jamaica, St Vincent and the Grenadines and Suriname all recorded near total compliance with 96.3%, 97.2% and 96.6%, respectively for their post-training recording of weight measurement.
Table 1: Percentage of charts with height and weight measurement recorded pre and post training
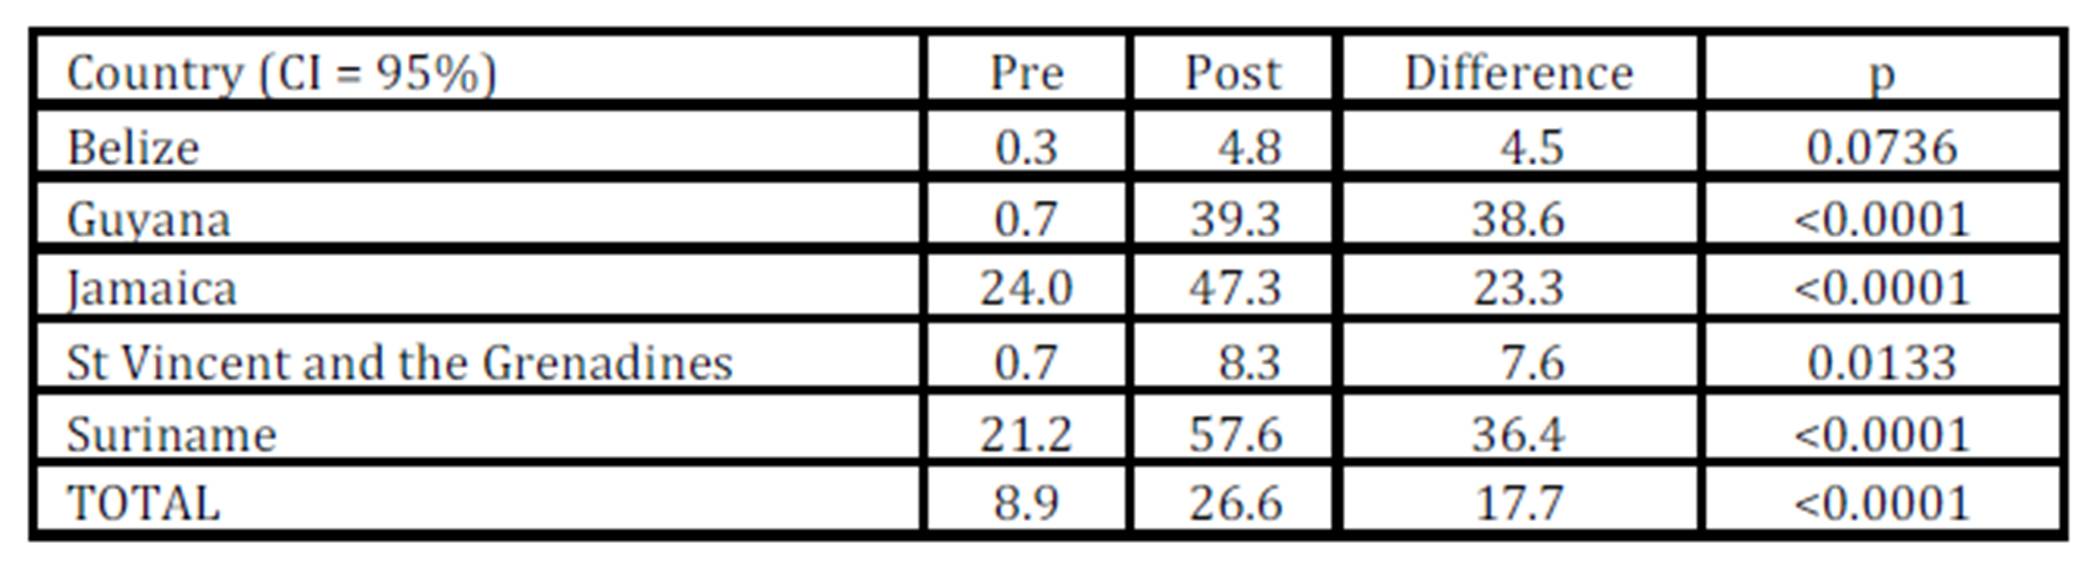
The Body Mass index was calculated and recorded on 8.9% of the total charts prior to the training workshop (Table 2). There was a significant increase to 26.6% in the anthropometric calculation of the charts after the training. Three countries had less than 1% of the charts with calculated and recorded BMI: Belize (0.3%) and Guyana and St Vincent and the Grenadines, both at 0.7%. The post training data show an increase in all countries with Guyana again making the largest increase of 38.6%, followed by Suriname with a 36.4% change which resulted in over fifty percent (57.6%) of the clients having their BMI calculated and recorded.
Table 2: Percentage of Charts with BMI Calculation Recorded Pre- and Post- Training
The anthropometric parameters of waist and hip measurements were the most poorly recorded in the entire cohort, and although there was a statistically significant change in the chart records from pre to post training, these were still relatively low (Table 3). At the pre-training stage, only 0.8% of charts had a waist record and only 0.4% had a hip measurement recorded. These increased to 9.0% for waist and 6.6% for hip measurements in the post-training record audit. In Guyana and Suriname, none of the charts had had a waist measurement recorded during the year prior to the training workshop. In both these countries, there was an increase after the training with Guyana having 14.3% of the charts with a waist measurement recorded and Suriname 17.8% of the charts had a waist measurement recorded. The lowest change was seen in the cohort from St Vincent and the Grenadines where only an additional 2.5% of the charts had a waist measurement carried out and recorded after the training. The situation was even worse in the case of hip measurements, where in Belize, Guyana, St. Vincent and the Grenadines and in Suriname there was no chart with a hip measurement recorded during the year prior to the training. The best change was seen in the Jamaica cohort with an increase of 11% of the charts having a waist measurement recorded, while the records in St Vincent and the Grenadines still had the lowest rate of this measurement recorded with only 2.1% of the charts complying with the protocol.
Table 3: Percentage of Charts with Waist and Hip Measurement Recorded Pre- and Post- Training
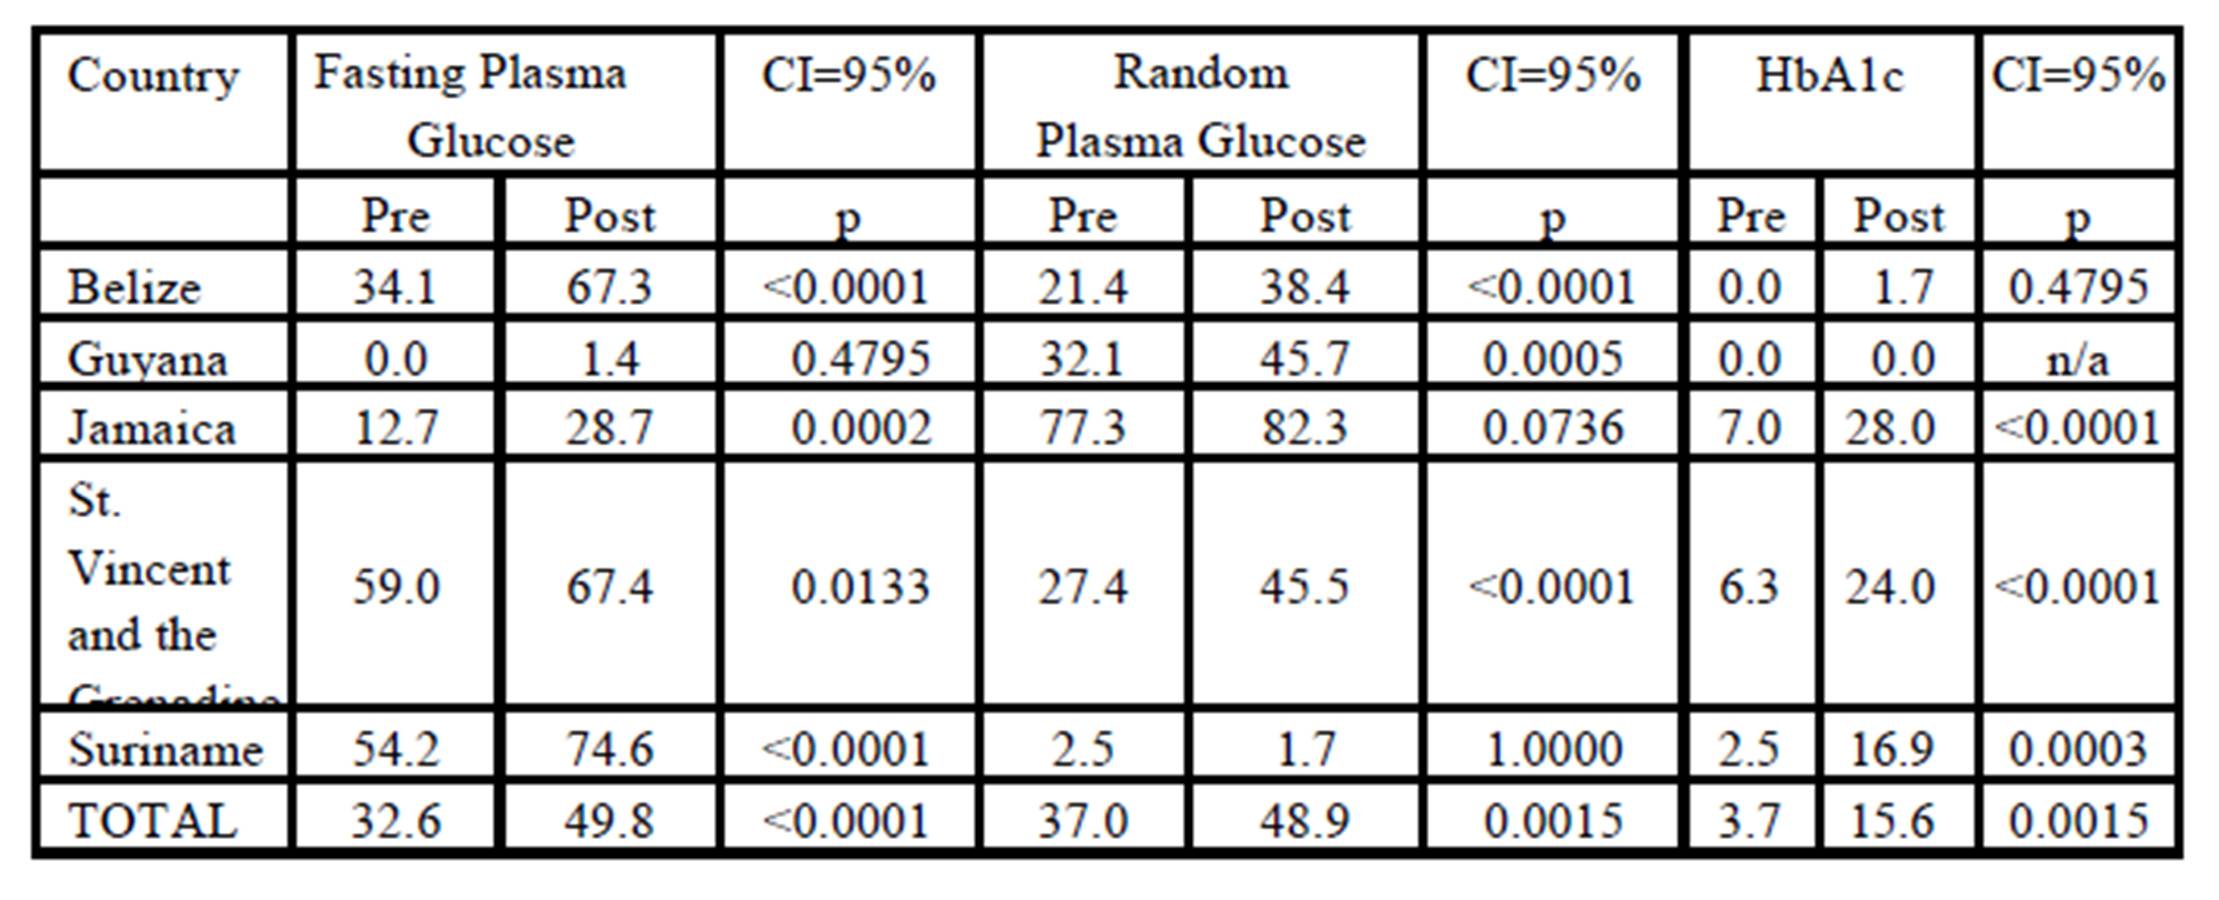
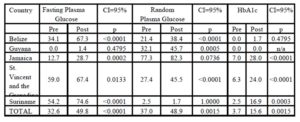
The blood glucose biochemical parameters measured and recorded all showed a significant increase from the pre to the post-training audit (Table 4). During the post-training period, in all the five countries, no new laboratory facilities were introduced. Fasting blood glucose was recorded in 32.6% of the charts, pre-training and recording increased to 49.8% in the year post-training. Similarly, random blood glucose was recorded in 37% of the charts pre-training with recording increasing to 48.9% of the charts. HbA1c was only recorded in 3.7% of patient charts during the year before the training; however the recording increased to 15.6% in the year following the training.
Each of the countries showed significant changes in the number of charts, with recorded fasting plasma glucose, with Belize increasing the number of charts from 34.1% to 67.3% and random plasma glucose from 21.4% to 38.4%. None of the charts had an HbA1c record in the pre-training year while 1.7% had this biochemical test done and recorded in the post-training year.
In Guyana, random plasma glucose is the biochemical test of choice with 32.1% having it recorded in the year prior to training and 45.7% having it done and recorded in the post-¬training year. Only 1.4% of the charts had a fasting plasma glucose recorded in the post-training year and none of the records had the test recorded in the pre-training period. None of the charts had an HbA1c record during the whole study period, neither pre- nor post-training.
Haemoglobin A1c measurements increased from 7% to 28% in the Jamaica sample during the pre- post training period, and the random plasma glucose measurements were recorded in 82% of the charts, an increase from 77% in the pre-training period. Fasting plasma glucose was only recorded in 12.7% of charts during the pre-training year and the recording increased to 28.7% in the post-training year. A similar change in this biochemical test was seen in the St Vincent and the Grenadines cohort with a change from 59% to 67.4% during the study period. Random plasma glucose was recorded in 27.4% of the charts in the pre-training period and an increase to 45.5% recording was seen in the post-training year. HbA1c was recorded in 6.3% of the charts during the pre-¬training period, and the biochemical measure recording increased to 24% during the post training period. A change was also seen in Suriname where only 2.5% of the charts had a recorded HbA1c in the pre-training year, and the recording increased to 16.9% during the post-training year. Fasting plasma glucose was recorded in 74.6% of the charts from the Suriname cohort in the post training years, an increase from 54.2% in the pre-training year. A decrease was seen in the random plasma glucose test which was recorded in 2.5% of charts during the pre-training year, and then only 1.7% in the post-training audit of patient charts.
Table 4: Percentage of Charts with FPG, RBG and HbA1c Recorded Pre- and Post¬-Training
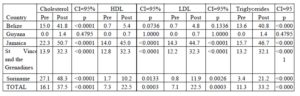
The lipid profile of the cohort was only measured and recorded scantily in the pre-¬training year with 16.1% having a recorded serum cholesterol level, 7.3% having an HDL and 7.1% an LDL cholesterol level recorded (Table 5) . Just over eleven percent (11.3%) had a triglyceride level measured and recorded during the pre-training year. The figures improved significantly during the post-training year with 37.5% of the cohort having a cholesterol level registered and 33.2% having a triglyceride level recorded. The cholesterol fractions HDL and LDL were recorded in 22.5% of the cohort respectively during the post-training year. These changes were mirrored in the country cohorts where the cholesterol and triglyceride values recorded in the Belize cohort improved from 15% to 41.8% and from 13.6% to 40.8%, respectively during the two years studied. The cholesterol fractions were recorded in 0.7% of charts during the pre-training year and the number of tests recorded increased to 5.4% for HDL and 4.8% for LDL in the post-¬training period. In Guyana the lipid profiles were very poorly recorded and no cholesterol, triglycerides or cholesterol fractions levels were recorded in the charts during the year prior to training. In the year following the training, 1.4% of charts had serum cholesterol and a triglyceride measurement recorded. The Cholesterol fractions were only recorded in one case (0.7%) from the whole cohort of 140 charts.
The situation in Jamaica was much better with over fifty percent (50.7%) of the cohort having serum cholesterol charted during the post-training year, an increase of 28.4% from the pre-training year. Triglyceride levels were recorded in 46.7% of charts, an increase of 31% from the pre-training year. The cholesterol fractions HDL and LDL recordings increased from 14% to 45% and from 14.3% to 44.7% respectively when the pre- and post-training years were compared. Another positive increase was seen in the St Vincent and the Grenadines cohort where the serum cholesterol levels recorded increased from 13.9% to 32.3% during the pre- to post-training period. Similarly, the triglyceride levels were recorded in 32.1% of the charts in the post-training period, an increase from 13.2% in the pre-training year. The cholesterol fractions were recorded in 32.3% of the charts during the post training year; having increased from 12.8% for HDL and 12.2% for LDL.
Serum cholesterol levels were measured and recorded in 48.3% of the charts from Suriname during the post-training year, an increase from 27.1% during the pre-training period. Triglyceride levels saw an even bigger increase with 21.2% being recorded in the charts during the post training year, an increase from 3.4% in the year prior to training. In the pre-training year, cholesterol fractions were very poorly recorded with only 1.7% of charts having an HDL record and 0.8% an LDL record. During the post-training year the recording of these biochemical tests increased to 10.2% of charts for HDL and 11.9% for LDL.
Table 5: Percentage of Charts with Cholesterol, HDL, LDL and Triglycerides Recorded Pre- and Post-Training
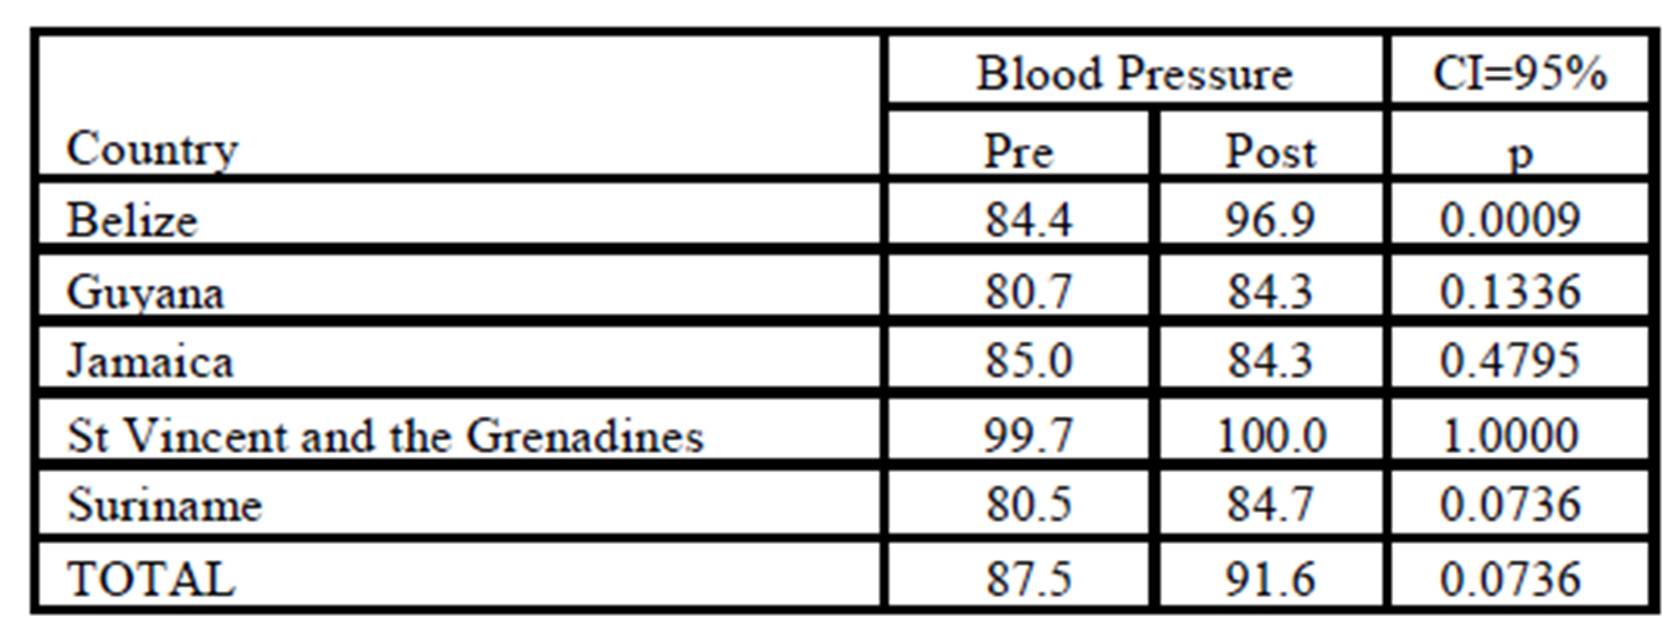
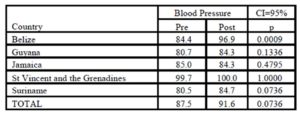
Blood Pressure recording is one of the basic measurements required for the management of diabetes and hypertension, however not all patient charts had a record of blood pressure measurement. Although there was an increase from 87.5% in the pre-training year to 91.6% in the post-training year, the missing data should be of concern. In fact, it was only St Vincent and the Grenadines that managed to have a 100% chart recording of blood pressure in the post-training year (Table 6). The recording rate was already very high, 99.7%, prior to the training and this shows that the recoding of blood pressure measurement is institutionalized. The recording of blood pressures in the Jamaica cohort actually went down from 85.0% to 84.3% during the pre- post-training period while in the other countries the pre- post training rates remained in the eighties, apart from Belize which increased the rate of measurement from 84.4% to 96.7%.
Table 6: Percentage of Charts with Blood Pressure Measured and Recorded Pre- and Post Training
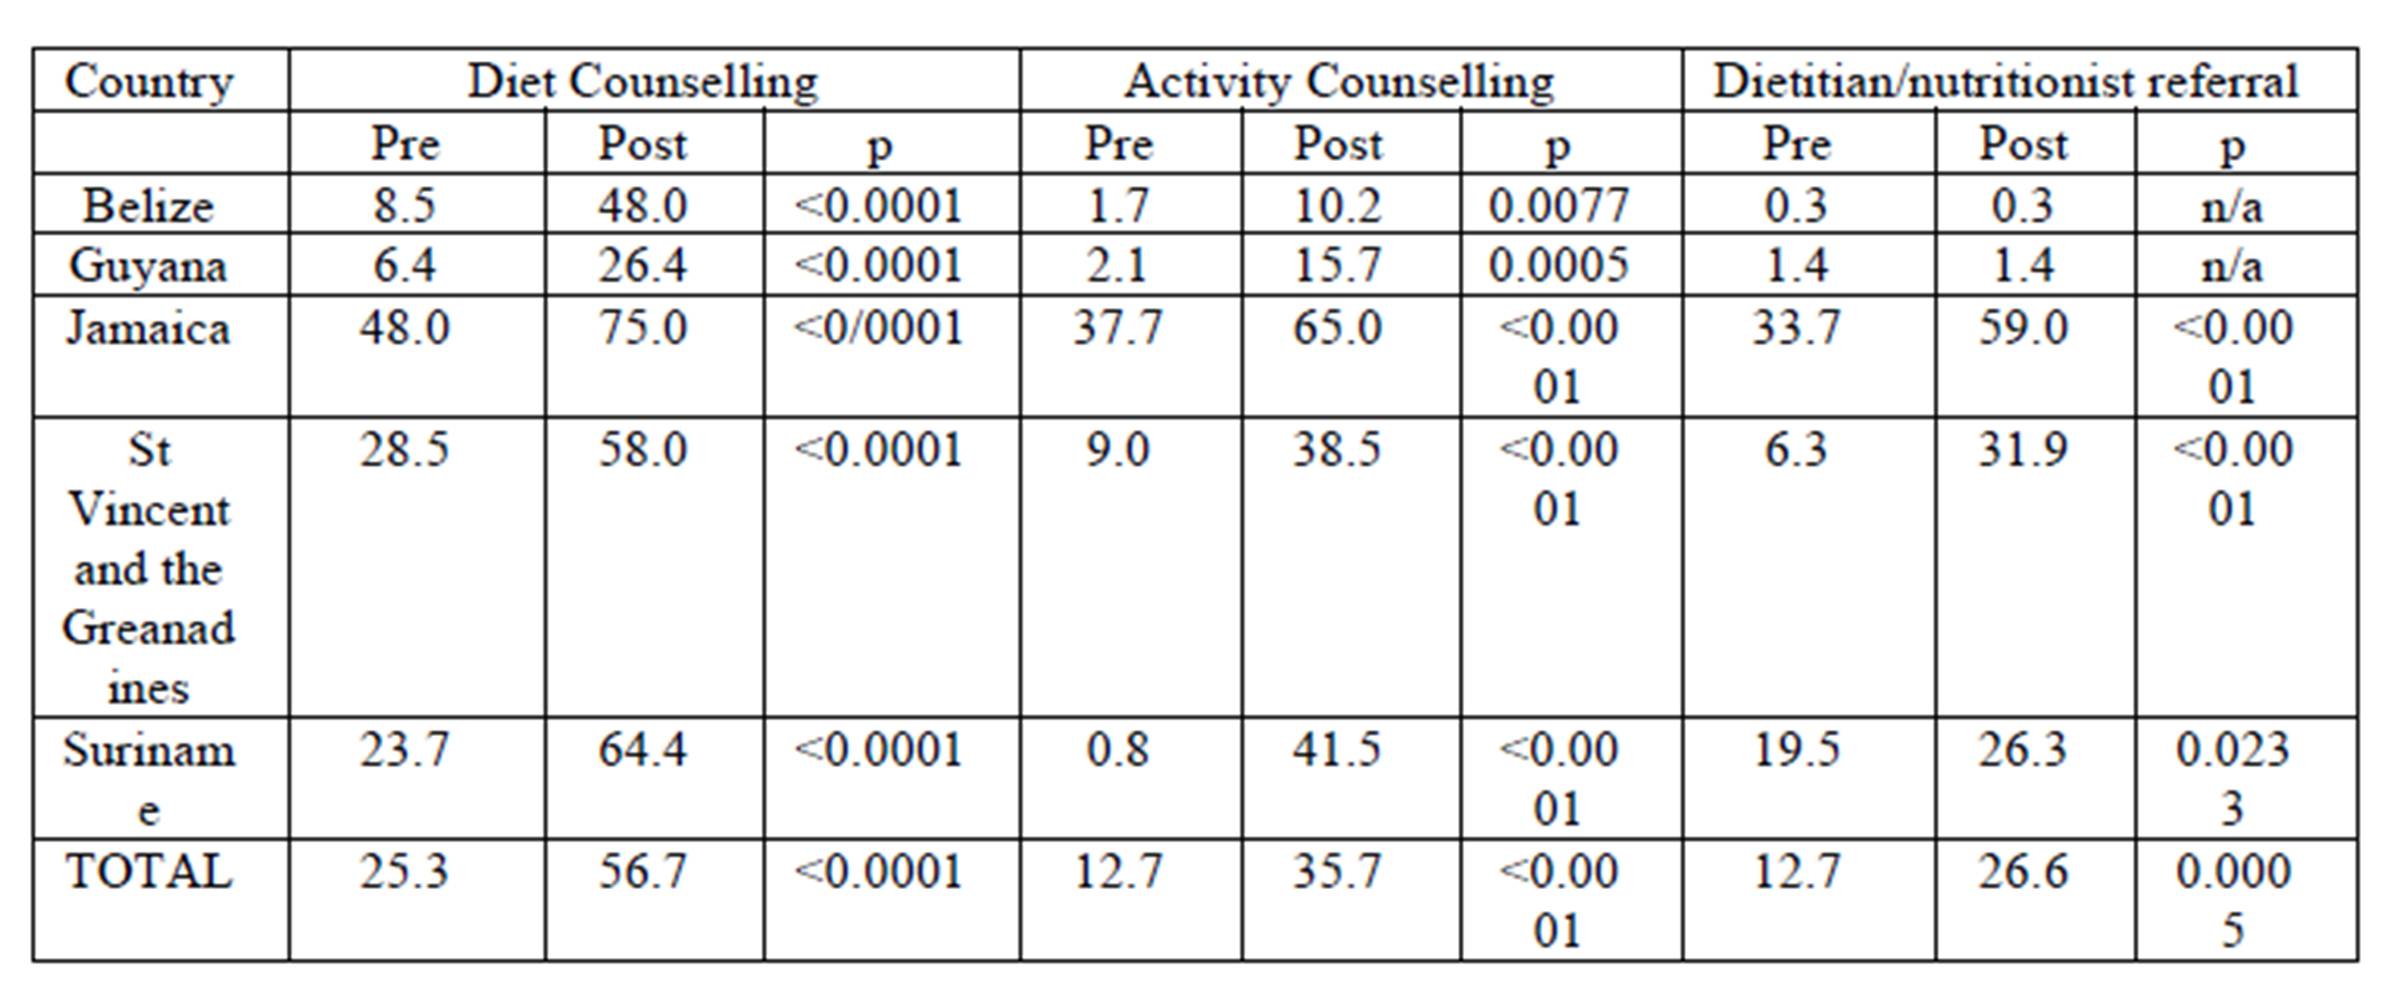
A quarter of the total cohort (25.3%) had a record of having had counselling on diet, and just over an eighth (12.7%) had recorded counselling on physical activity during the year prior to the training workshops (Table 7). These figures increased to over half of the charts (56.7%) for diet and over a third (35.7%) for physical activity during the year following the training. Referral to a nutritionist or dietitian increased from 12.7% before the training to 26.6% in the year following the training. Although the cohort in Belize showed the best improvement for diet counselling, with a shift from 8.5% to 48.0% following the training, it still had over half of the charts with no record of diet counselling recorded. The situation in Guyana was worse with a shift from 6.4% to only 26.4% of the charts having diet counselling recorded. Jamaica, St Vincent and the Grenadines and Suriname all had over half of the charts with diet counselling recorded during the post-training period with Jamaica having the best results of 75% of the charts having a record that the client had been counselled on diet. This represented an increase from 48% of records during the pre-training period. Suriname also showed a good shift with a change from 23.7% to 64.4% of the charts having a record of diet counselling. The result was similar to that of St Vincent and the Grenadines where the shift was from 28.5% during the pre-training year, to 58% in the post-training year.
Table 7: Percentage of Charts with Reference to Diet and Physical Activity Counselling and referral to Dietician/Nutritionist Pre- and Post-Training
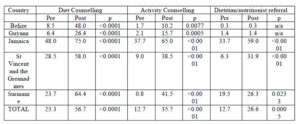
Counselling for physical activity did not have such a good result with only Jamaica managing to have more than half (65%) of the charts having this parameter recorded (Table 7). These results were expected as Jamaica also started with the highest value in the pre-training audit with 36.7% of the charts having physical activity counselling recorded in the patients history. All the other four countries started with a value under 10% with Suriname having only 0.8% of the charts having physical activity counselling recorded, however they attained the best change with 41.5% of the charts having this parameter recorded in the post-training year. St Vincent and the Grenadines also showed a very good shift moving from 9% to 38.5% of the charts having physical activity counselling recorded in the charts during the pre- post-training periods. Belize and Guyana lagged behind the other countries and although they started with a very low score, 1.7% and 2.1% respectively, they only had 10.2% and 15.7% of the charts with physical activity counselling noted in the charts during the post-training period. Referral to dietitian or nutritionist was also a problem in these two countries, and in fact there was no change from the pre- to post-training audits with only 0.3% and 1.4%, respectively. The main reason behind this lack of increased reporting is mainly due to the fact that both countries have a severe shortage of dietitian and nutrition professionals in the health services.
In the other three countries, the referral rate increased substantially with Jamaica showing 59% of the clients being referred to the dietitian or nutritionist as noted in the charts. This was an increase from 33.7% in the pre-training year. In St Vincent and the Grenadines, the shift was the most notable with a change from 6.3% in the pre-training year to 31.9% of the clients having the referral to the dietitian or nutritionist recorded during the post-¬training year. The change in Suriname was not as large as 19.5% of the clients had the referral recorded in the pre-training year, and the recording was increased to 26.3% during the post-training year.
Discussion and Conclusions
Improvement in recording the quality of care was seen in all five countries and the chart audits at the pre-training stage were similar to those found by Pinto Pereira et al. (2009), in a similar chart audit study they did in primary care facilities in Trinidad. They found that >95% of records had a blood pressure and weight evaluated, which is similar to the pre¬-training data obtained from St Vincent and the Grenadines (97.6%), and very close to that in Jamaica (91.7%). The data from the post-training in these two countries and from Suriname all exceeded 95% and showed similarity to the results found in Trinidad by Pinto Pereira et al (2009).
Pre- to post-training changes in the percentage of height and weight recorded, and BMI calculated, were all statistically significant, with Guyana showing an increase in height measurement from zero to fifty two percent of the clients during one year after training. A similar situation was identified in the biochemical parameters where testing for HbA1c increased from 3.7% in the pre-training period to 15.6% in the post-training evaluation. The pre-training testing results were also consistent with the results found by Pinto Pereira et al. (2009) in Trinidad (1.6 — 7%).
The results from the chart audit confirm that an enabling environment is an essential component for behaviour change and compliance to protocols by healthcare professionals. In the countries where the pre- to post-training shift was the least, Belize, the issue of lack of equipment and personnel time had already been identified in the run up to this research. The healthcare professionals all agreed that if these two barriers could be overcome, the compliance rate would be much higher.
A similar situation was identified in the biochemical parameters where HbA1c increased from 3.7% to 15.6%, however, Belize still had very low scores and Guyana had not increased from its zero level at the pre-training stage. These can be explained by the lack of laboratory facilities in each of the two countries (Ministry of Health, 2006 and PAHO, 2009). The same applies to the plasma lipid values where Guyana increased minimally, and although Belize increased the number of patients having total cholesterol scores, as the lipid faction levels can only be done in one institution in the country, the increase seen post-training was minimal.
Kirkman et al (2002) showed that before any intervention, rates of adherence to guidelines would be low with 20% of patients having HbA1c measurement, 44% for lipid profile and 78% for blood pressure measurement. However, one year after the development of consensus guideline and training, these levels all improved with statistical significance. Improved care through the use of practice guidelines was also shown by Geil and Leontos (2004) who stated that among individuals with type 2 diabetes, who received practice guideline care, there was a significantly lower HbA1c when compared to those who were receiving standard care. Gross R et al (2003) also found that adherence to guidelines for diabetes was associated with higher patient satisfaction with care. In this phase of the research, the outcomes of the improved care i.e. disease management, were not measured, however it may be assumed that as the protocols of care were adhered to better, then the quality of care also improved.
The human resource capacity in nutrition in all these countries is very poor and explains the results found in the chart audits with Belize and Guyana, the poorest resourced of the five countries, showing very minimal changes. The other countries fared much better although the referral rate is still below the International Diabetes Federation acceptable rate (IDF, 2009), the reason being mainly due to the limited human resources in the public sector and the cost which is sometimes associated with referral to dietitians working in the private sector.
The results from the study through the increased use of anthropometric and biochemical testing of patients and adherence to the Caribbean protocols of care, showed that continuous professional development does improve practice in the management of obesity, diabetes and hypertension in primary care settings in the Caribbean. It also showed that the use of a Protocol of Care for nutrition improves the quality of care and the medical nutrition management of persons with Diabetes in the Caribbean; this is consistent with other studies including that of Gray (2004). Asnani et al (2005) in a clinical audit of the quality of care of hypertension in general practice in Jamaica, showed that there was limited adherence to the Ministry of Health recommended hypertension management guidelines. The authors state that there were clear gaps between current practice and standards that exist internationally and locally for the management of hypertension. They further recommended that the Ministry of Health needed to disseminate and educate general practitioners about the standards of care guidelines. The study showed that CPD training is an effective process through which adherence to guidelines is increased and the quality of care improved.
The lack of human resources, biochemical labs and the cost of the tests were the three major barriers that could be identified for lack of compliance through this research. This is not uncommon in the developing world as also quoted by Manzi et al (2012). More research on how to overcome these barriers needs to be done especially from the policy and planning aspects of the primary health services.
Acknowledgements
The authors would like to acknowledge Dr Fitzroy Henry, Director of the Caribbean Food and Nutrition Institute (CFNI). Also Miss Renee Rankine who assisted in the data input, as well as the Ms Sandra Collins (Belize); Mrs Norma Howard (Guyana); Mrs Sharmaine Edwards (Jamaica); Mrs Andrea Robin (St Vincent and the Grenadines); and Ms Ana Gatrow (Suriname). The funding for this research was made possible through a grant from the World Diabetes Foundation.
References
1. Asnani, M., Brown, P., O’Conner, D., Lewis, T., Win, S. and Reid, M. A. (2005) “Clinical audit of the quality of care of hypertension in general practice,” West Indian Med Journal, 54(3) 176-80.
Publisher – Google Scholar
2. Caribbean Community and Common Market and Pan American Health Organization, (2006) Report of the Caribbean Commission on Health and Development, Ian Randle Publisher, Kingston, Jamaica.
3. Caribbean Food and Nutrition Institute (CFNI), (2004) “Protocol for the. Nutritional Management of. Obesity, Diabetes and Hypertension in the Caribbean,” CFNI Printing, Kingston, Jamaica.
4. Caribbean Health Research Council, (2006) “Managing diabetes in primary care in the Caribbean,” [Retrieved June 7, 2014], http://www.chrc-caribbean.org.
5. Dijkstra R., Niessen L., Braspenning J., Adang E., Grol R. (2006) “Patient-centred and professional-directed implementation strategies for diabetes guidelines: a cluster-randomized trial-based cost-effectiveness analysis,” Diabetic Medicine, 23(2) 164-170.
Publisher – Google Scholar
6. Geil, P., and Leontos, C. (2004) “Nutrition practice guideline care improves diabetes outcomes,” Diabetes Spectrum, 17(2) 83-86.
7. Gray, N. (2011) “How can nutrition aid diabetes management?” Nutraingredients Special edition on diabetes [Retrieved June 7, 2014], http://www.nutringredients.com.
Publisher – Google Scholar
8. Gross, R., Tabenkin, H., Porath, A., Heymann, A., Greenstein, M., Porter, B., and Matzliach, R. (2003)
“The relationship between primary care physicians’ adherence to guidelines for the treatment of diabetes and patient satisfaction: findings from a pilot study”, Family Practice, 20(5) 563-569.
Publisher – Google Scholar
9. Harris, S., Ekoe, J.M., Zdanowicz, Y. and Webster-Bogaert, S. (2005) “Glycemic control and morbidity in the Canadian primary care settings (results of the diabetes in Canada evaluation — DICE study),” Diabetes Research and Clinical Practice, 70(1) 90-97.
Publisher – Google Scholar
10. Hearnshaw, H., Harker, R., Cheater, F., Barker, R. and Grimshaw, G. (2002) “A study of the methods used to select review criteria for clinical audit,” Health Technology Assessment, 6(1).
Google Scholar
11. Henry T. “The epidemic of obesity in the Caribbean—Can it be rectified?,” (2011) [Retrieved June 7, 2014] http://www.mnialive.com/articles/the-epidemic-of-obesity-in-the-caribbean-quot-can-it-be-rectified?A=WebApp&CCID=
14585&Page=3&Items=3
Publisher – Google Scholar
12. International Diabetes Federation (2009). “International standards for diabetes education”, 3rd Edition, IDF, Brussels, Belgium.
13. Kendall, M., & Babington Smith, B. (1939). “A table of random sampling numbers”, Cambridge University Press, Cambridge, UK.
14. Kirkman, S., Caffrey, H., Williams, S. and Marrero D. (2002) “Impact of a program to improve adherence to diabetes guidelines by primary physicians,” Diabetes Care, 25(11) 1946-1951.
Publisher – Google Scholar
15. Manzi, F., Schellenberg, J. A., Hutton, G., Wyss, K., Mbuya, C., Shirma, K., Mshinda, H., Tanner. A. and Schellenberg, D. (2012)” Human resources for health care delivery in Tanzania: a multifaceted problem,” Biomed Central Human Resource for Health. 10(3) 1478-4491.
Google Scholar
16. Ministry of Health Belize (2006) “Belize Health Agenda 2007-2011,” [Retrieved June 6, 2014] http://health.gov.bz/www/publications/epidemiology-publications/266-belize-national-health-agenda-2007-2011
17. Organization for Economic Cooperation and Development (2003) “DAC List of Aid Recipients as at 1 January 2003,” [Retrieved July 21, 2006] http://www.oecd.org/dataoecd/35/9/2488552.pdf
18. Pan American Health Organization (PAHO) (2009) “Guyana Country Cooperation Strategy 2010-2015,” [Retrieved June 6, 2014] http://www.paho.org/guy/index.php?option=com_content&view=article&id=68&Itemid=262
19. Pinto Pereira, L. M., Hinds, A., Ali, I., Gooding, R., Ragbir, M., Samaroo, K., Nayak, S. (2009).
“Do current standards of primary care of diabetes meet with guideline recommendations in Trinidad, West Indies?,”Primary Care Diabetes, 3(2) 91-6.
Publisher – Google Scholar
20. Wagner, E.H. (1995) “Population-based management of diabetes care,” Patient Education and Counselling, 26, 225-230.
Publisher – Google Scholar
21. Weingarten, S.R., Henning, J.M., Badamgarav, E., Knight, K., Hasselblad, V., Gano, A., et al. (2002)
“Interventions used in disease management programs for patients with chronic illness – which ones work? Meta-analysis of published reports,” British Medical Journal, 325, 925-933.
Publisher – Google Scholar