Introduction
Coffee or “ahwa” was first introduced in the Arab world during the 14th century; and it was spread out to the rest of the world later on in the 17th century (Francis, 2013). However, in Egypt it was not served in public places until it was available in large quantities and those places or coffee shops were named “ahwa” after the name of the beverage (Alpion, Gezim, 2011). Men go there more than women and they like to drink tea or coffee/“ahwa”, smoke Hookah (water pipes or “shisha”), play table games (e.g. backgammon or dominos), and read the newspaper (National Geographic, retrieved 2013). In the 20th century there was a trend to use them as a place for political and social debates (Alpion, Gezim, 2011). Also in the 20th century some modern coffee shops started to emerge in Egypt such as Cilantro and Starbucks. This study is only focusing on those modern coffee shops (note that in some studies the traditional coffee shops are referred to as “modern” contrary to this study).
Five very popular coffee shops were randomly chosen and studied; but only one helped and knew about this data collection and that one was Cilantro (the others are referred to as competitor A, B, C, and D). Cilantro’s first location was in the elite Zamalek district followed by the one close to the old campus of the American University in Cairo (AUC) in Egypt. Competition, on the other hand, led to the emergence of other “modern” coffee shops such as Coffee Bean, Costa Coffee, and Starbucks.
The customer watch started in the summer of 2010 during several weekdays/weekends in five different coffee shops that were located in five major districts in Cairo as well as in Giza (all carried out at the same point in time) and consuming 1000+ hours of customer watch. The five districts chosen were City Stars, Korba, Maadi, Mohandiseen, and Zamalek. Data collectors were given a standard format for collecting the data. Those with laptops had a softcopy to use. All variables collected were as follows (note that the variables analyzed and used in this research are in italics):
• Gender
• Age
• Duration
• Segment (Tourist, office worker, shopper, student, other).
• Nationality (local, other)
• What are they doing?
• What did they order? (food, beverage, take-away food, take-away beverage, no order)
The shifts studied and used in this research were (5 hours each):
• Evening shifts from 6 pm to 11 pm.
• Morning shifts from 8 am to 1 pm.
• Afternoon shifts from 1 pm to 6 pm.
The days were chosen:
• Wednesdays (weekday in Egypt)
• Thursday (weekday/weekend in Egypt)
• Friday (weekend and prayer day in Egypt)
The data collected was based on variables agreed upon by Ms. Beshir (Cilantro’s General Manager at that time). Trying to collect all the data at once is not ideal as presented in a study to investigate the customers of Starbucks (posted by Joseph Ruiz, 2012). Here, for example, differentiating between drinks was not considered; contrary to what was done in the Starbucks study. This study analyzed the top most important three variables as prioritized by Ms. Beshir (displayed above in italics).
Affinity analysis, Business Intelligence (BI), data-mining, data warehousing, knowledge discovery, Knowledge Discovery in Databases (KDD), and market basket analysis, are terms that are used interchangeably in the literature to mean more or less the same thing (FactPoint Group, 2008; Goele and Chanana 2012; Gutierrez, 2013; Kroenke, 2009). Kroenke (2009) interprets data mining as discovery driven (KDD), and as a tool (BI) that uses statistics, mathematics, and artificial intelligence to help make forecasts. Data mining is an integral part of knowledge management (KM) that uses the knowledge to compete with (Silwattananusarn and Tuamsuk, 2012). Affinity analysis is used by Saks to recommend products to customers based on their purchase history and other customers who bought the same thing. Data mining analyzes the data from different perceptions and provides information to help reach an optimal decision to increase revenues or decrease costs and not just run the business. Market basket analysis helps in identifying items that drive the purchase, in classifying the shopping event as well as comparing the different branches/stores (Gutierrez, 2013). When the uncertainty as well as the competition is high, the strategic information systems must be coupled with techniques such as data mining to efficiently manage the huge amount of data (Padhy et al., 2012). Padhy et al., (2012) warn against trying to come up with one data mining system that fits all. Data mining in restaurants with the high turnover of its managers is very important in making forecasting decisions (Liu et al., 2001). Starbucks worldwide accredited the importance of data mining in this volatile restaurant industry (Starbucks, 2013).
To search for patterns and relationships among data, some data mining techniques are applied using MS Excel tools (and its add-ons) along with simple formulas done by the author. From the 8404 customers that were watched in the five different districts, almost half of them were Evening customers. The rest were either Morning or Afternoon customers with the former being two-thirds more than the latter (see left of Exhibit #1). Note that almost half of the Food and Beverage items were sold in the Evening (47%) next to that is the Morning shift amounting to 36% of the items sold and only 16% of the items were sold during the Afternoon shift (see right of Exhibit #1).
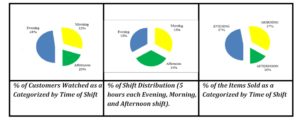
Exhibit # 1: Shift Distribution in Terms of the Number of Customers (left), Hours per Shift (middle), and Items Sold per Shift (right)
Regarding the number of female versus male customers, the difference was irrelevant with 51% females and 49% males (contrary to the traditional “ahwa” as previously noted). Even when analyzed in terms of shifts, it was not (2001 female customers versus 2040 male customers during the evening shift; 1352 versus 1351 and 914 versus 746 for the morning and afternoon shifts respectively).
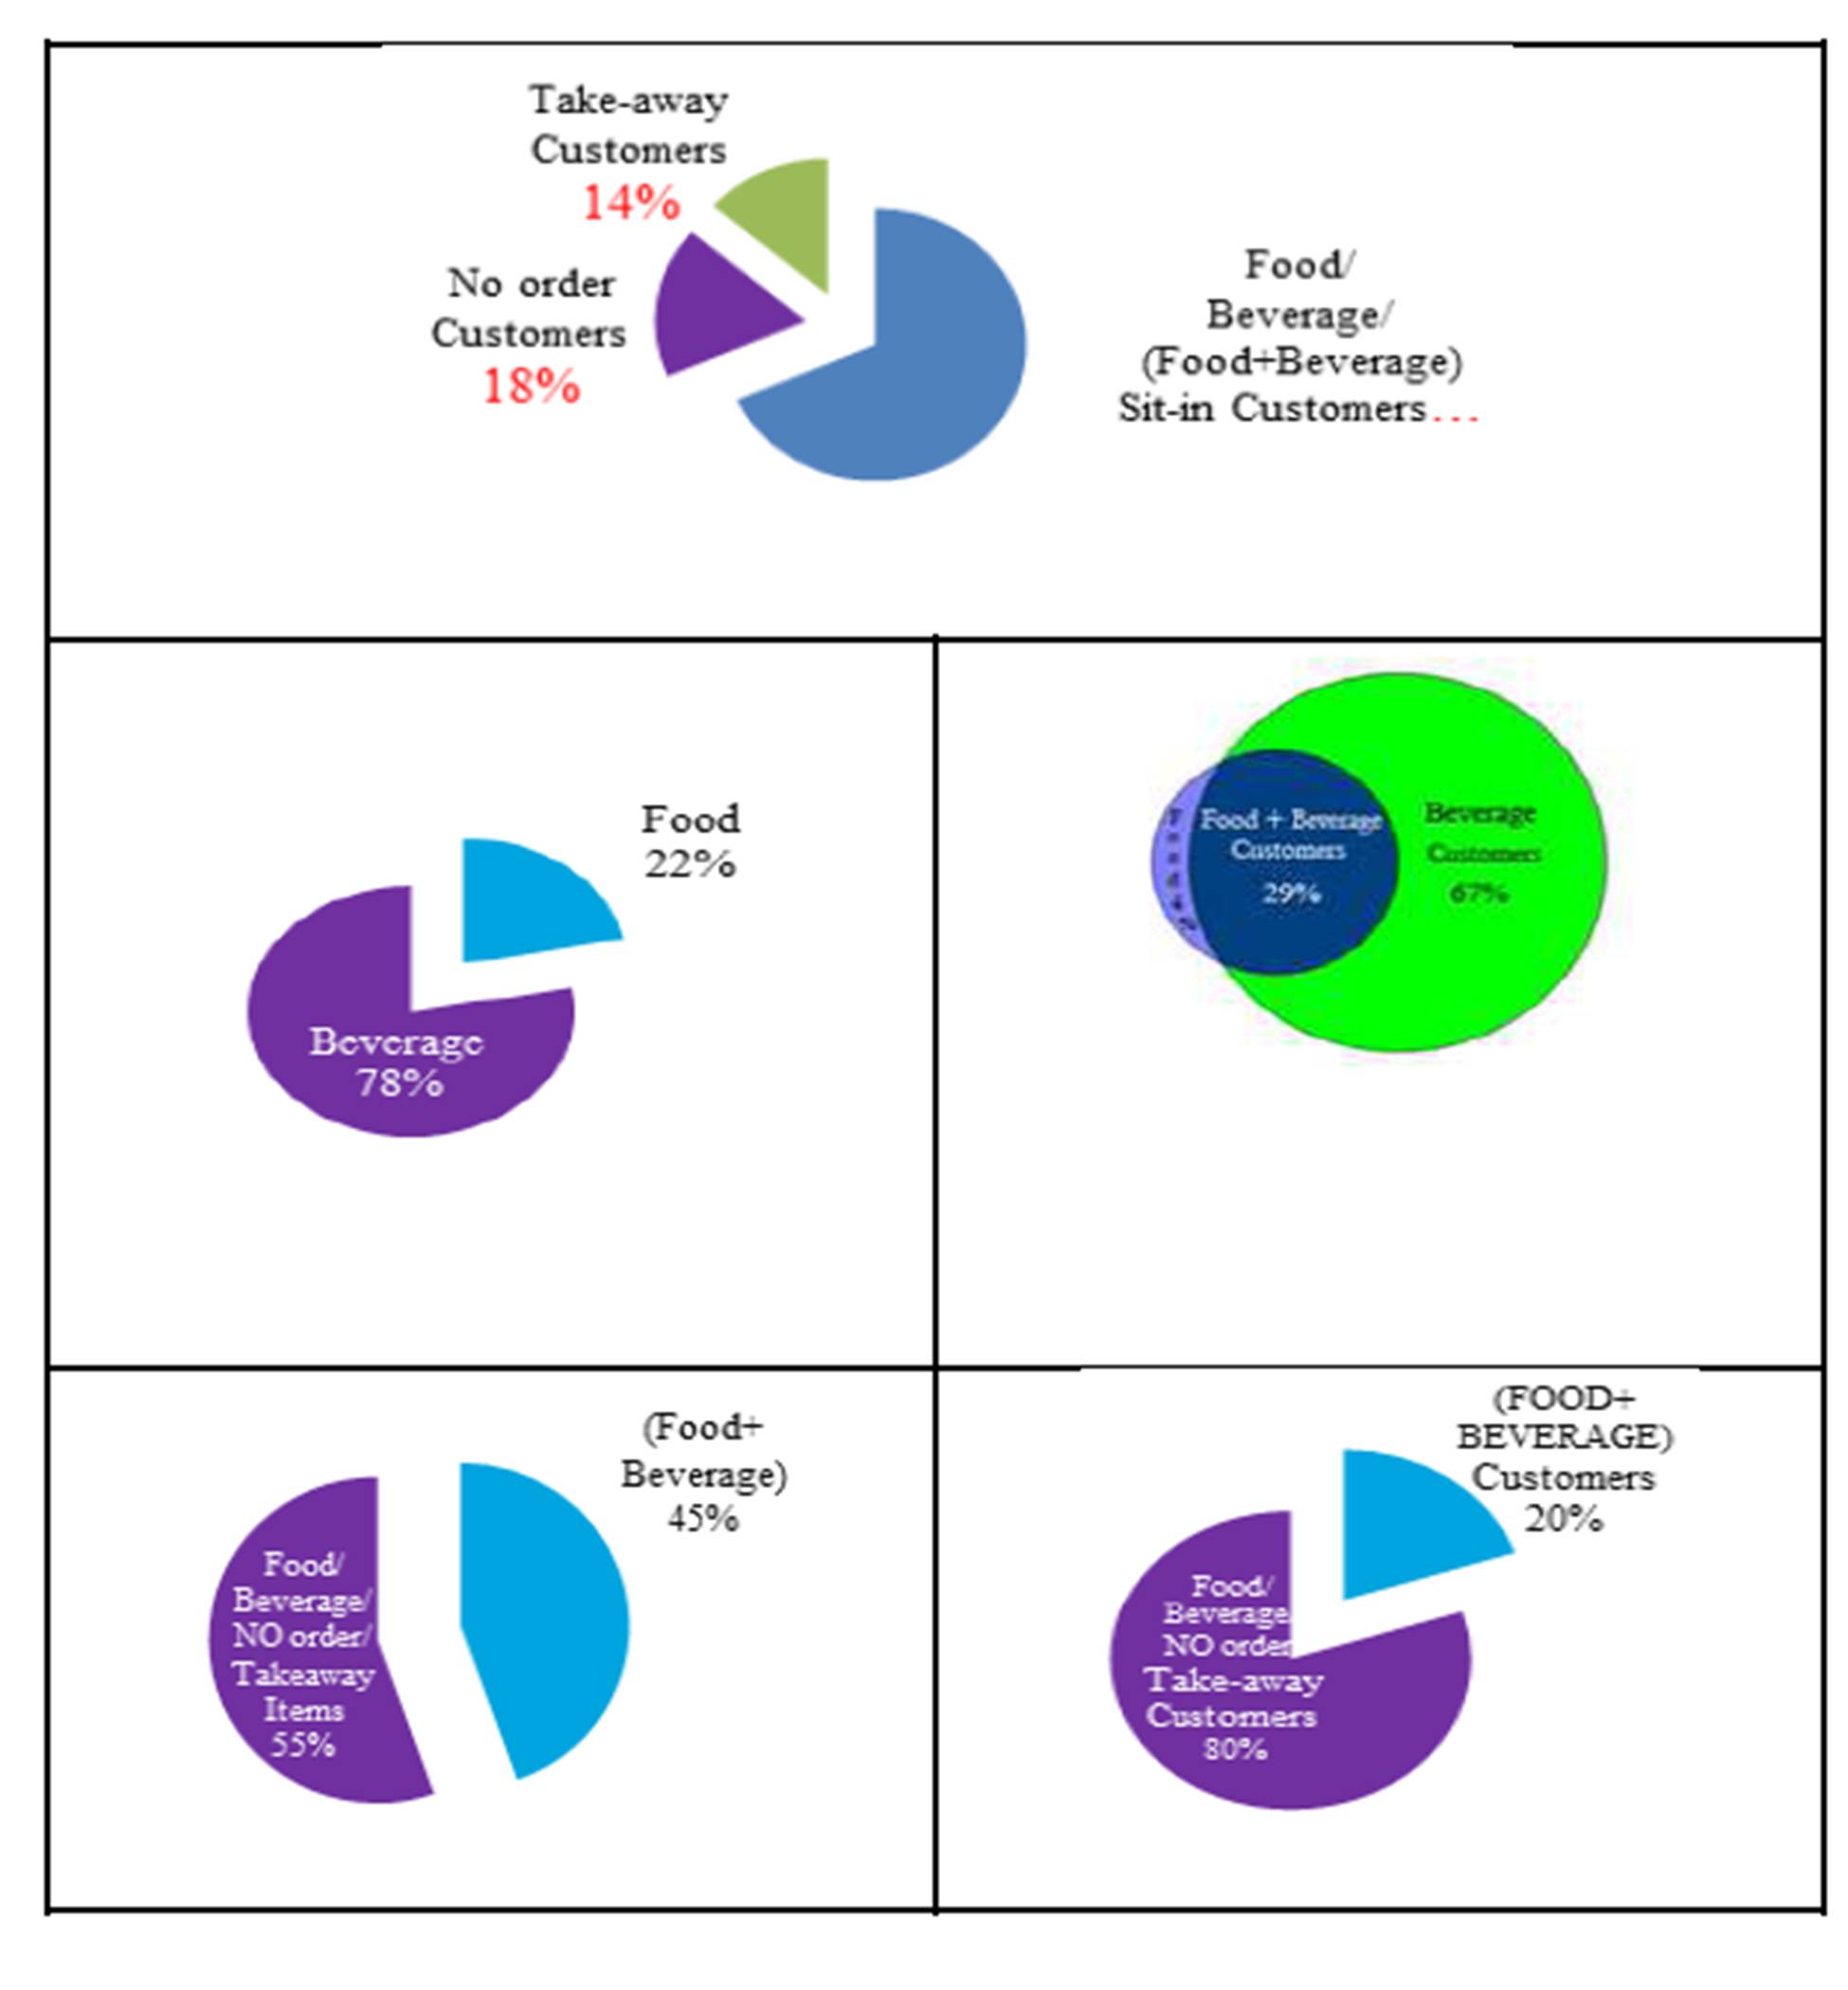
Interestingly, the data collected revealed that from the 8404 customers who were watched, 5494 customers ordered Beverage (3825 [67%] customers ordered Beverage alone –and 1669 [29%] customers ordered Beverage along with Food) and 1919 of the customers ordered Food (250 [4%] customers ordered Food alone) while 1512 [18%] customers ordered nothing and 1148 [14%] customers ordered take-away items. Further data-mining analysis that was done revealed that 8036 Food/Beverage items were sold: 78% of the items sold were Beverage alone items and 22% were Food alone items; while 45% of those were Food+ Beverage (Exhibit #2).

Exhibit #2: % of Food versus Beverage versus (Food+ Beverage) versus NO Order versus Take-away for All Items Sold (left)/ for Number of Customers (right)
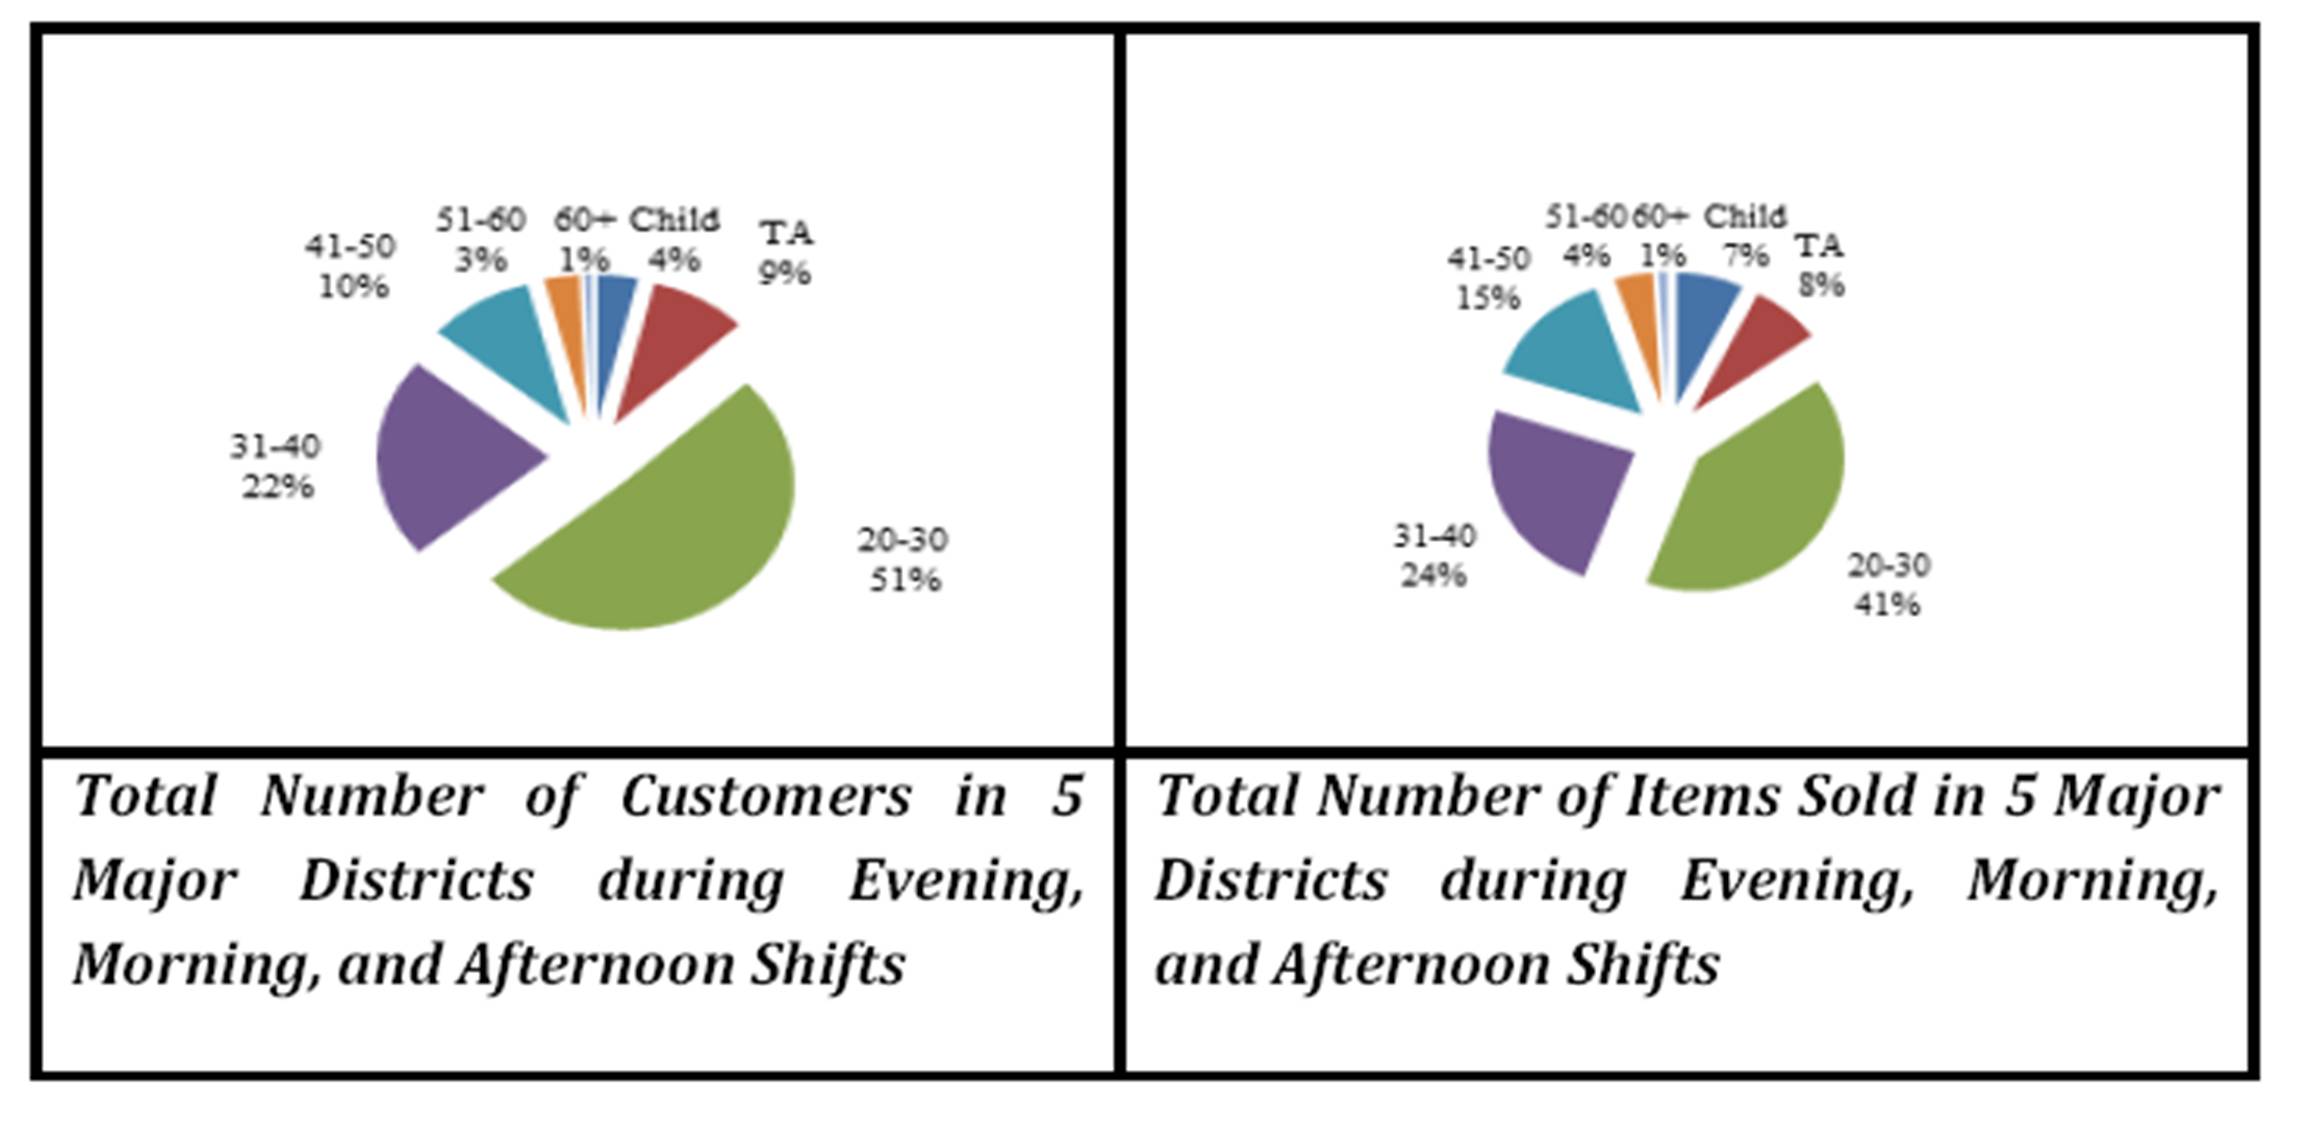
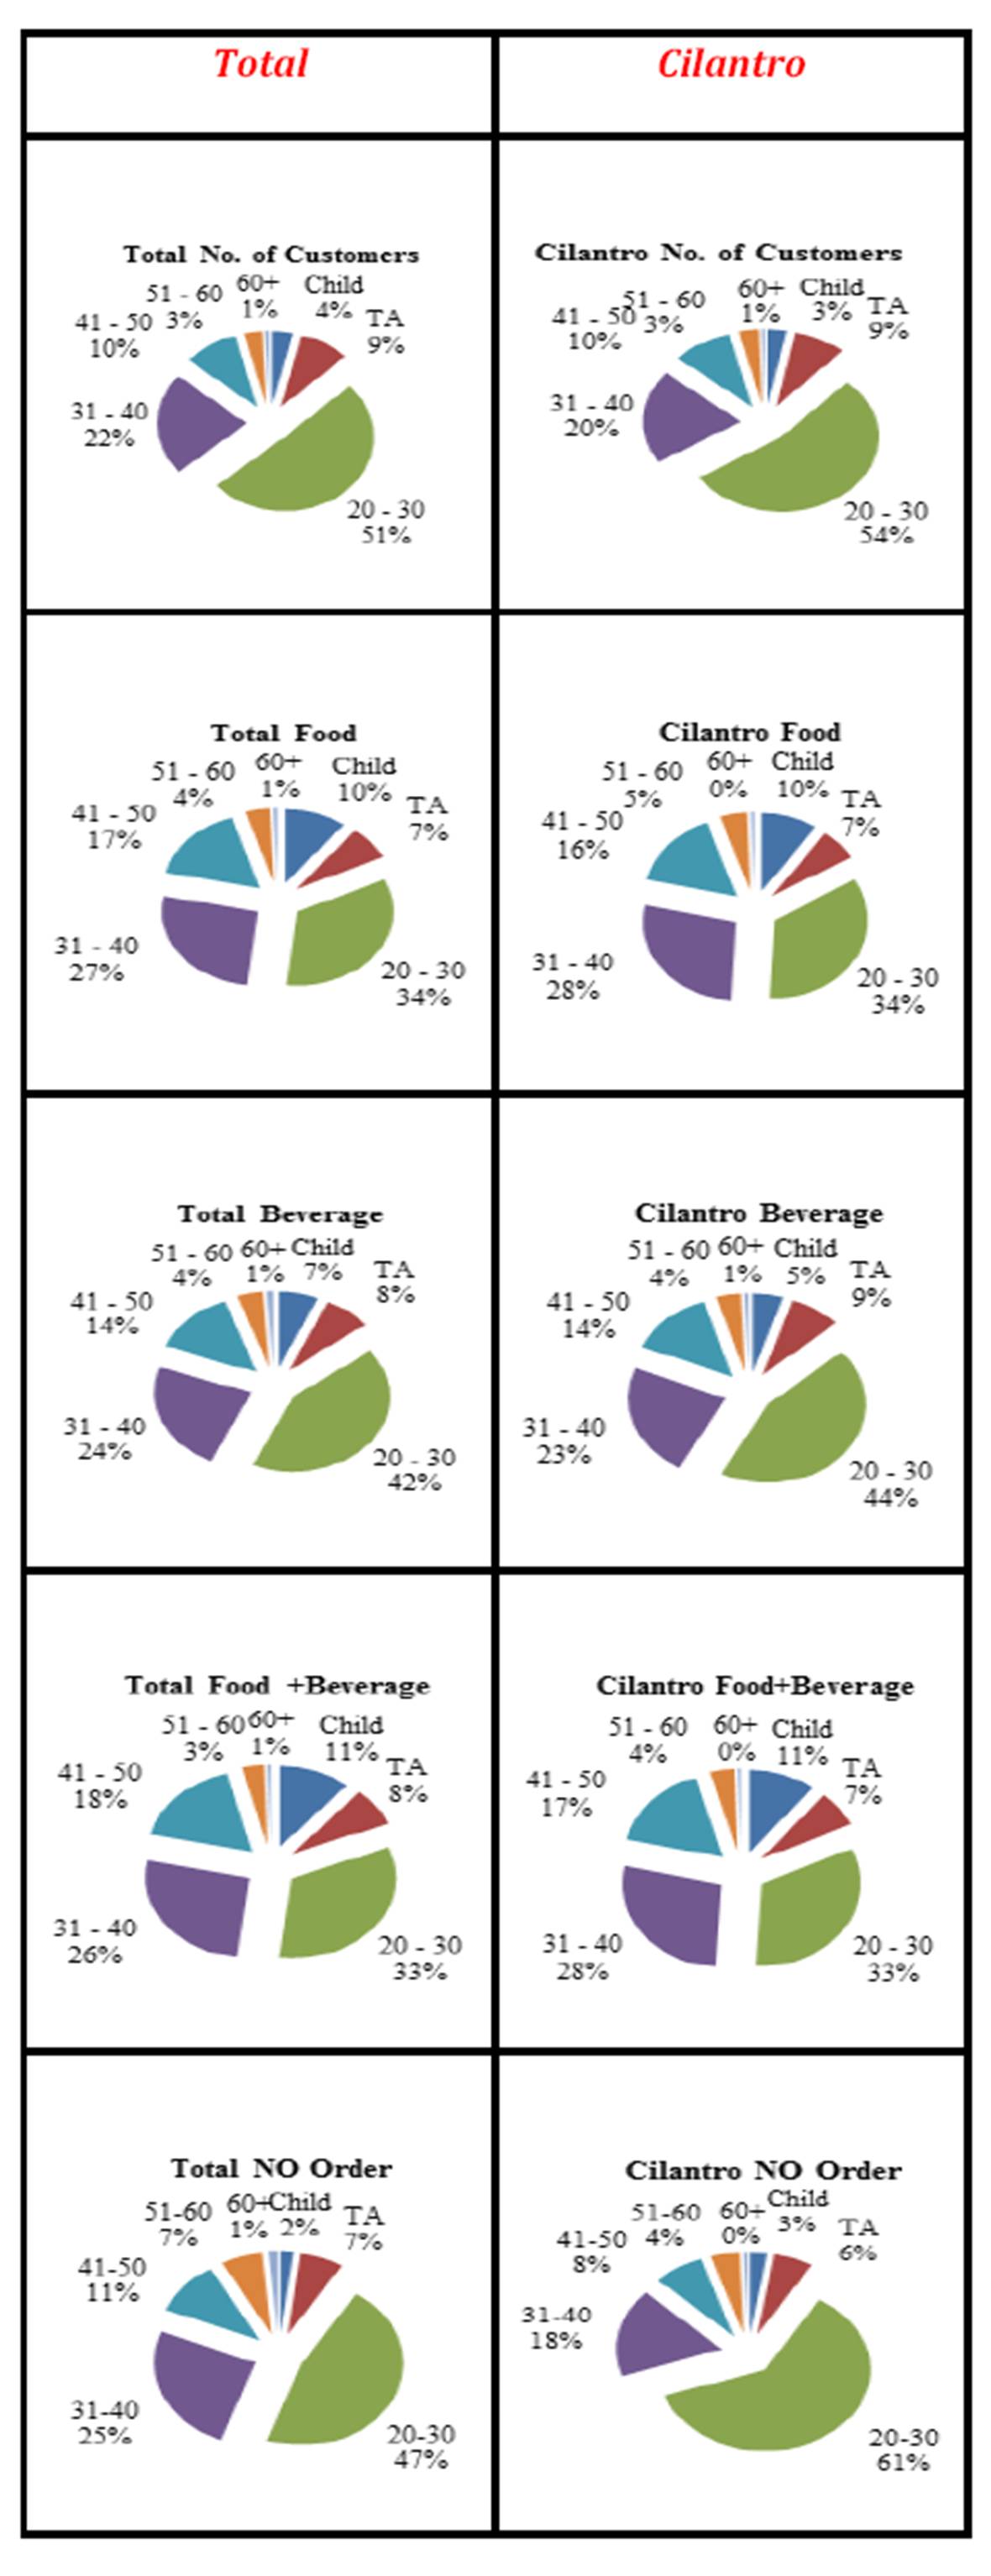
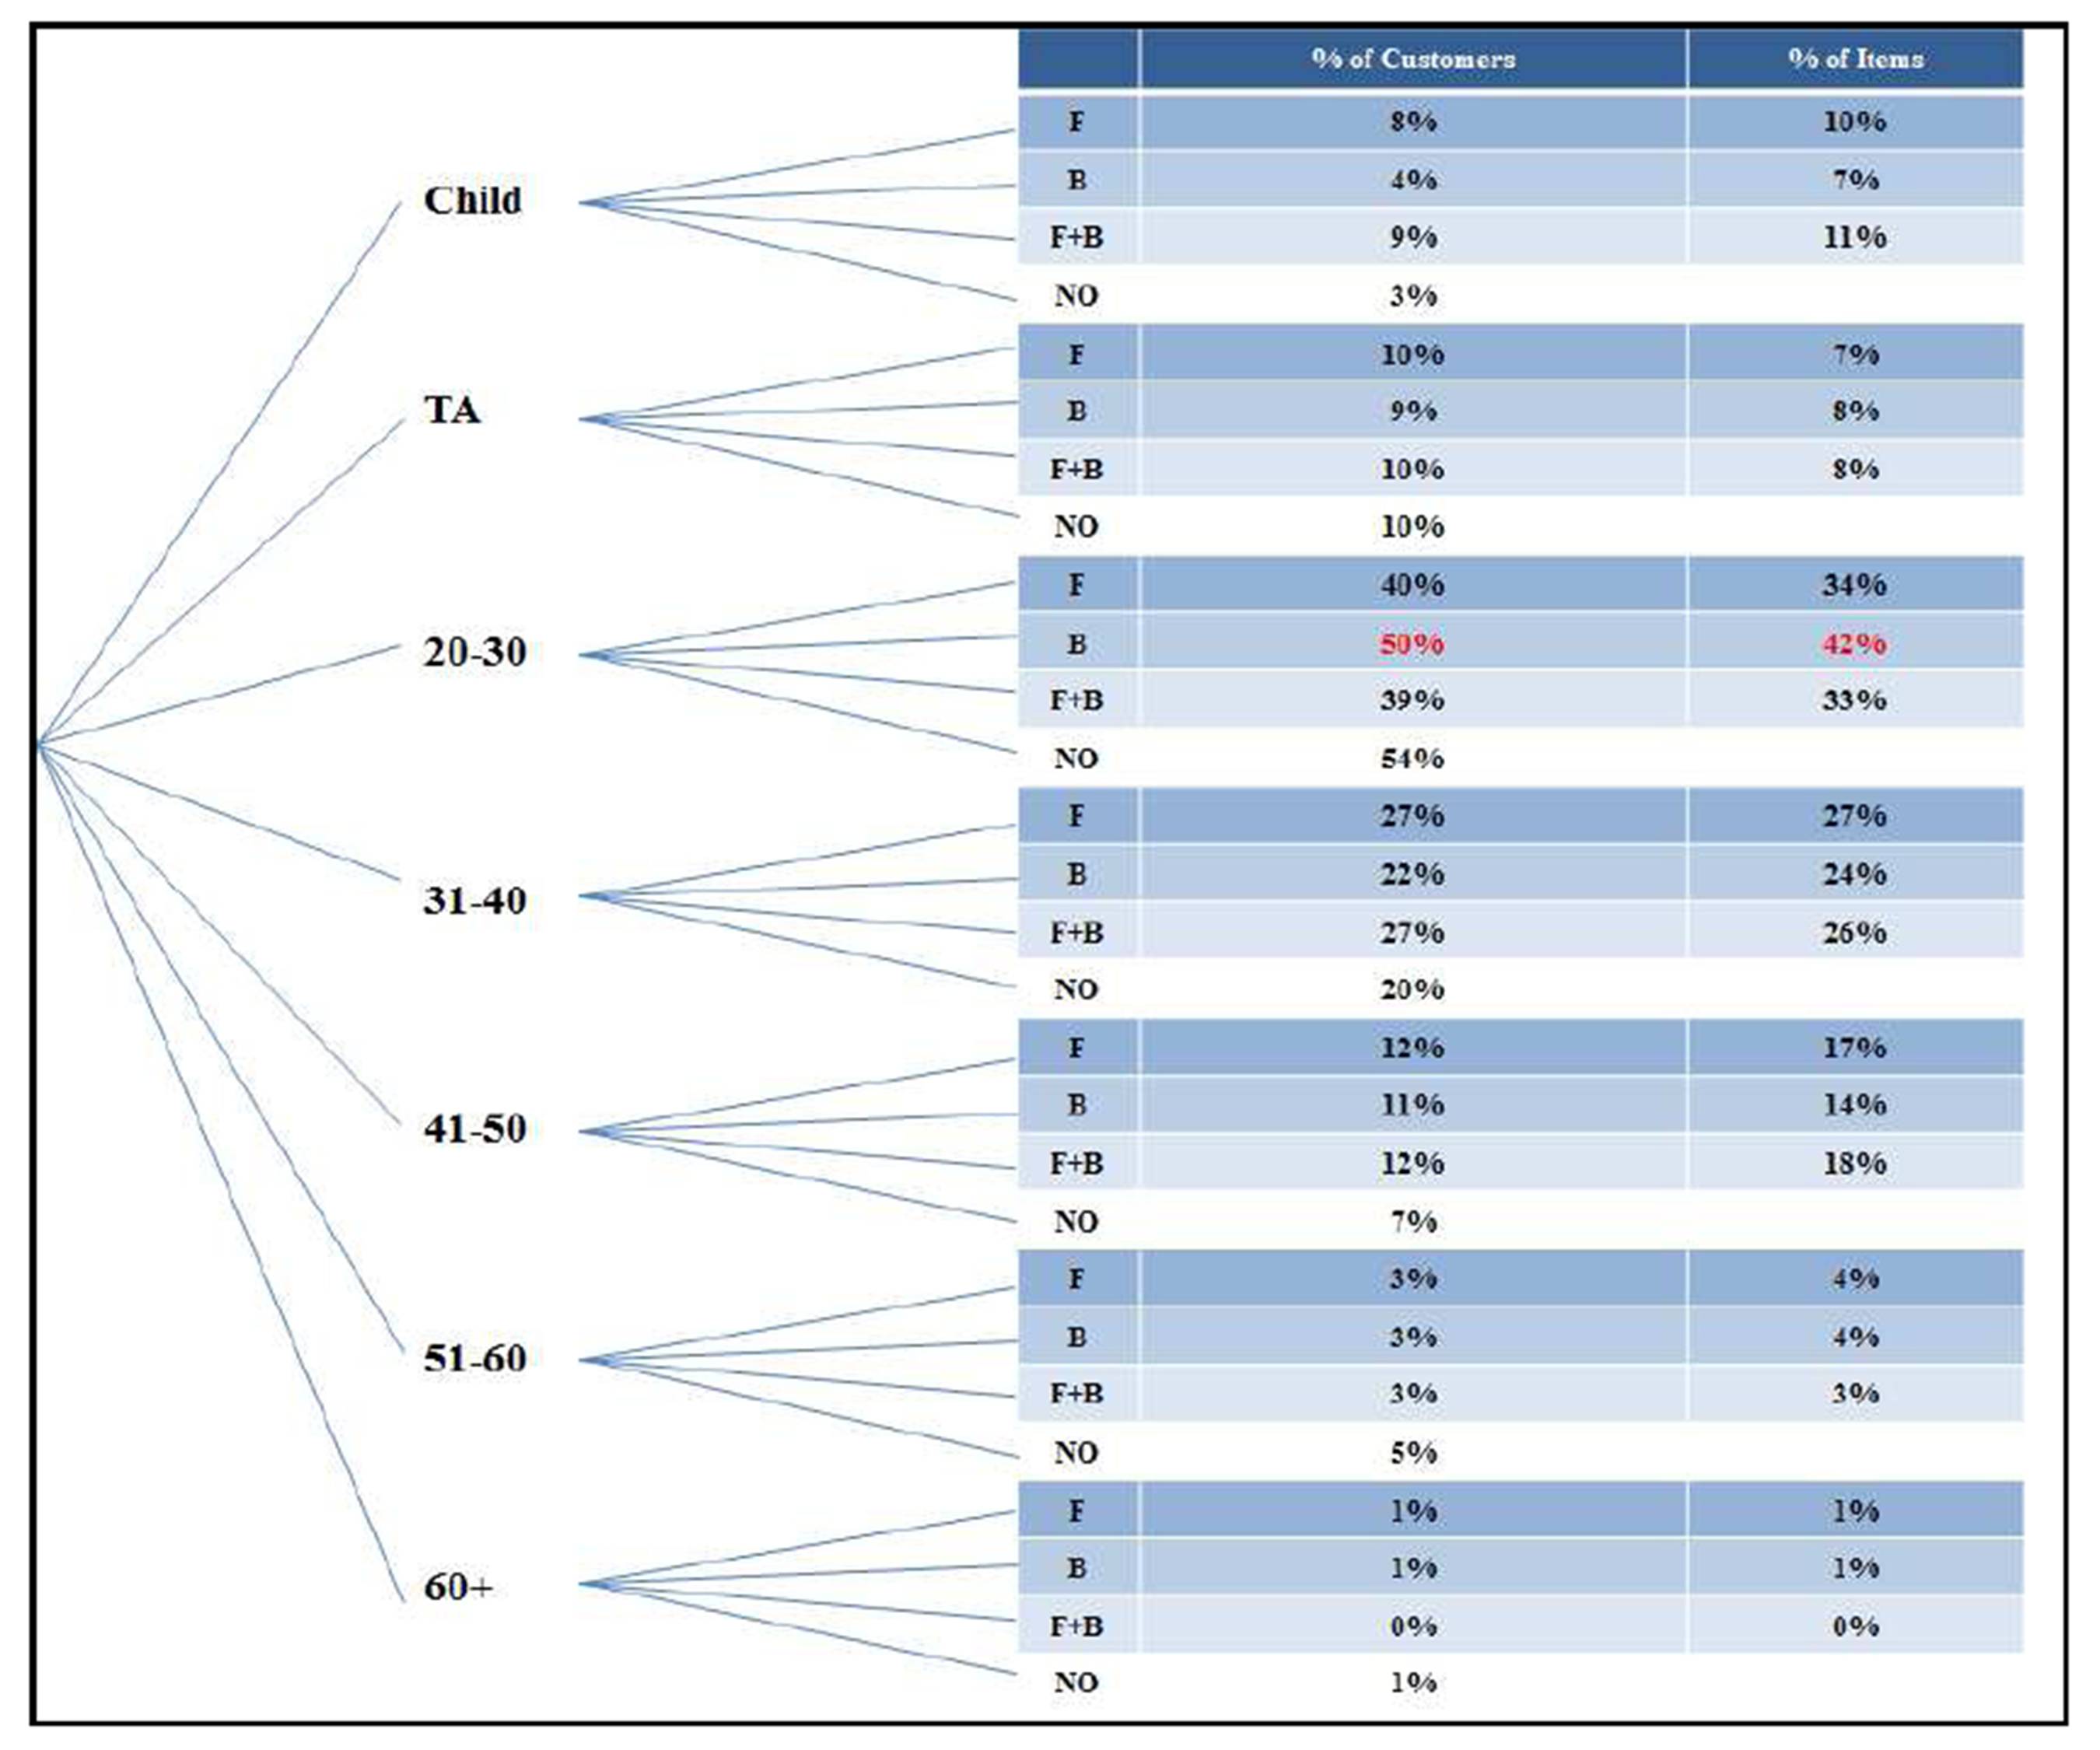
The customers watched are mostly in their 20s (20-30) making 51% of all customers; however, they account for only 41% of total sales. Similarly the teenagers (TAs) order a less percentage of food/beverage relative to their number. As can be seen from the following Exhibit, the teenagers (TAs) account for 9% of the total customers whereas they order only 8% of total sales of food/beverage. All other age groups order a percentage of food/beverage items more than their population count in that sample. For example the customers who are in their 30s (31-40) make 22% of all customers and order 24% of all food/beverage items.
Exhibit #3: Total Number of Customers Compared with the Total Number of Items Sold Analyzed by Age Group
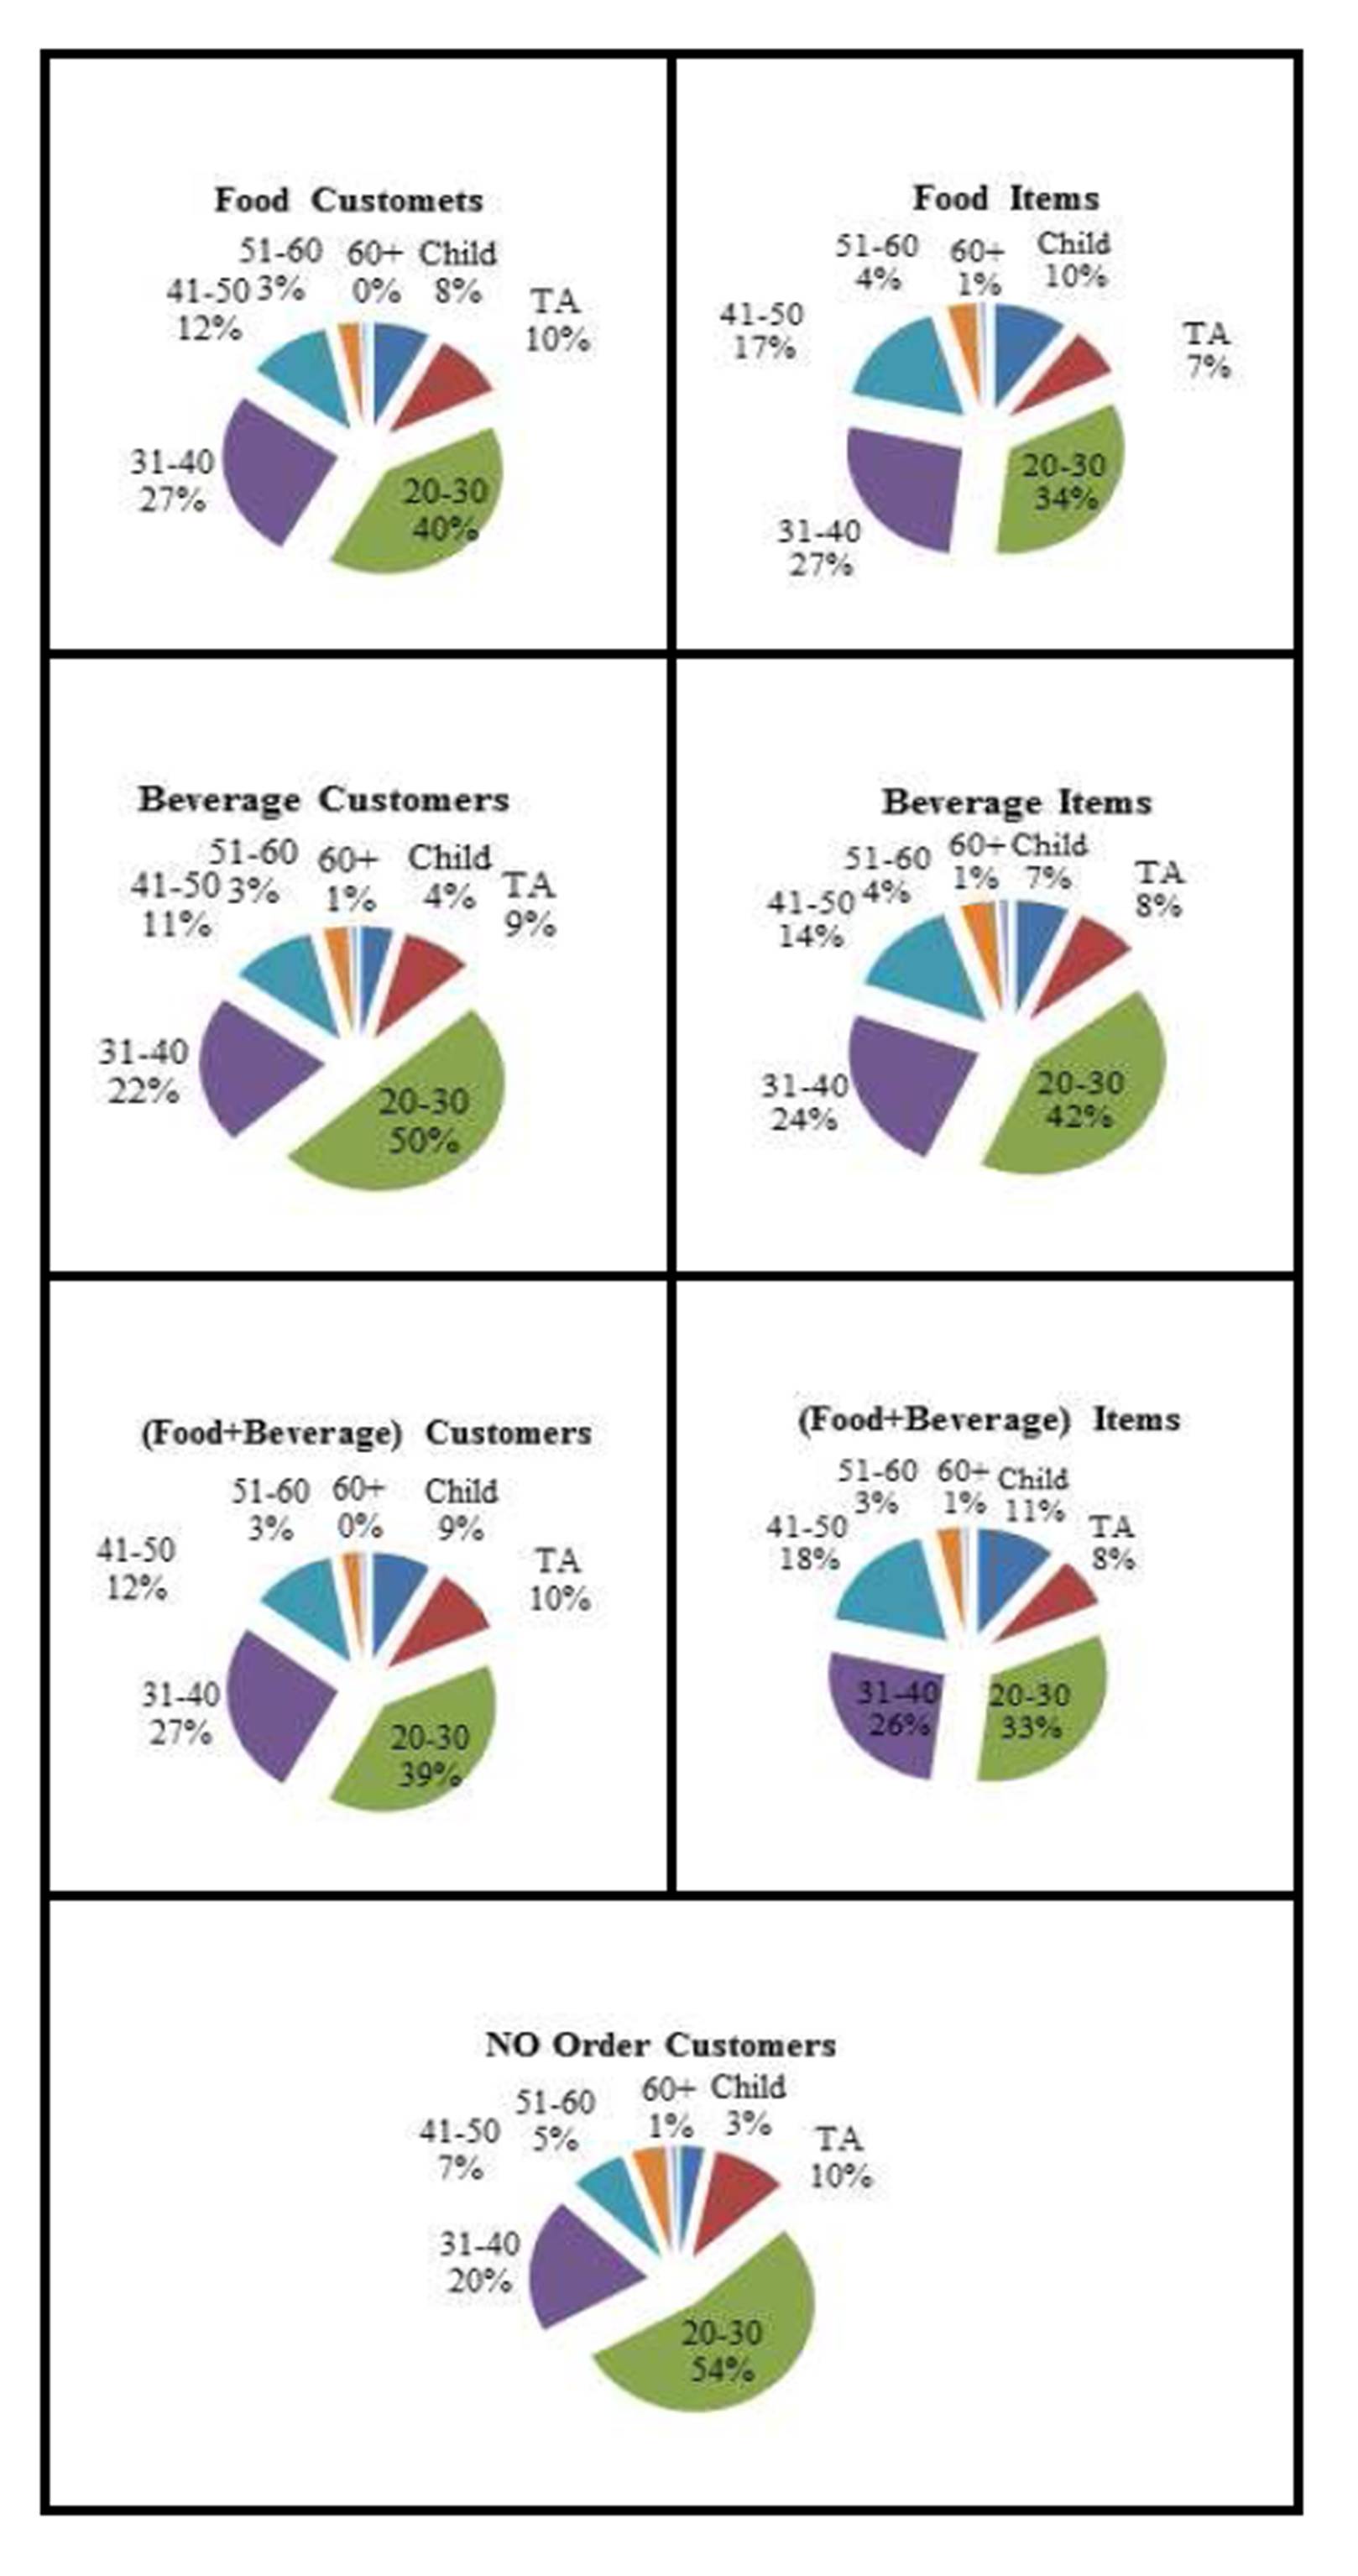
Exhibit #4 displays the distribution of customers per age group, but this time categorized by the type of order (left three – Food, Beverage, and Food + Beverage respectively) as well as the distribution of items ordered (right three). For example the top left pie chart shows the percent of Food customers per age group, the top right pie chart shows the percentage of Food items ordered/sold per age group, the second row on the left pie chart shows the percent of Beverage customers per age group, and on the right the pie chart shows the percent of Beverage items sold per age group; and so on. Note that the (20-30) year old customers are by far the largest (50% ordered Beverage and 54% did not order). Also note how the Food customers’ percentage per age group is almost identical to the (Food + Beverage) customers. Probably this is because the Food + Beverage customers are the dominating number where hardly any Food items are being sold alone (as was displayed in Exhibit #2).
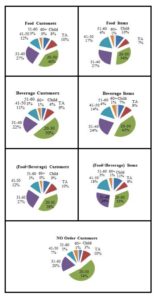
Exhibit #4: Number of Customers (left)/ Number of Items Sold (right) as Distributed by Age
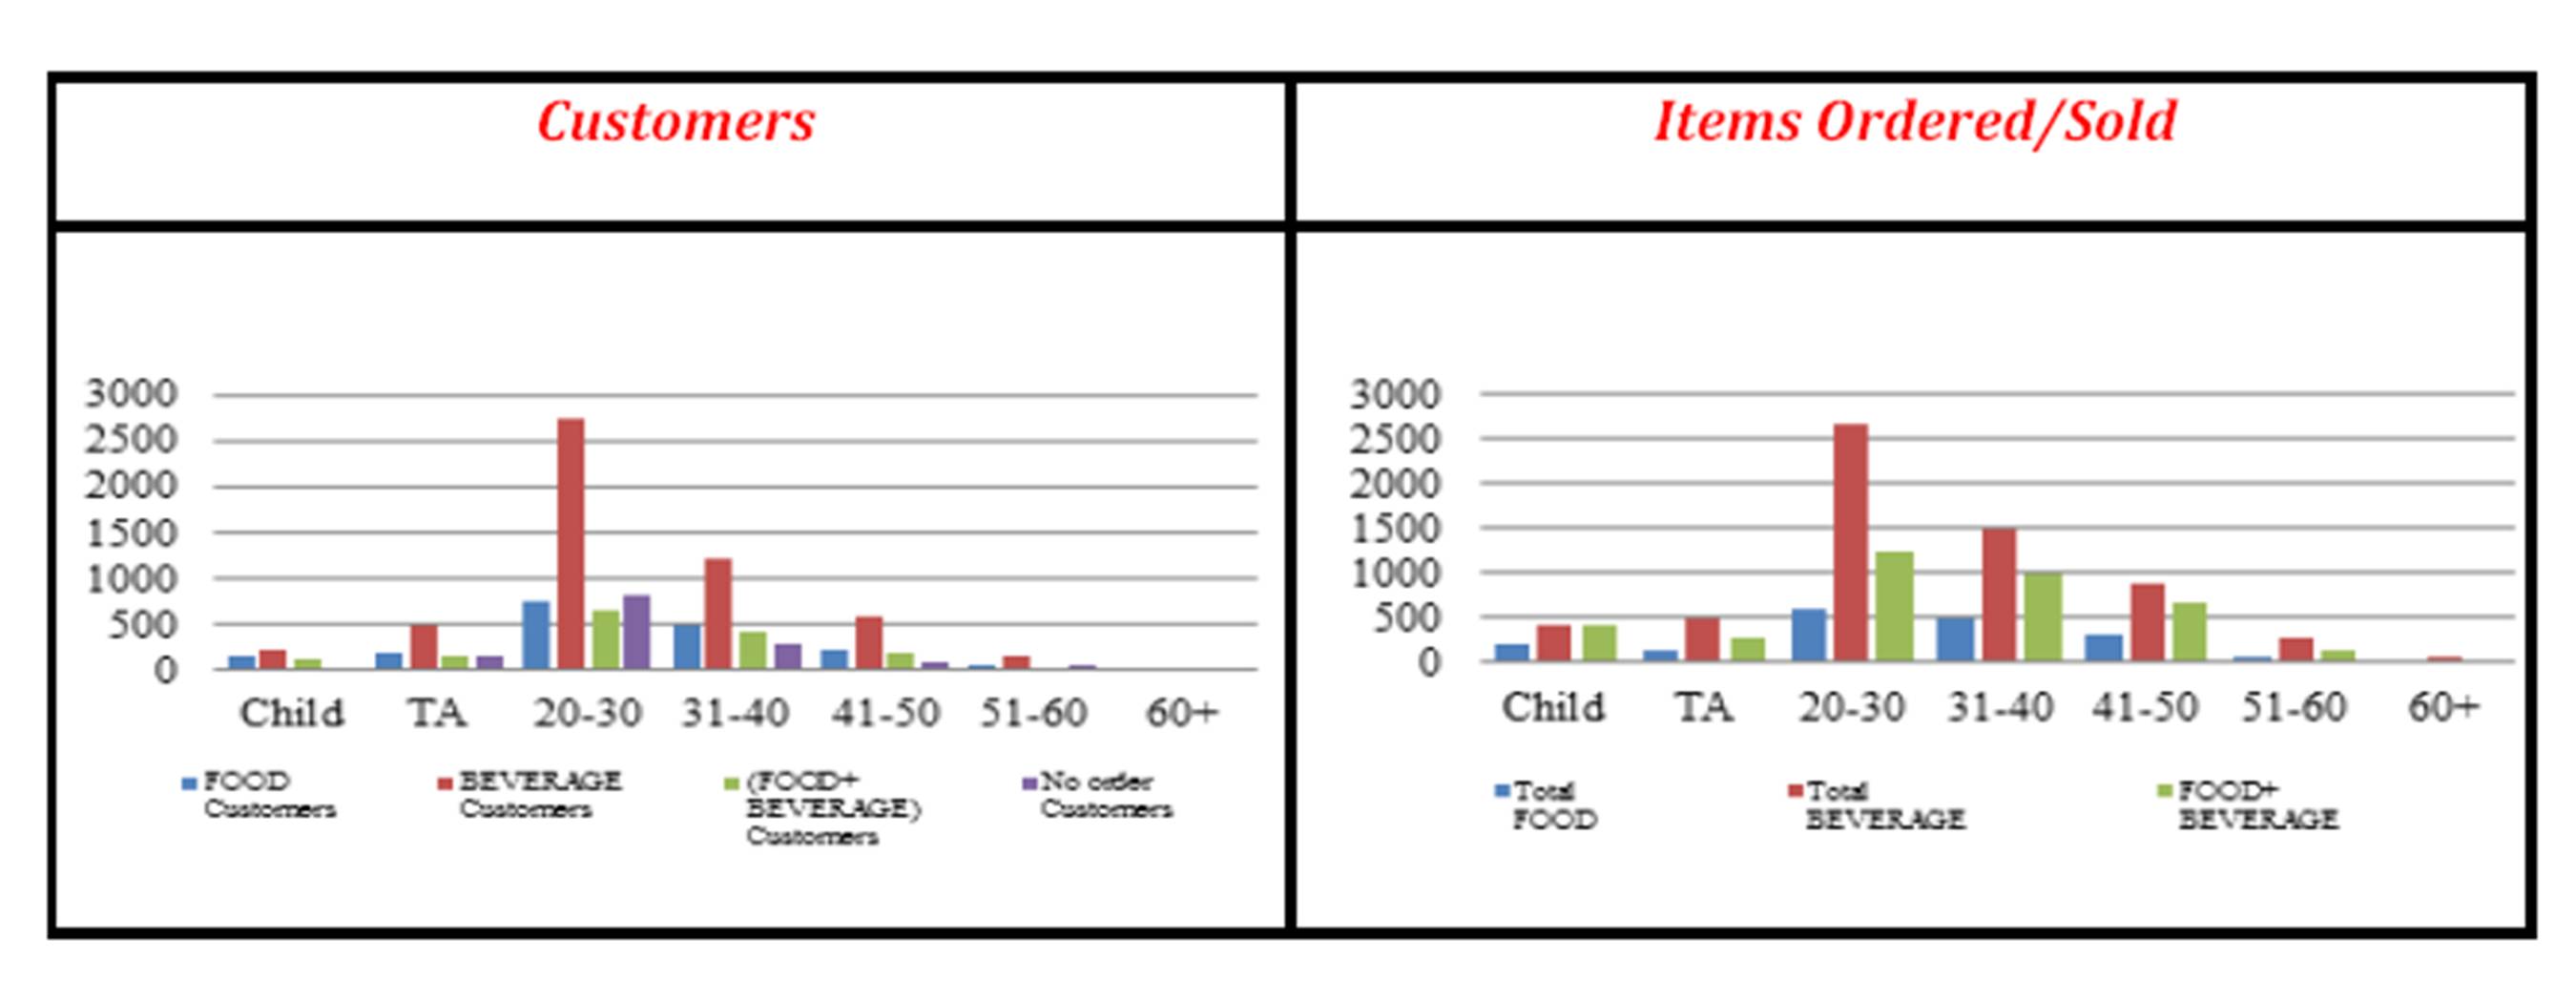
The following Exhibit displays the number of customers (left) versus the number of items sold (right) as distributed by age (this time as a total). Note again how the (20-30) age group has the largest number of customers as well as the largest number of orders (also the largest number of “no order”).
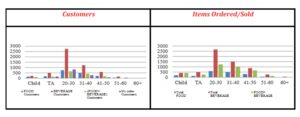 Exhibit #5: Number of Customers (left)/ Number of Items Sold (right) as Distributed by Age
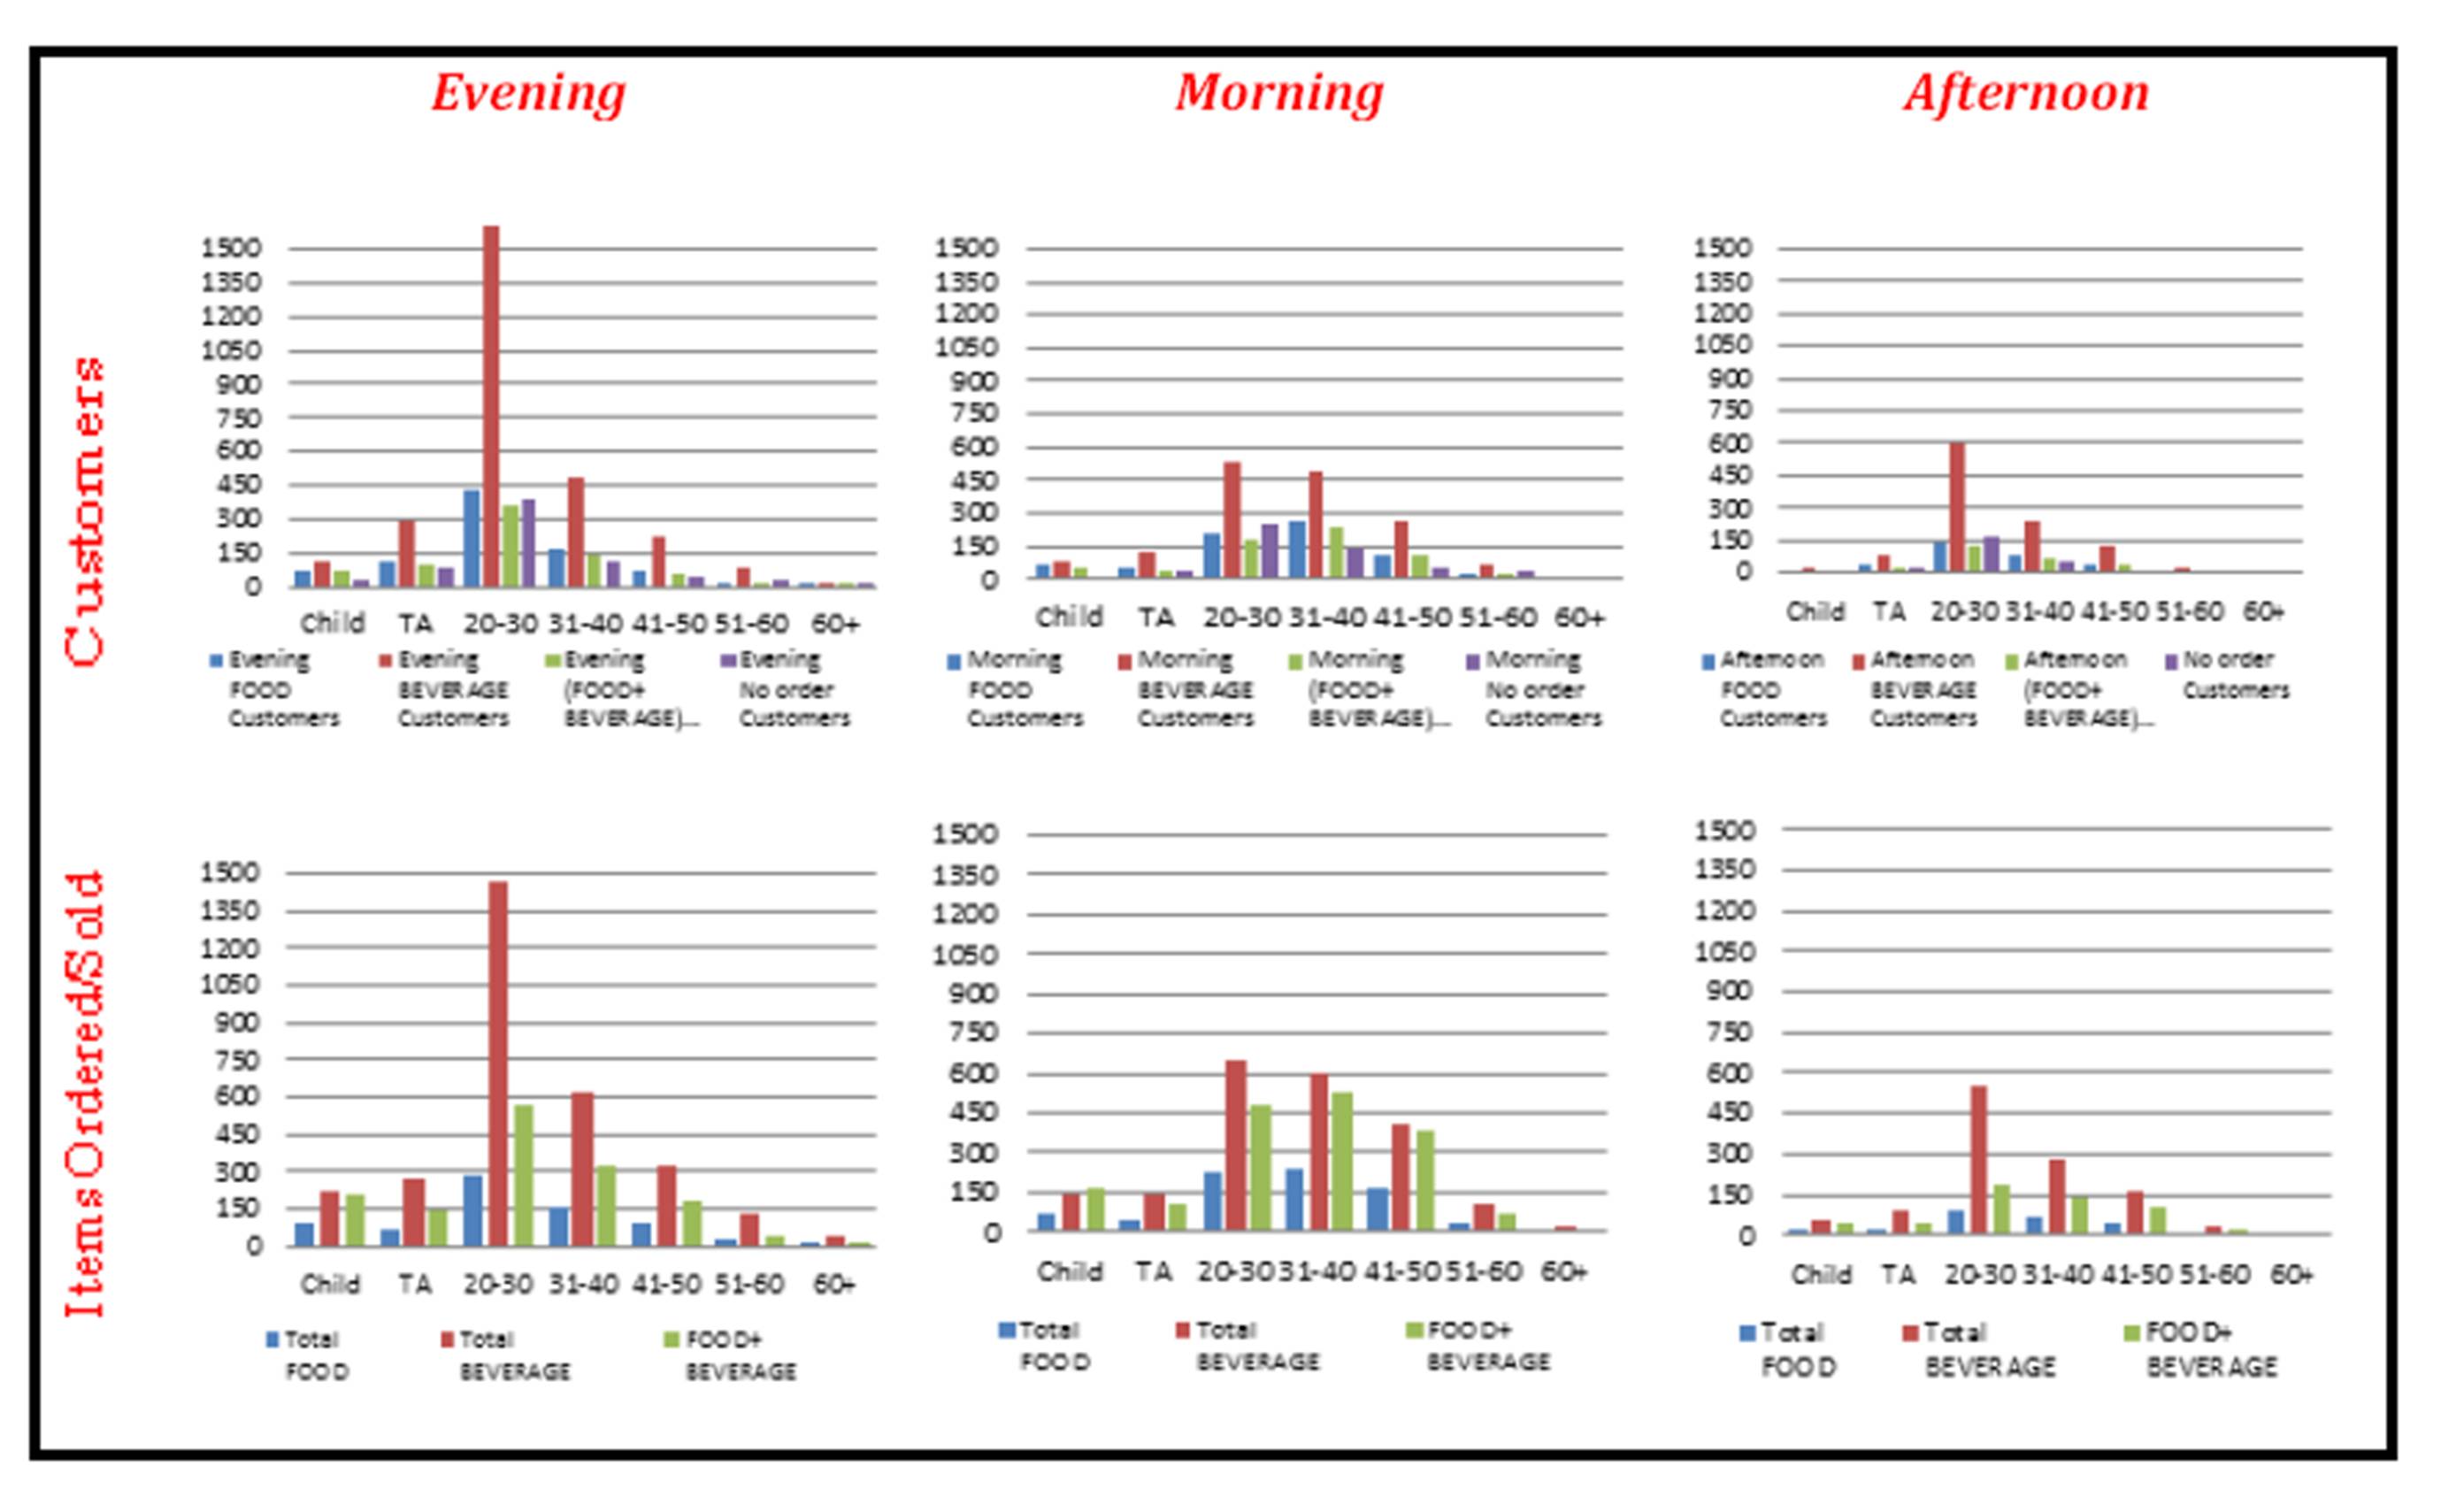
Exhibit #6 displays the number of customers as distributed by age group, but this time as categorized per shift. The left of the Exhibit shows that distribution during the evening shift and the middle during the morning shift while the right is during the afternoon shift. Interestingly, the (20-30) year old customers are always the largest number regardless of the shift (Exhibit #5). However, during the evening shift they are obviously much larger than the other age groups whereas during the morning shift, the (30-40) age group is almost as large. The bottom part of the Exhibit displays the data in terms of the number of items ordered/sold again as distributed by age group per each shift. All Exhibits are displayed next to each other for easy comparison; for example we can say that the evening customers’ orders are proportional to their size (top left & bottom left), whereas the afternoon customers order more items relative to their size (top right & bottom right).
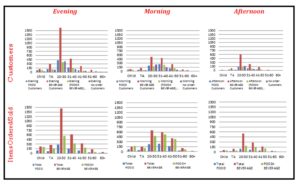 Exhibit #6: Evening, Morning, Afternoon Number of Customers (top)/ Evening, Morning, Afternoon Number of Items Ordered/Sold (bottom) as Distributed by Age
Case Description
Classification is one type of information that could be obtained from data-mining to help decision makers make predictions and forecasts as well as devise campaigns and promotions (Laudon, 2009). There are two ways of analyzing the data of the number of customers who came and the number of items sold. One way is to look at it with respect to the day of the week (Wednesday/ Thursday/ Friday), and the other is from the perspective of the time of the shift (evening/ morning/ afternoon).
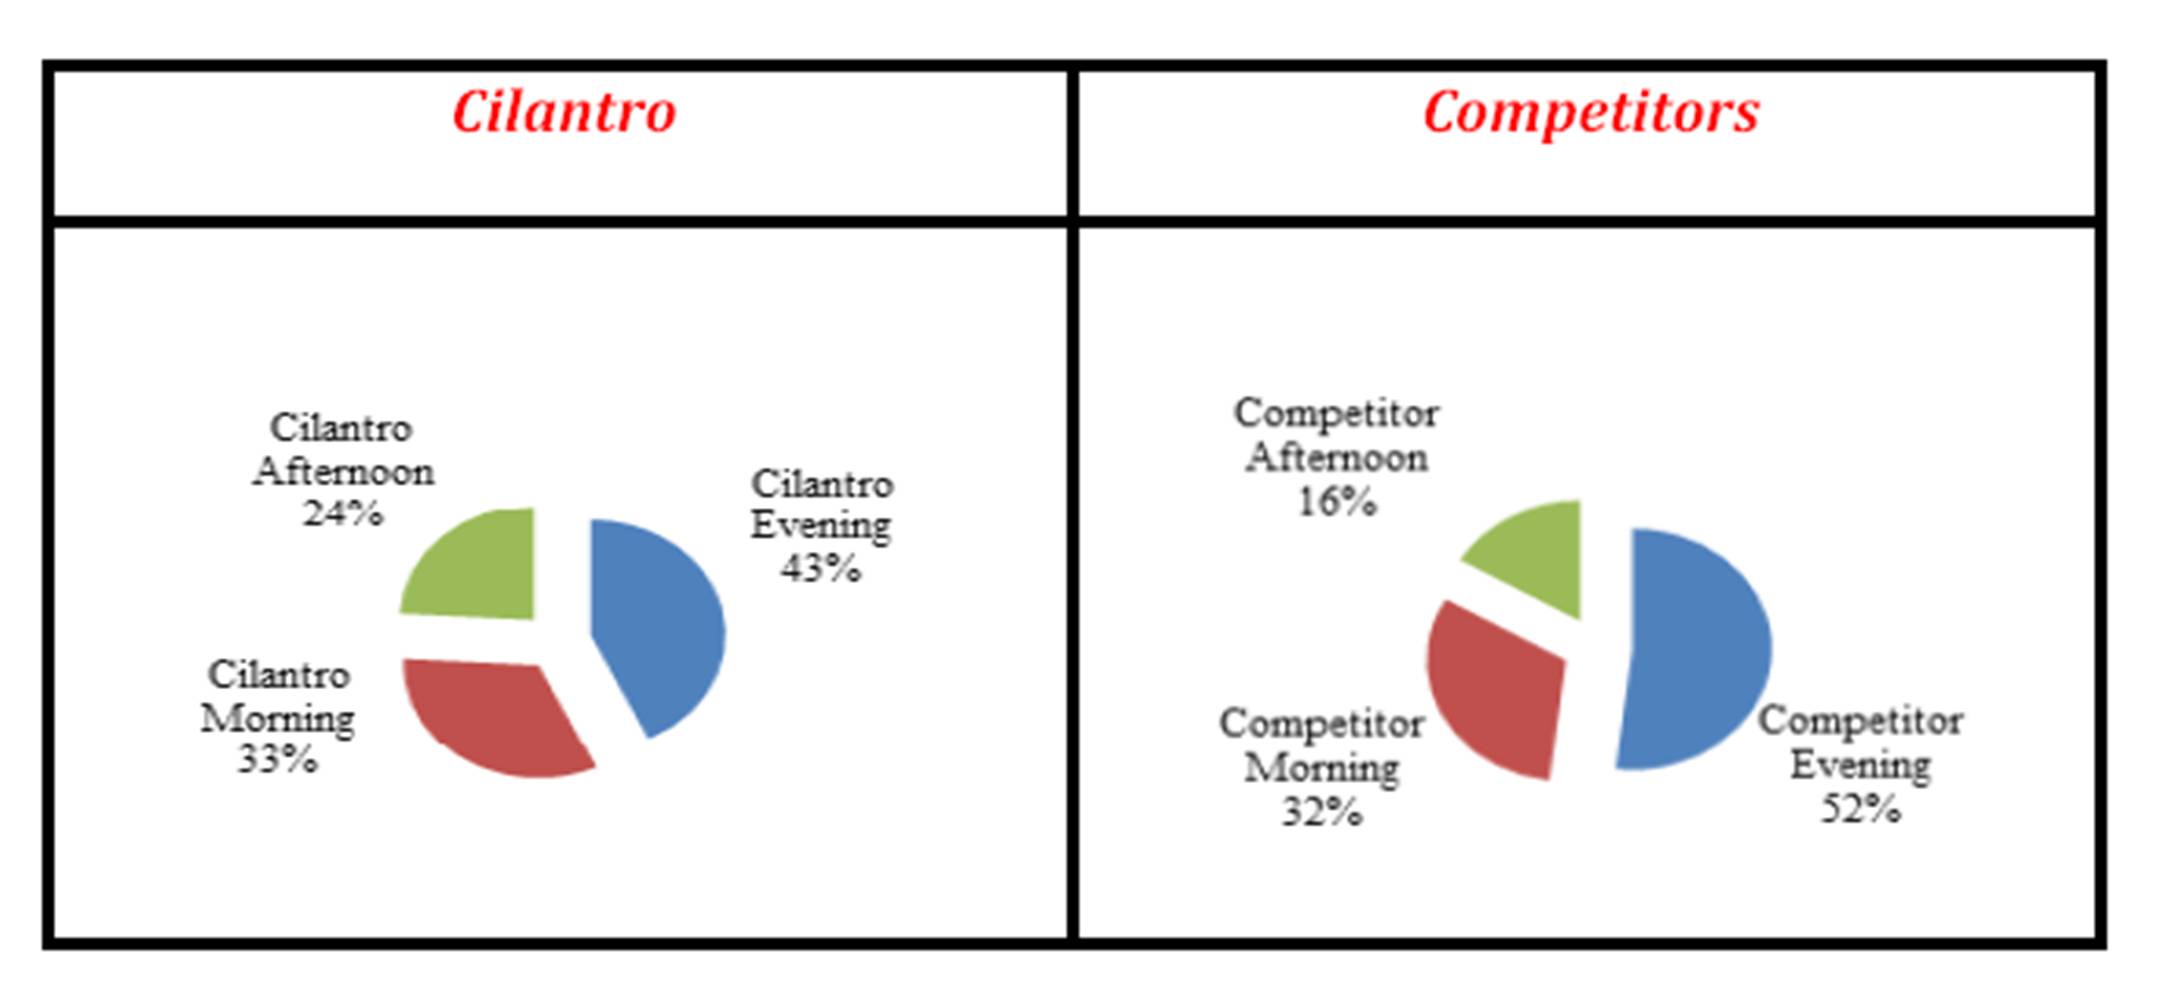
The following Exhibit shows how the Afternoon Cilantro customers are larger than its competitors. This is only a relative thing; the real large portion of customers is during the Evening shift.
Exhibit #7: Total Number of Cilantro Customers Compared with the Total Number of the Customers of the Competitors as Analyzed by the Different Shifts
It should be noted, however, that relatively speaking, the Cilantro Evening shift is almost 82% of its competitors. Since the Evening shift constitute almost half of all the customers watched, it is important to try to make an attempt to attract more Evening shift customers with the Evening shift demand being so promising and the total Evening shift customers being so numerous (as long as the size of the coffee shop can accommodate more customers).
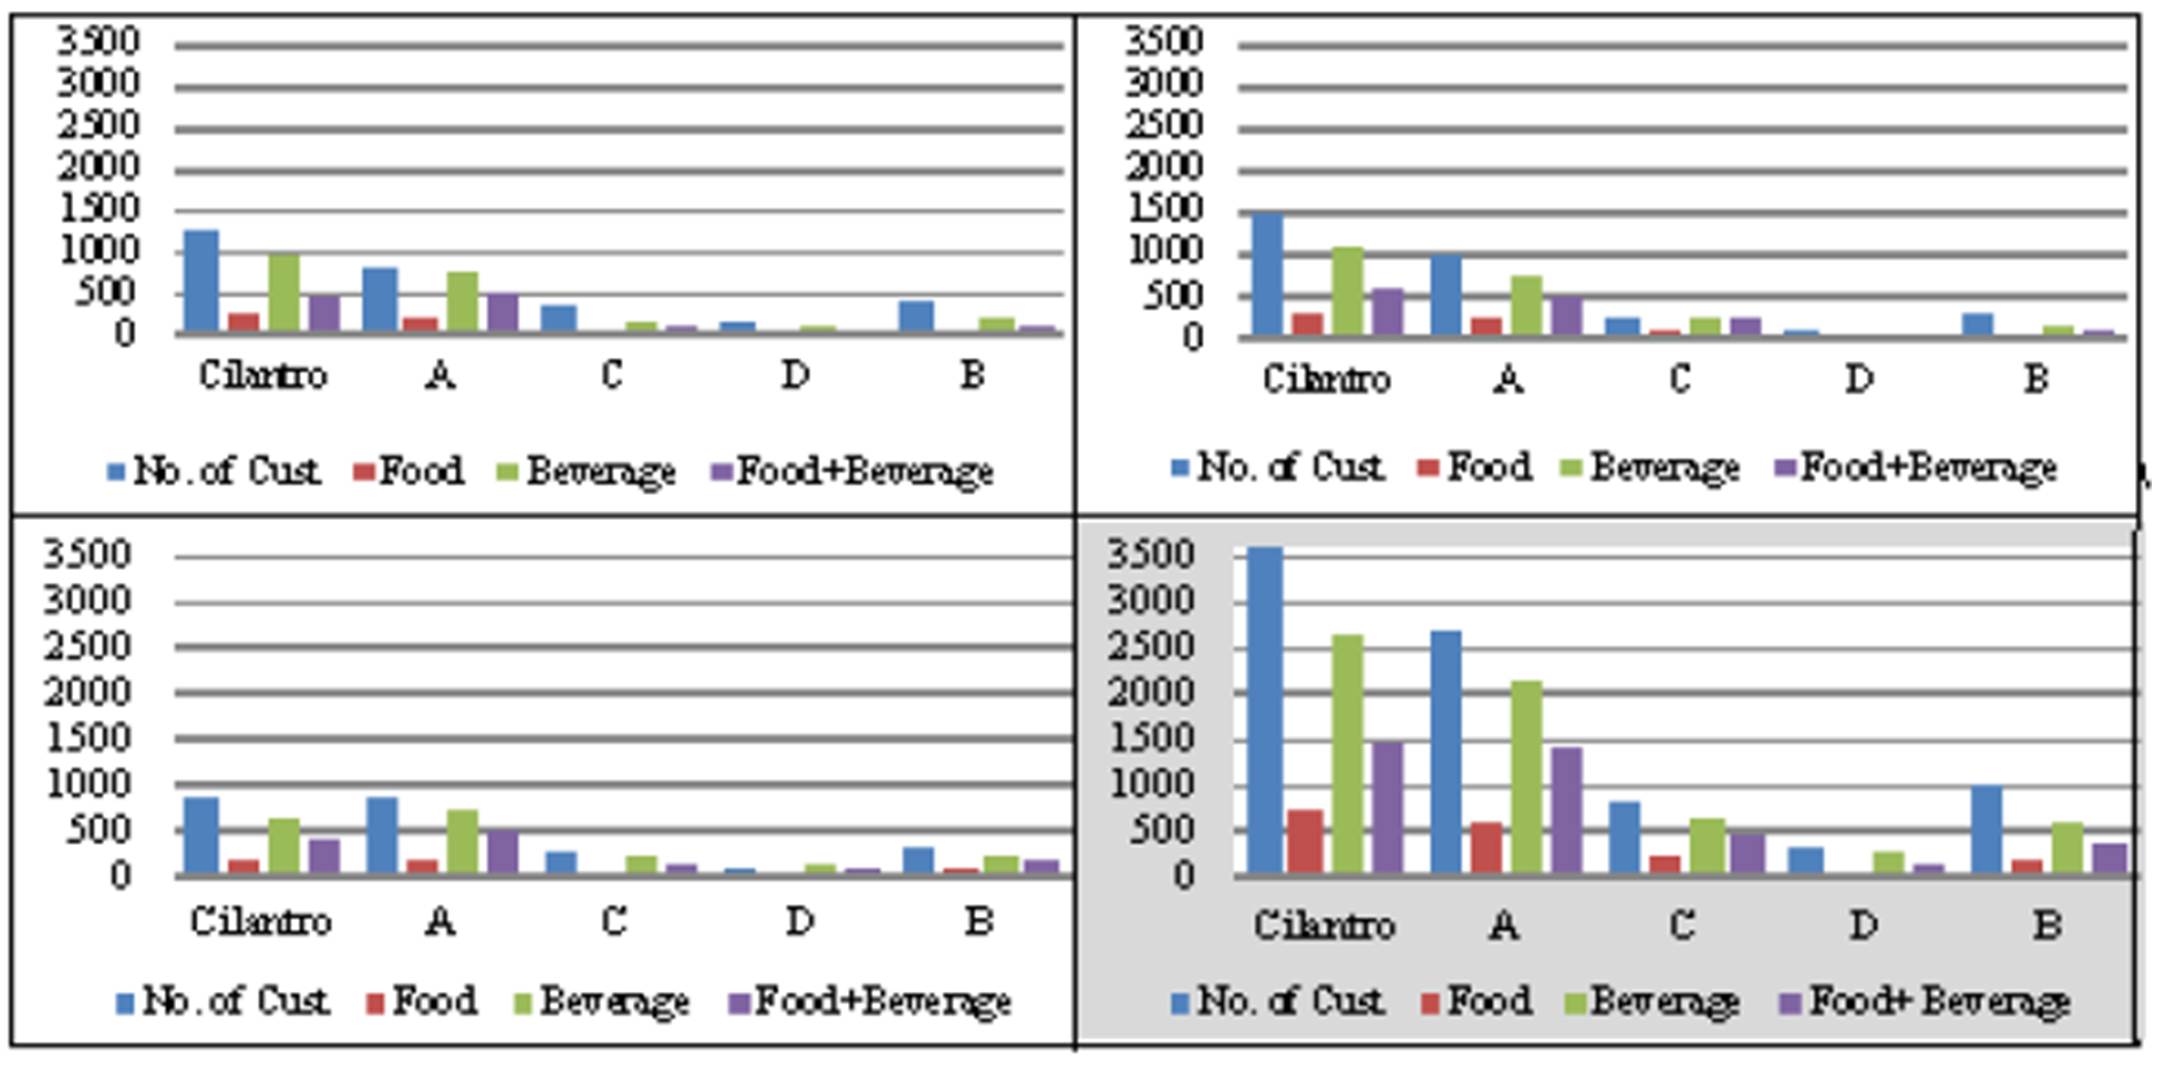
When comparing Cilantro’s customers/items sold to all its competitors as distributed by the time of the shift, we see that the Evening shift has the largest number of customers for Cilantro as well as Competitor A and Competitor C. The same goes for the number of Beverage items sold where the Evening shift has the biggest amount of Beverage items sold for Cilantro as well as Competitor A and Competitor C. However, when focusing on the Food/ (Food + Beverage) items sold, we see the Morning shift is doing very well relative to the other two shifts. The Afternoon shift is relatively the weakest of all with the smallest number of customers and the minimal number of items sold. Again the total of the three shifts is displayed in the lower right part of the Exhibit as a benchmark.
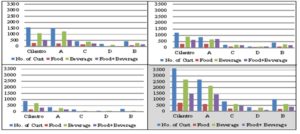
Exhibit #8: Evenings (top left) versus Mornings (top right) versus Afternoon (bottom left) Number of Customers Along with Number of Items Sold at Cilantro as Compared to Its Competitors (bottom right has the total of all shifts)
Exhibit #9 displays the information in terms of the day of the week for a quick and easy comparison between the different coffee shops. For Cilantro and its major competitor (competitor A), the number of customers as well as the number of items sold is the largest on Thursday. For the other competitors, the Wednesday number of customers and number of items sold is the largest. The total of the three days is displayed in the lower right part of the Exhibit as a benchmark.
Exhibit #9: Wednesdays (top left) versus Thursdays (top right) versus Fridays (bottom left) Number of Customers Along with Number of Items Sold at Cilantro as Compared to Its Competitors (note that the bottom right has the total of all shifts)
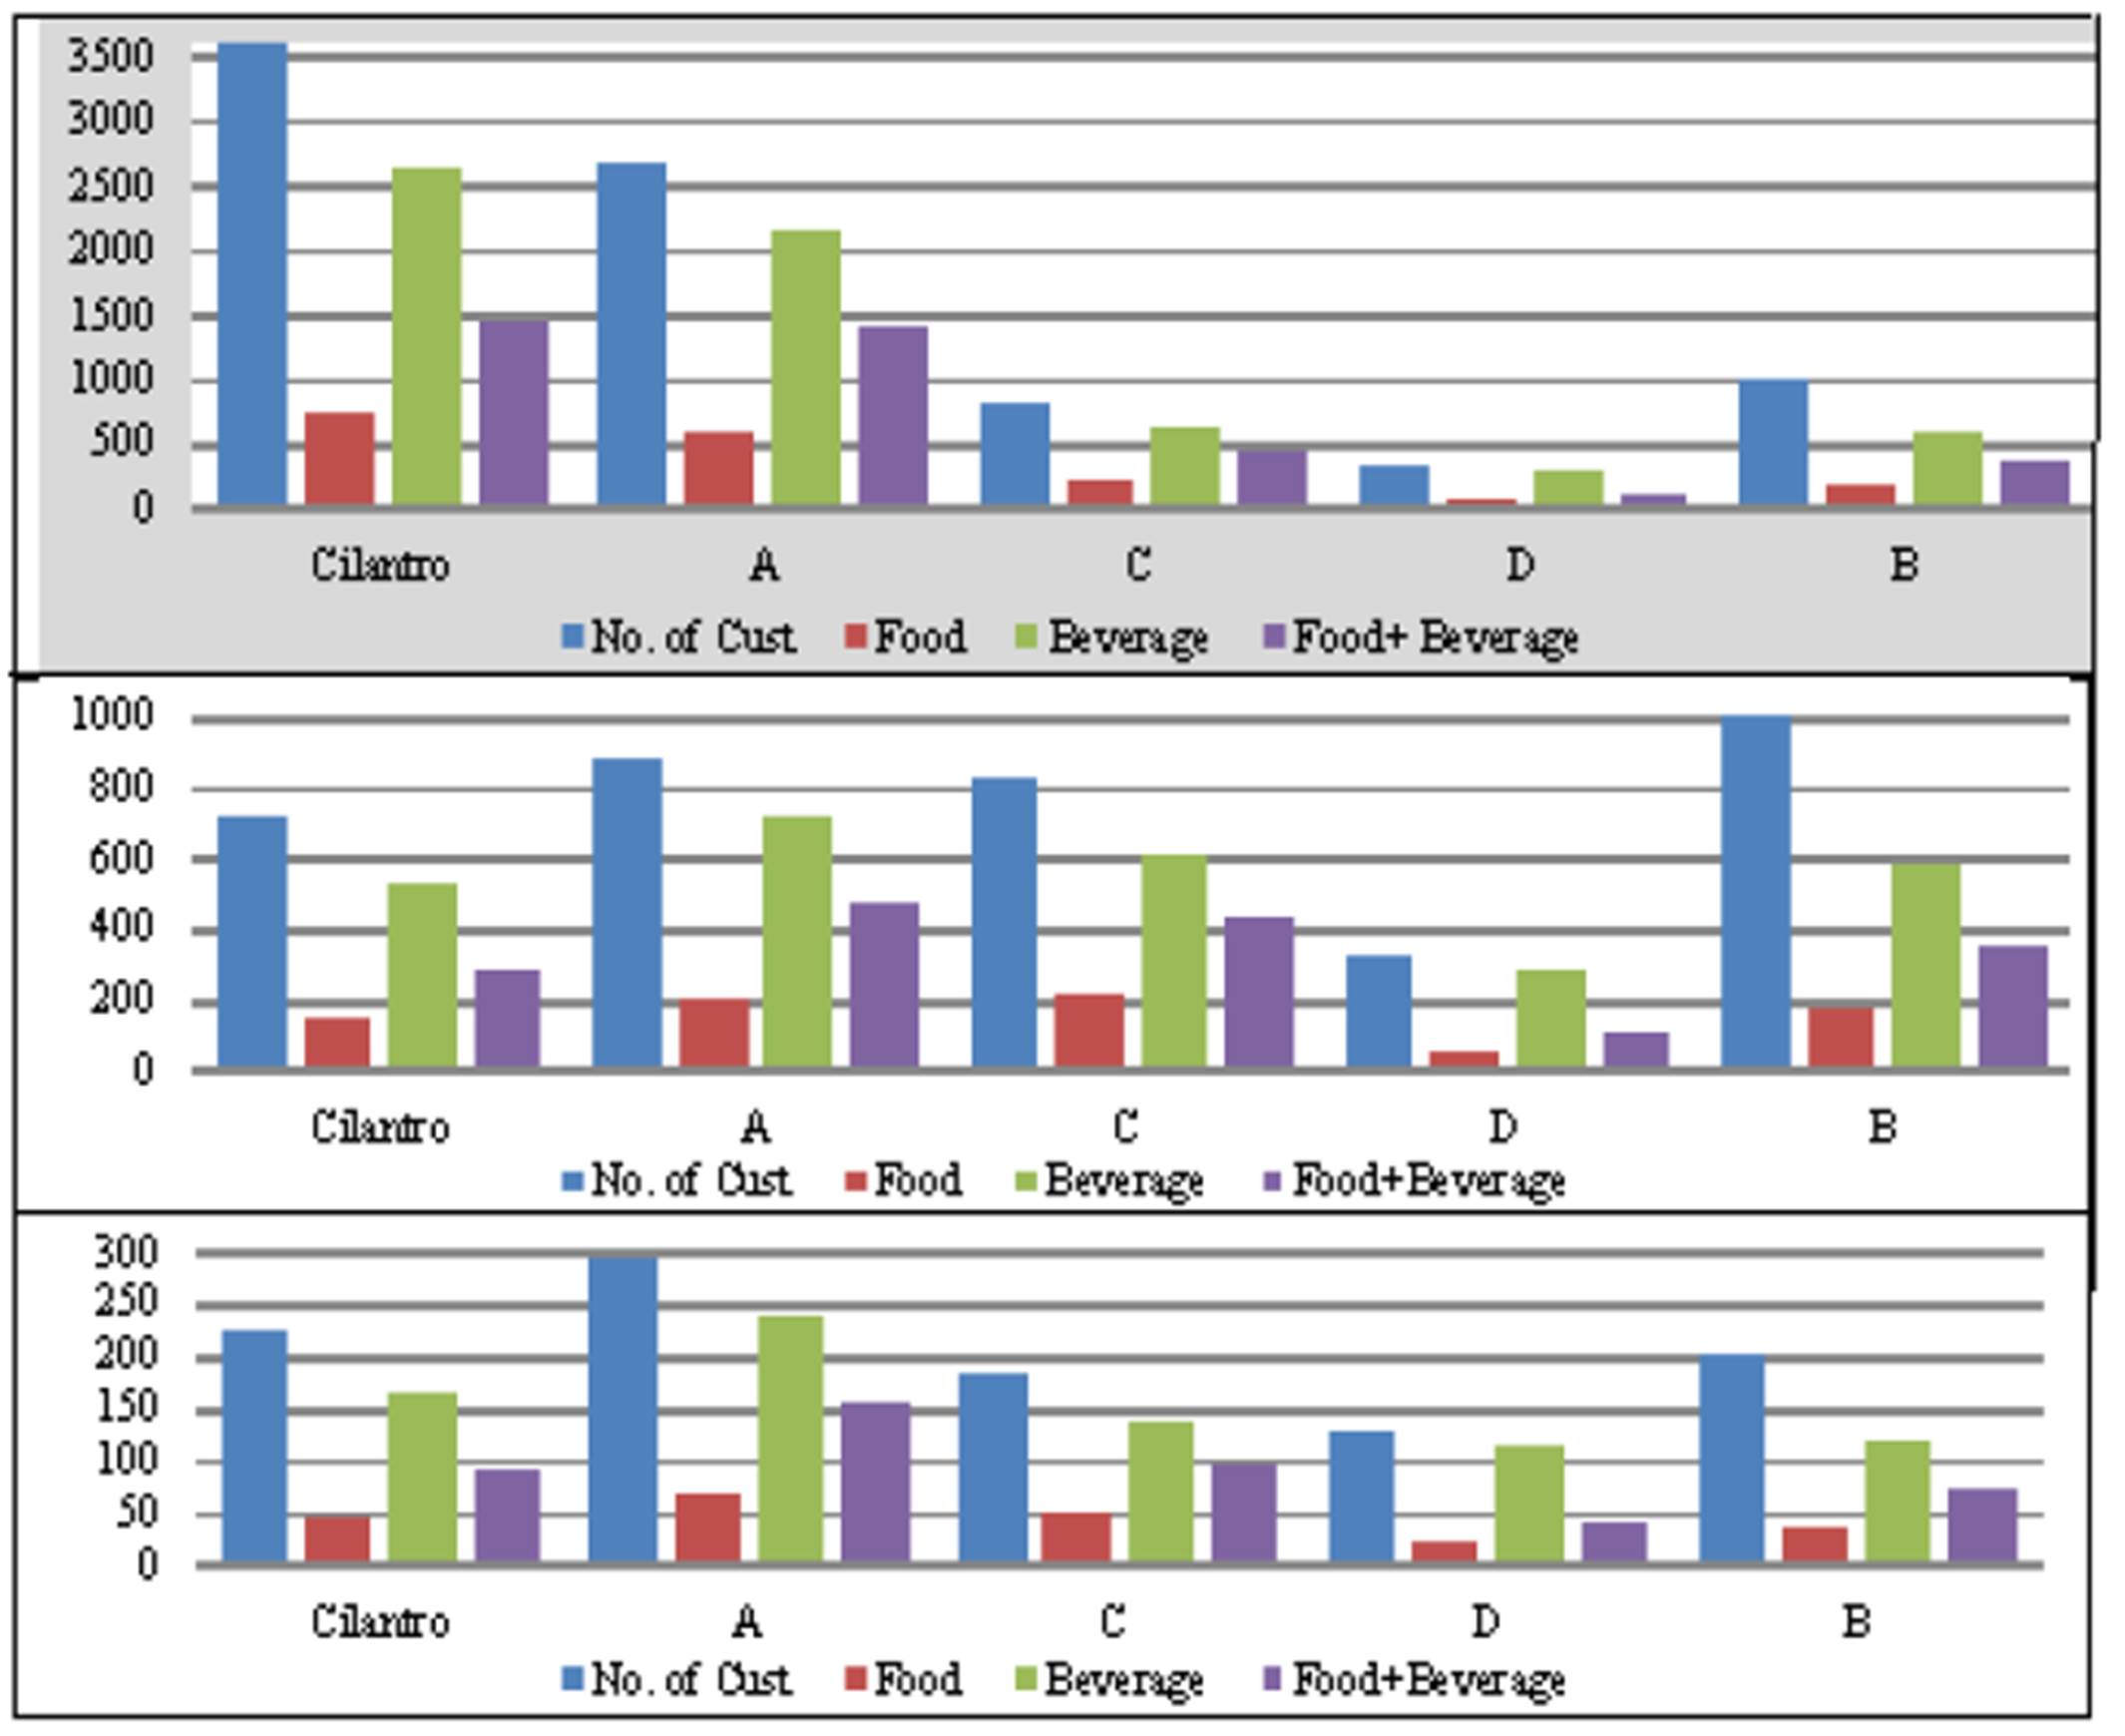
When focusing on the total regardless of the day of the week and regardless of the time of the shift, we can easily spot a major difference between Cilantro and its competitors where Cilantro has the largest number of customers watched as well as the largest number of items sold (see Exhibit #10 at the top). Although Cilantro has the biggest number of stores in the country, analyzing this data in that way could be misleading at times. Another way to look at it is by analyzing the data relative to the number of stores that were being studied (Exhibit #10 in the middle). Here Cilantro has five stores being studied and Competitor A has three stores being studied with only one store for all other competitors For example having a total of 100 customers in the three stores put together is better than having 100 customers in the five stores put together. Further analysis gives more insight to the meaning of all this. The bottom part of Exhibit #10 displays the result of analyzing the same data, but this time relative to the size of the store. Here the size is also an important factor since if say Cilantro has 100 customers in a store that can accommodate only 100 is better than a competitor having only 100 customers in a store that could accommodate 200. Cilantro Korba, for example, is doing very well but when looking at totals only we found out that one of its competitors is superficially doing better only because it has a bigger sized store and therefore could accommodate more customers.
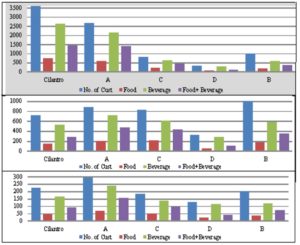
Exhibit #10: Total Number of Customers Along with Number of Items Sold at Cilantro as Compared to Its Competitors (top) Number of Customers Along with Number of Items Sold Relative to the Number of Coffee Shops at Cilantro (5) as Compared to Competitor A (3), Competitor B (1), Competitor C (1), and Competitor D (1) (middle) Number of Customers Along with Number of Items Sold Relative to the Size of the Coffee Shops at Cilantro (16) as Compared to Competitor A (9), Competitor B (4.5), Competitor C (2.5), and Competitor D (5) (bottom)
The following Exhibit displays the same information about all the coffee shops combined and compared against Cilantro but this time as differentiated by age group. When looking at the first row it is easy to note how the number of customers who are in their twenties who were watched at Cilantro (54%) is more than the total watched (51%). On the other hand, when focusing on the last row it is easy to detect that Cilantro has 61% of its customers who are in their twenties with “NO order” (something that Cilantro top management did not discourage).
Exhibit# 11: Number of Customers, Food Items, Beverage Items and Food+ Beverage Items Sold
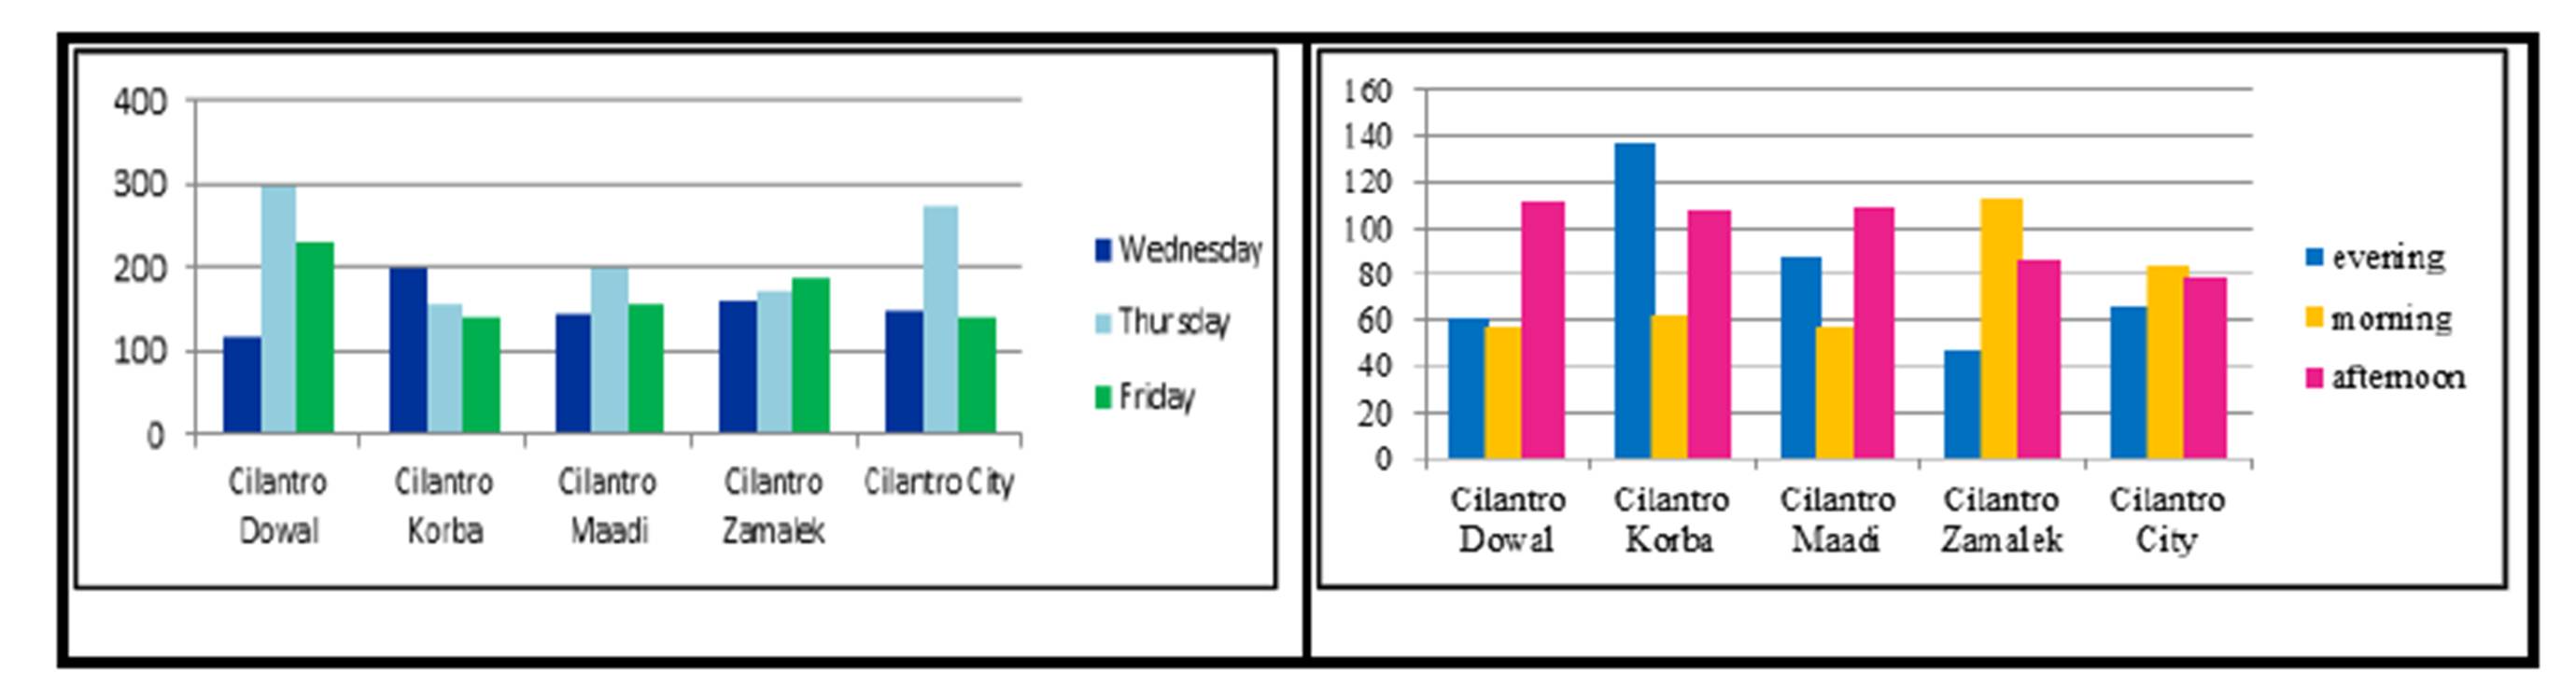
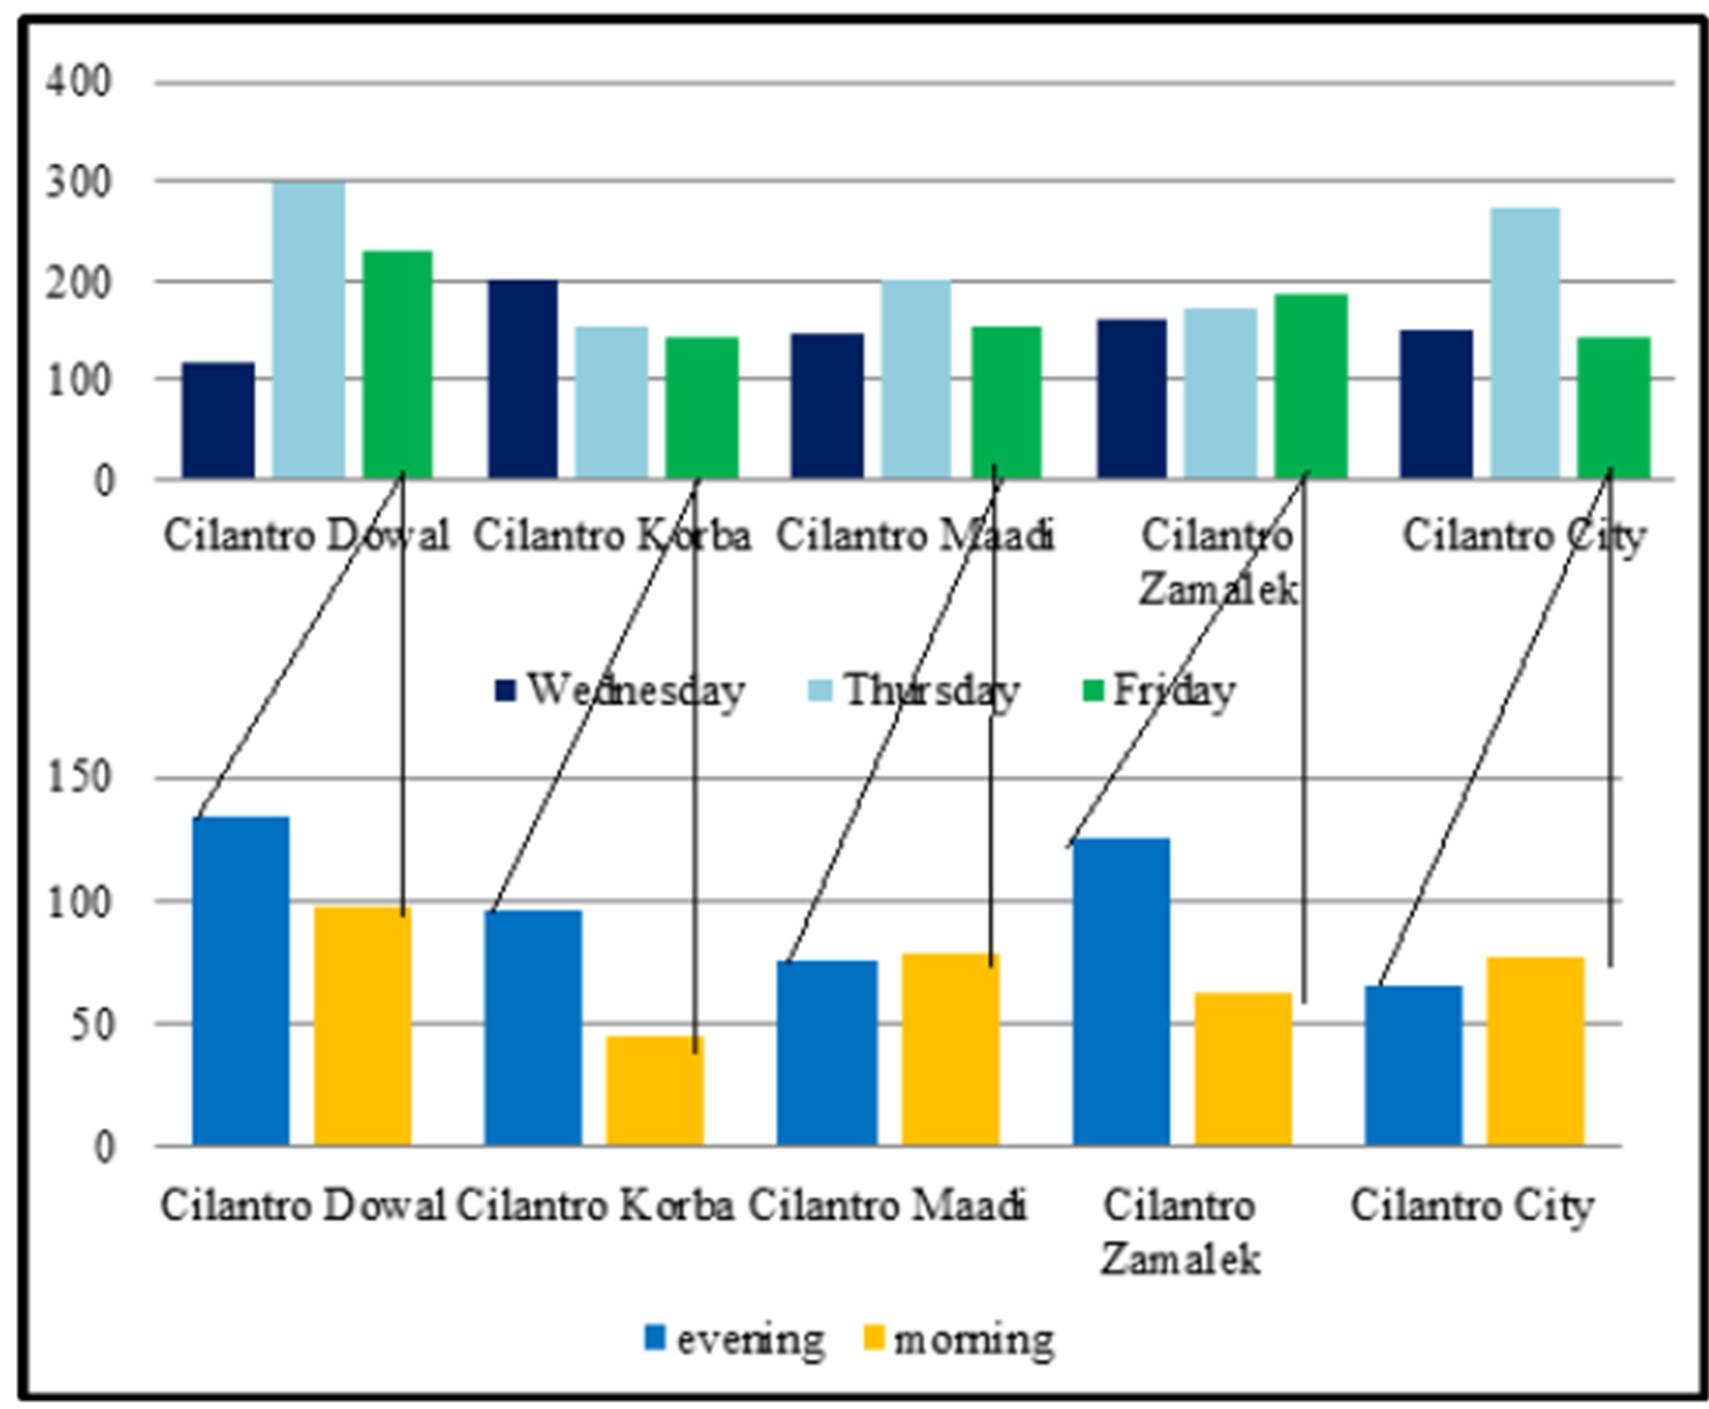
Now focusing on the Cilantro customers only, and the different districts, we can analyze the data from two different perspectives: the weekdays versus weekends or the time of the shift. The results show that on weekdays the Cilantro Korba district attracts the highest number of customers, while the Cilantro Dowal on Thursdays and Fridays was doing much better (the left of Exhibit# 12). When analyzing the data from the perspective of the time of shift, the Cilantro Korba is also doing very well in the evening shift while Dowal is doing better in the afternoon shift and Zamalek is the best in the morning shift (the right of Exhibit # 12).
Exhibit# 12: Number of Cilantro Customers in 5 Major Districts as Differentiated between Weekdays/Weekends (left) and Time of Shifts (right)
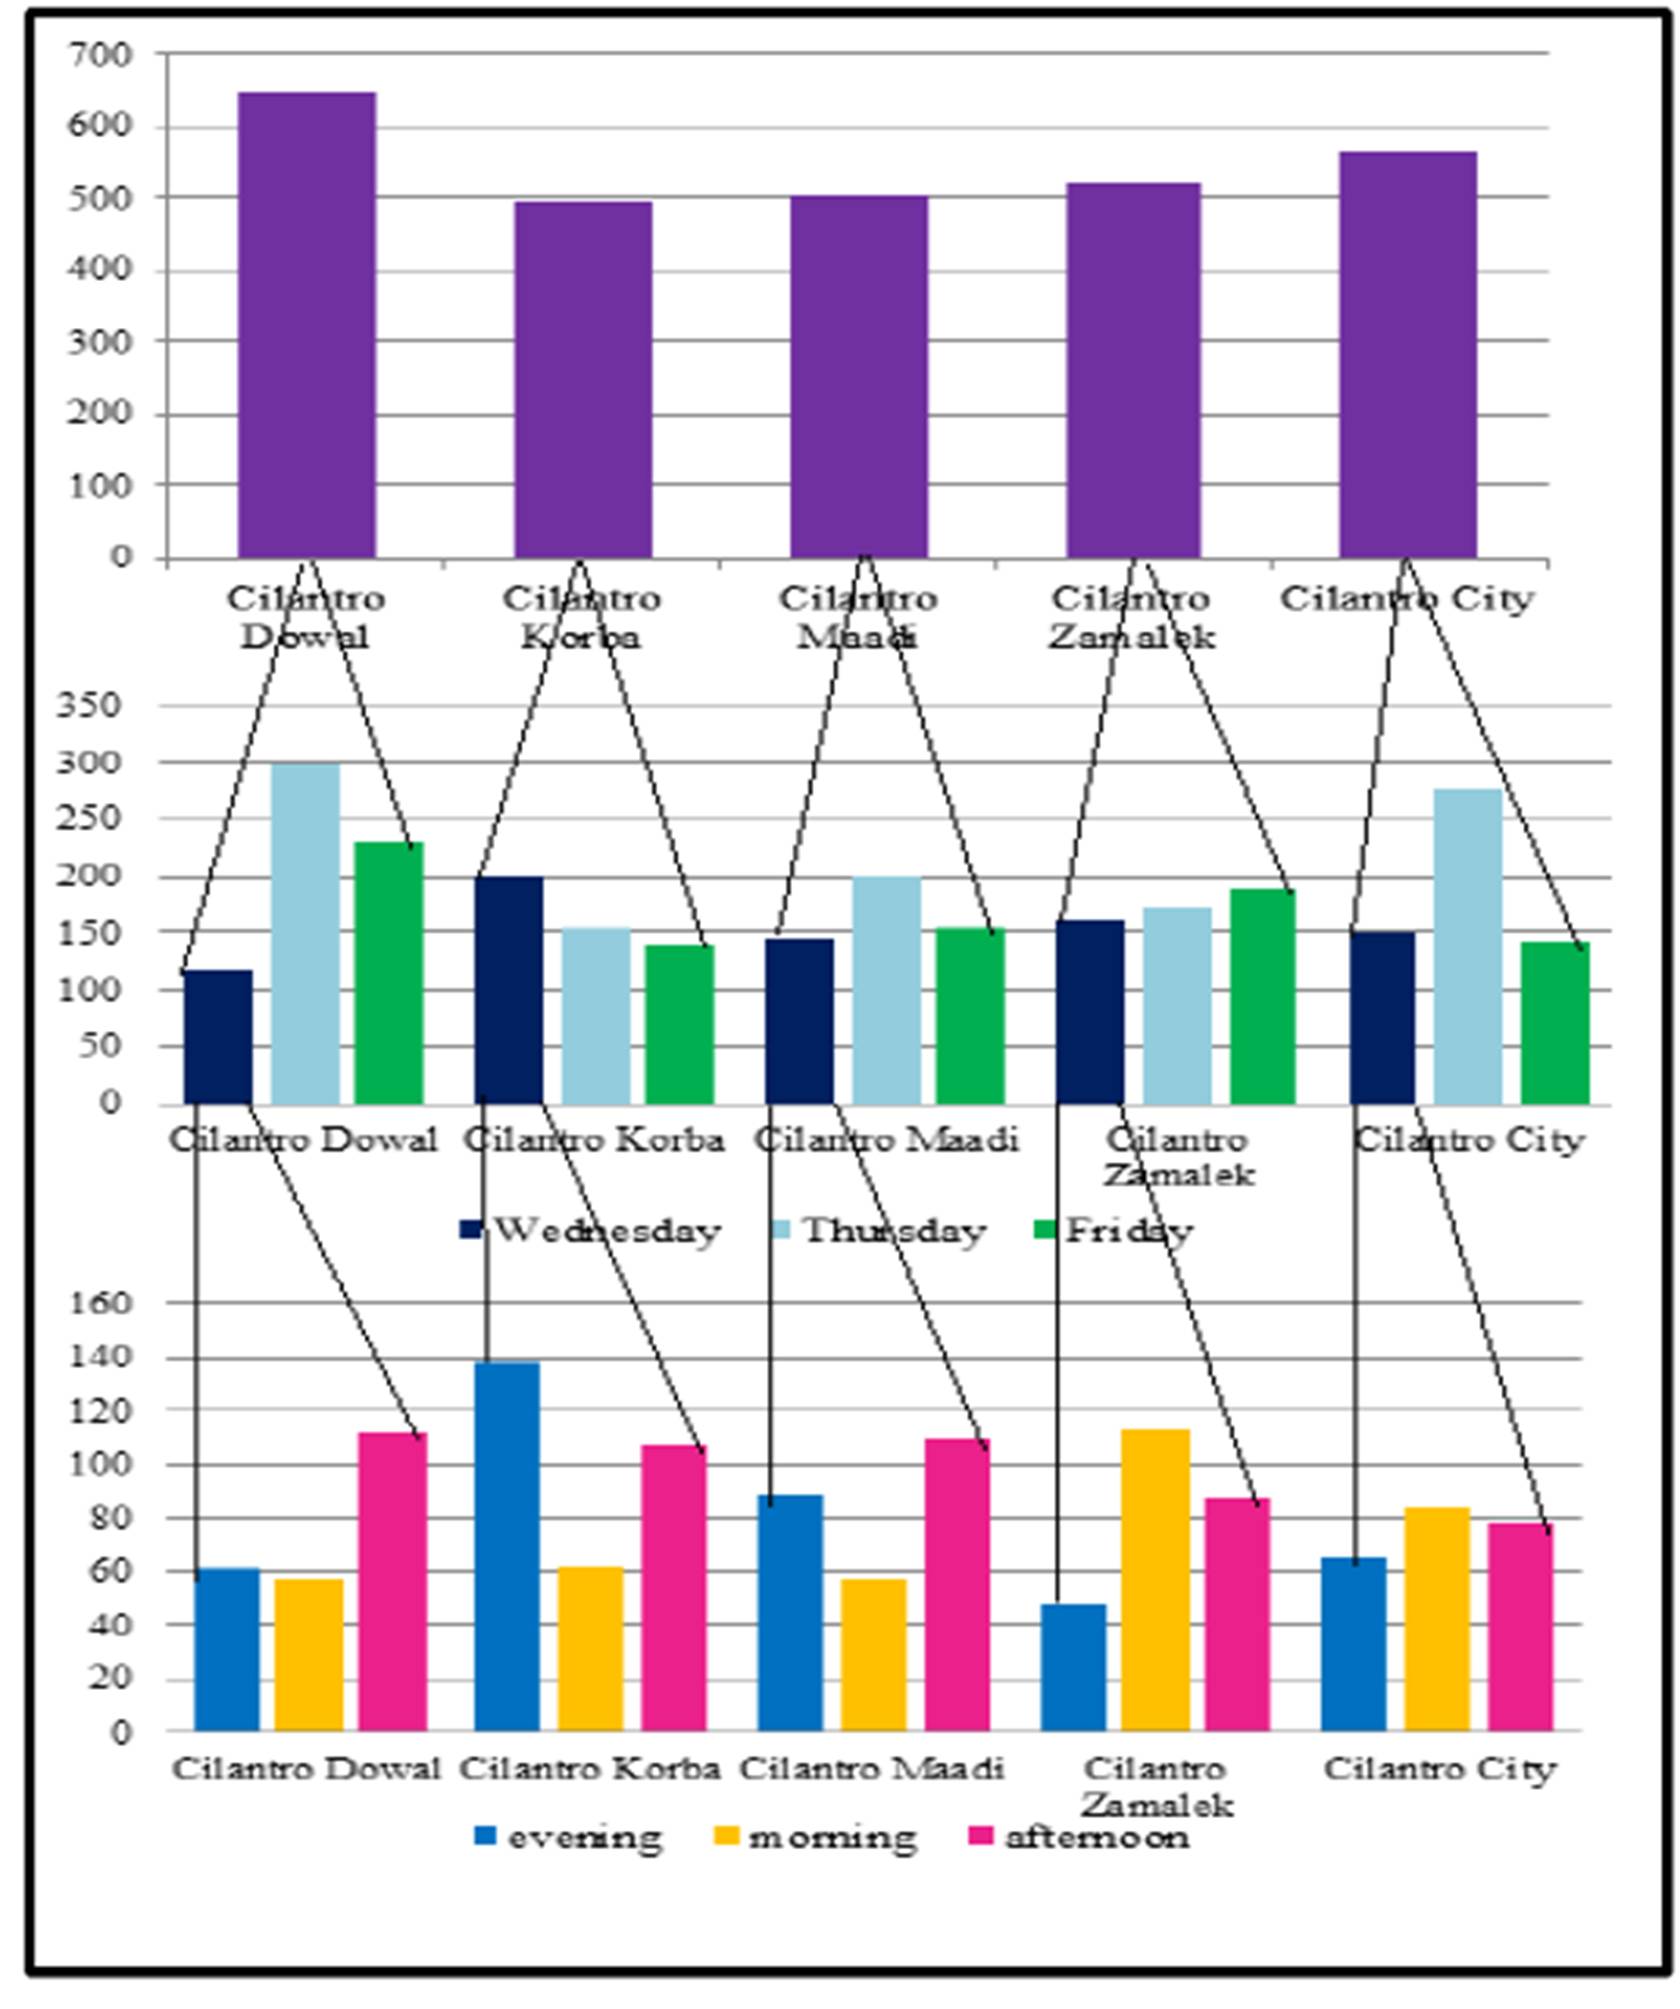
The following Exhibit displays the number of Cilantro customers by district (top) and then it is detailed in terms of the day of the week (Wednesdays versus Thursdays versus Fridays), and finally by zooming in on Wednesdays only in terms of the time of the shift (bottom):
Exhibit # 13: (Cilantro Customers as Displayed by Districts and Further Examined by the Day of the Week and Finally Detailed in Terms of Wednesdays Only)
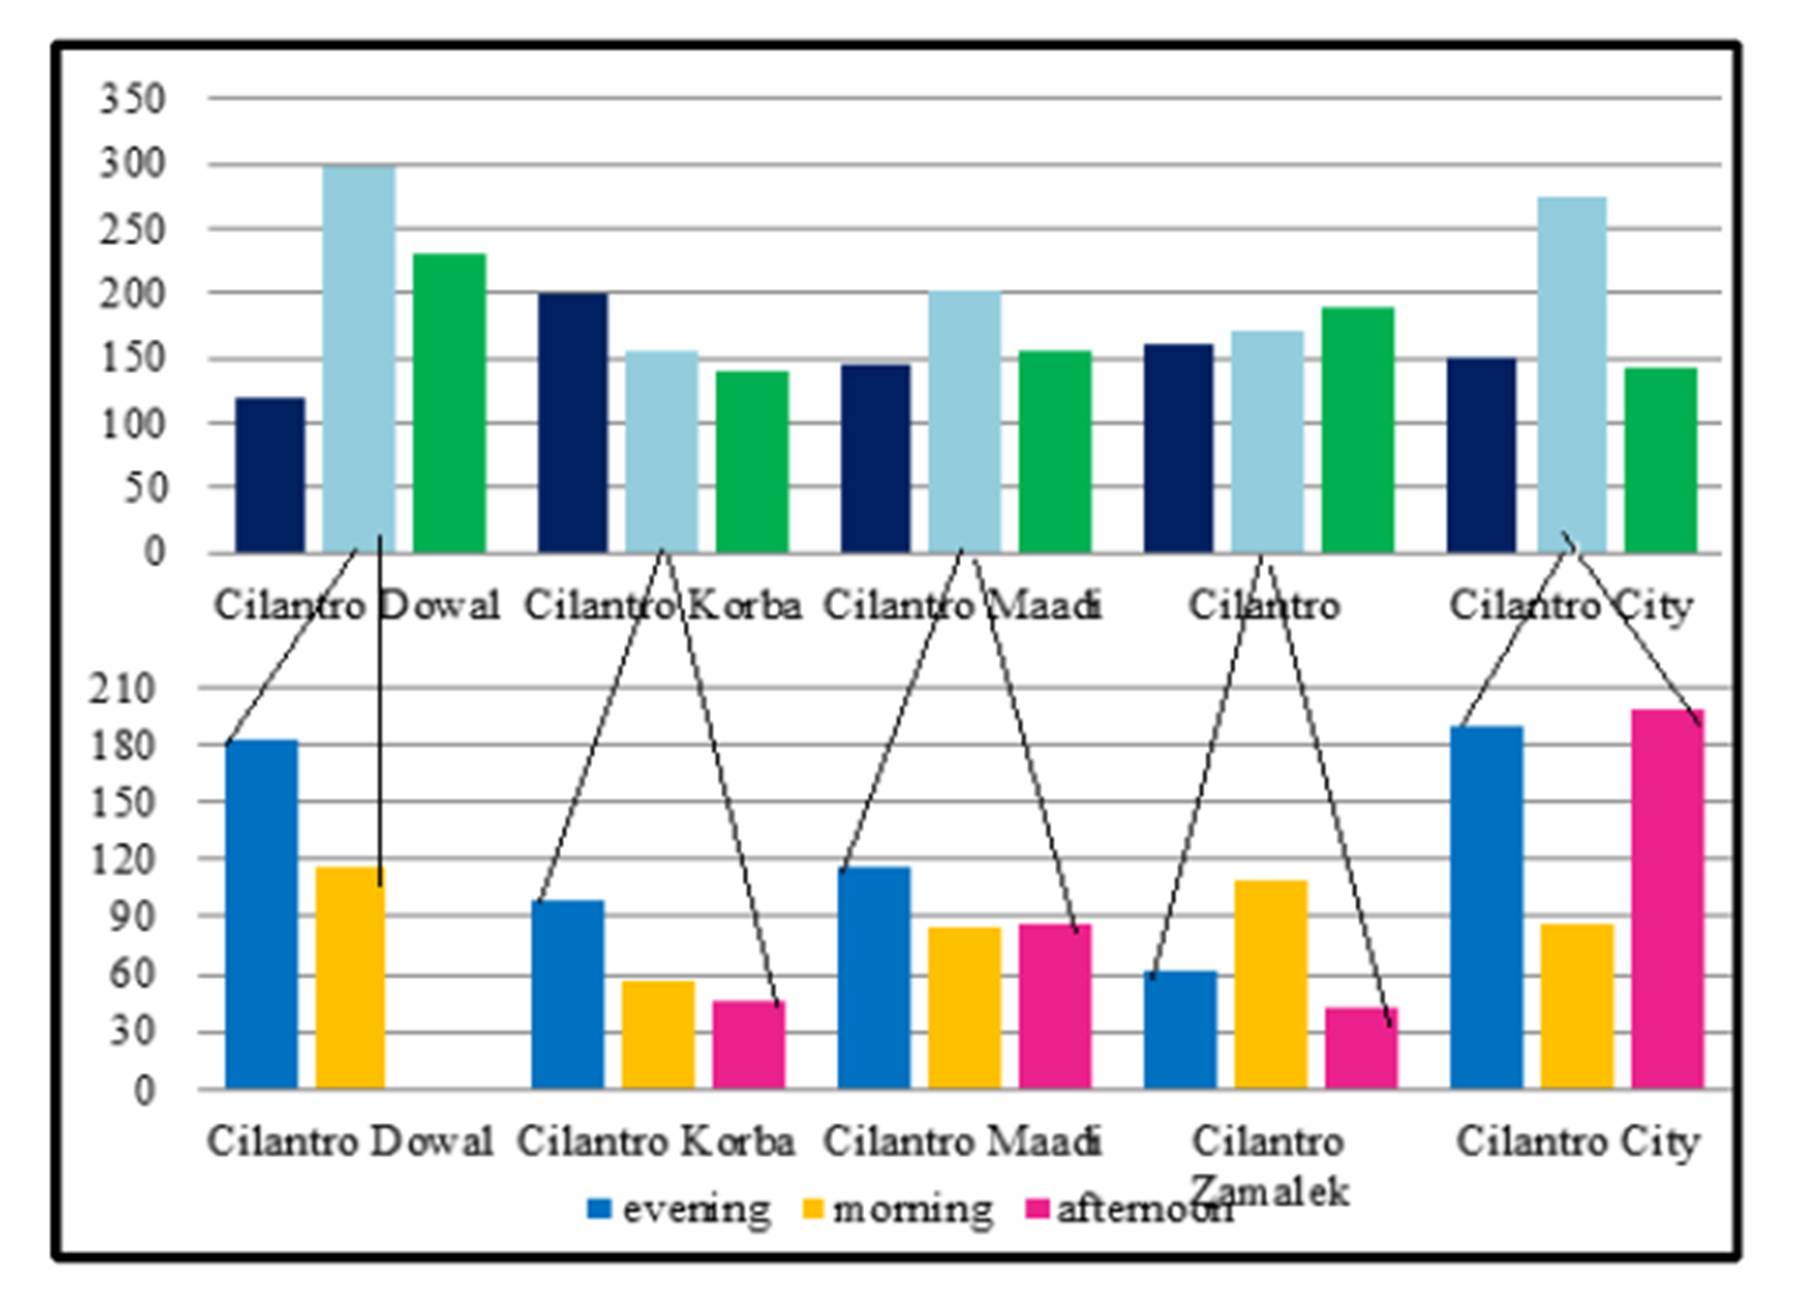
The following two Exhibits display the same information in terms of Thursdays and Fridays respectively:

Exhibit #14: (Cilantro Customers as Examined by the Day of the Week and Further Detailed in Terms of Thursdays Only)
The previous Exhibit showed that when further data-mining was done to calculate a customer’s probability to come on Thursdays, we see that Cilantro City Stars coupled with the afternoon shift has the biggest number of customers. As for the evening shift on Thursdays, Cilantro Dowal and City Stars are doing great.
When focusing on Fridays only we see that Cilantro Dowal coupled with the evening shift has the biggest number of customers. As for the morning shift, Cilantro Dowal has the largest number of customers. This is quite interesting as the morning shift is the Friday prayer time in Egypt that should be correlated with the demand. This correlation is non-existent in the Dowal district, contrarily to all the other districts where demand significantly drops during that shift (Exhibit #15).
Exhibit # 15: (Cilantro Customers as Examined by the Day of the Week and Further Detailed in Terms of Fridays Only)
Current Challenges/Problems Facing the Organization
To analyze or rank coffee shop customers according to their purchasing style and pattern, the Rateb model is used (Rateb, 2013). This technique has been developed by Rateb based of the Hughes’ RFM (Hughes, 2010). Rateb’s ADI modeling approach is based on the assumption that the following three variables affect demand (Exhibit #16):
Attribute (A) : the quality or characteristic of the customer (in terms of number of items bought per age group) as related to the total number of customers in that particular age group and not an absolute number of items bought.
Demographic (D) : the demand in coffee shops (in terms of number of customers) per age group.
Item Distribution (I) : the demand (in terms of number of items) per age group with reference to a particular item only (Food versus Beverage versus Food+ Beverage)
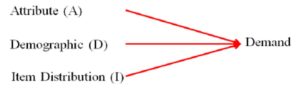
Exhibit#16: The ADI Model (Rateb, 2013)
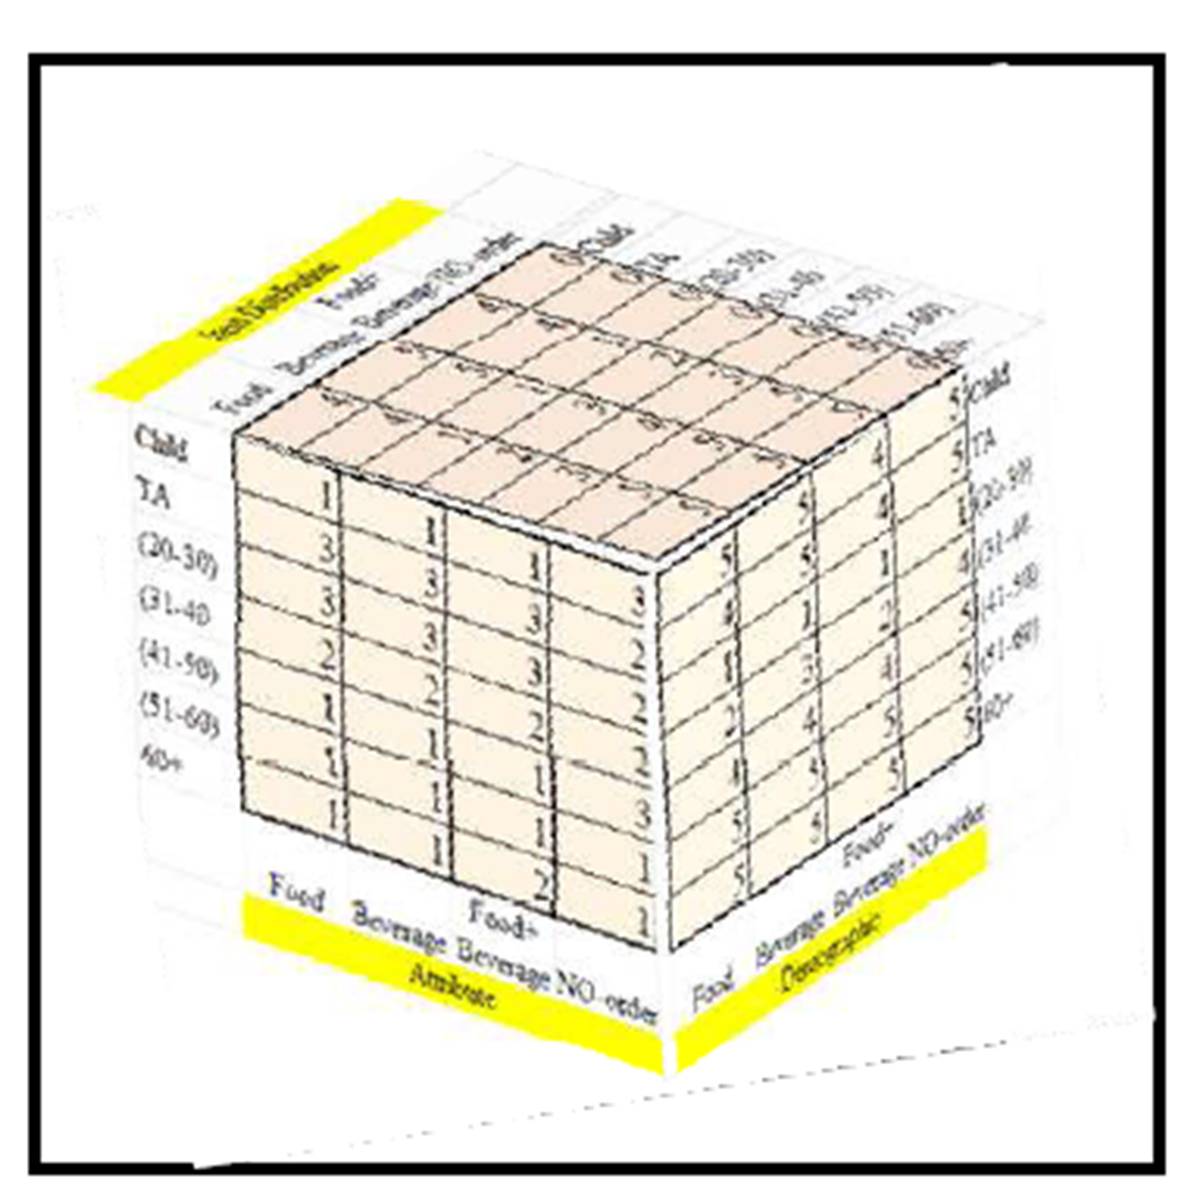
Getting information such as how recent, frequent, or the amount of money paid (RFM) for each coffee shop customer is not at all practical for this kind of analysis and that is why the ADI technique is used here. The RFM and the ADI focus on past sale that could be useful for the short run, but attempting to collect the RFM data for, say the teenager customers, would not be useful in the coffee shop settings where the customer could not be considered on an individual level but rather on a group level only (such as teenagers versus 60+). Customers are assigned Attribute, Demographic, and Item Distribution (ADI) scores based on total customers in a particular age group, total items purchased per age group and items purchased per head/customer respectively (Exhibit #17). The ADI uses the same concept of the 5 point Likert scale and takes into consideration the significant influence of each variable with one being the highest or the best and five being the least influential. The score is based on ranking the number of customers (Demographic) into five categories; so the age group with the biggest number of customers receives a (Demographic) ranking of 1. Similarly, an (Item Distribution) ranking of 1 is assigned to the age group that does the most purchases.
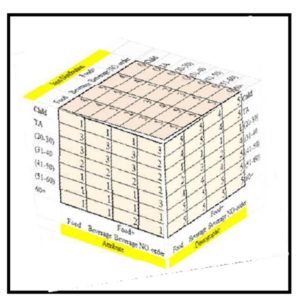
Exhibit#17: The ADI in 3D for All Coffee Shops
Food Items
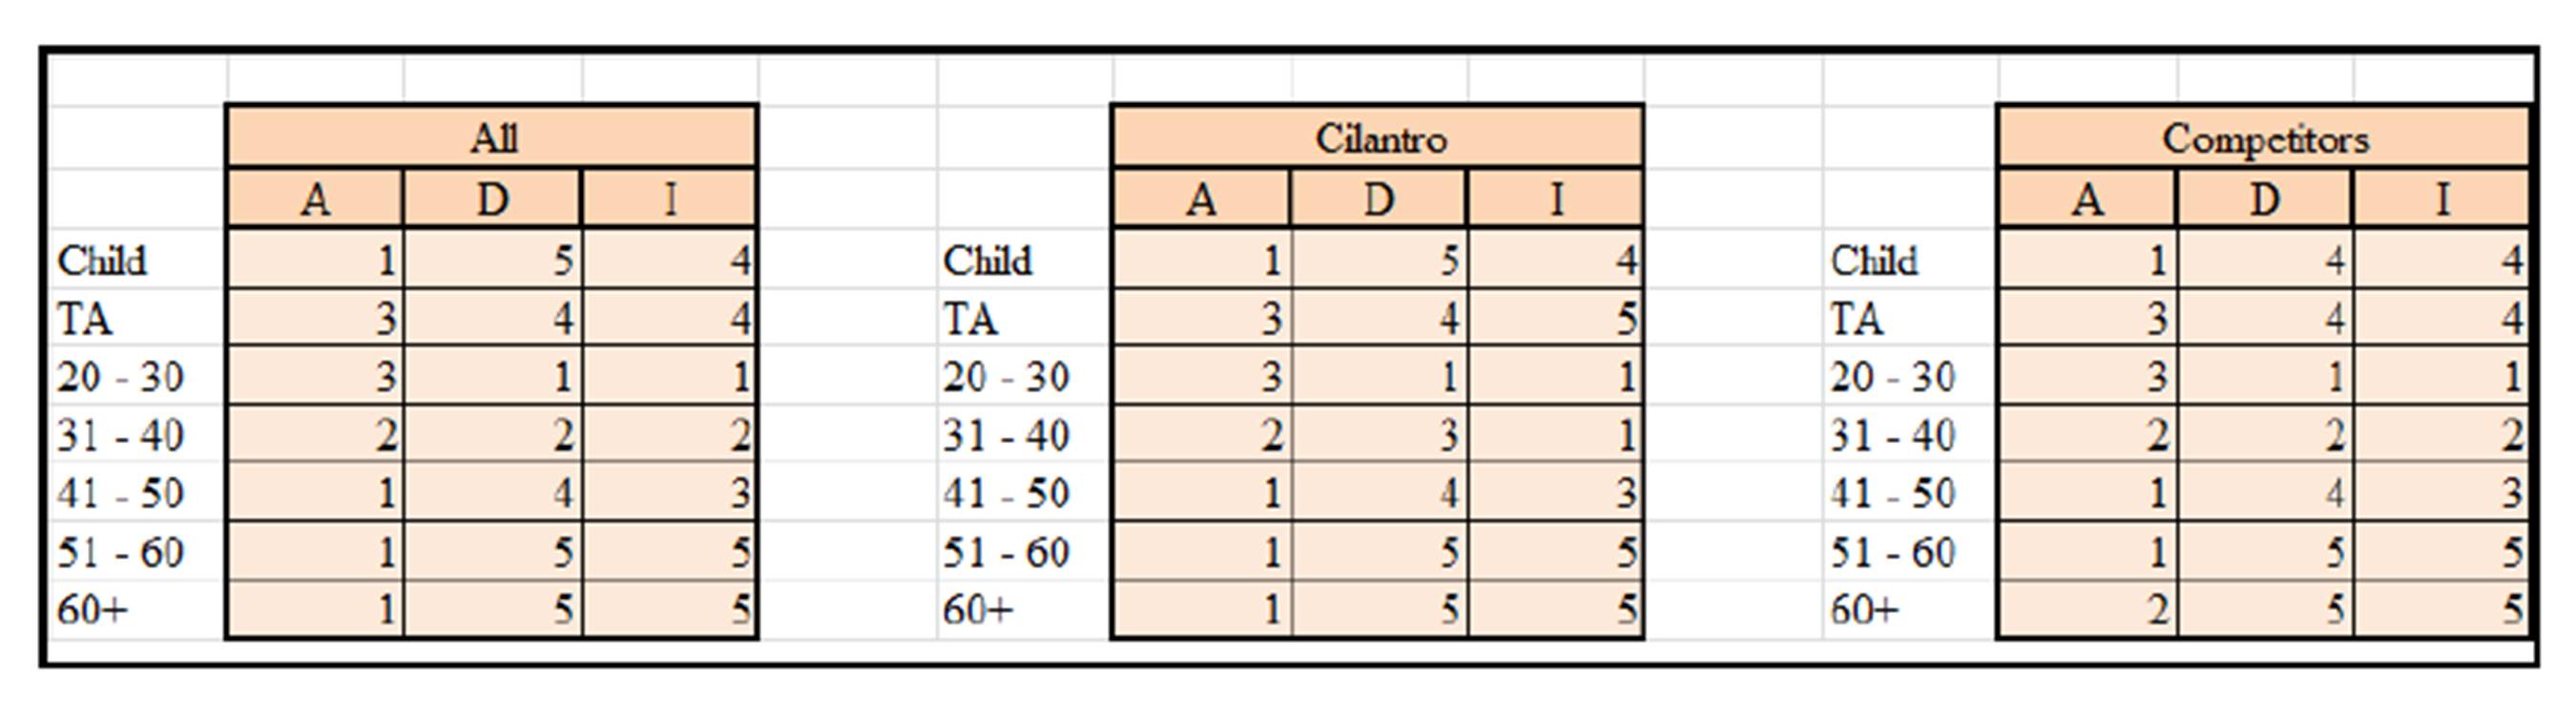
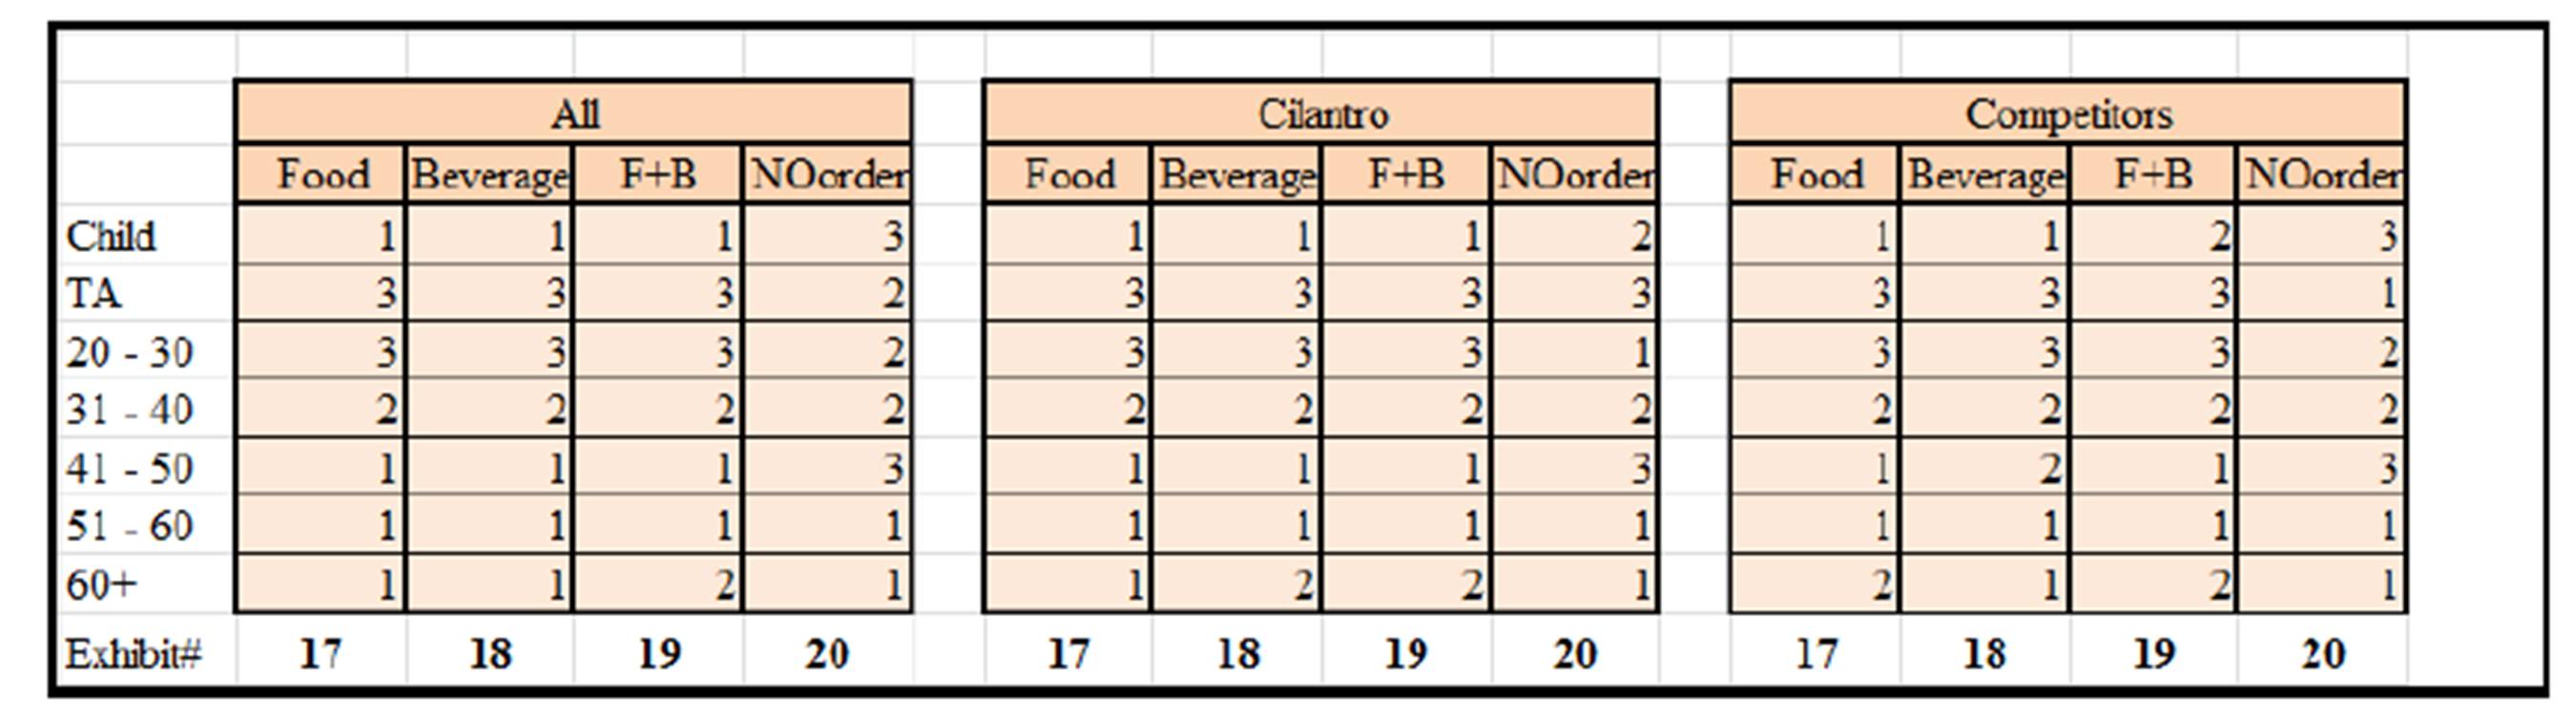
The following Exhibit shows the ADI for the food items for all the coffee shops then Cilantro alone and then all the Competitors displayed respectively (as distributed by age):
Exhibit #18: ADI for the Food Items for all Coffee Shops Watched (left), Cilantro Only (middle), and All the Competitors (right) as Distributed by Age
The (Demographic) of the Child-Food customer constitutes the least number (score of 5 in Exhibit #18) as well as a small portion of Food items bought by the Child-Food customer (Item Distribution). However, the (Attribute) score of 1 for the Child customer indicates that its orders are of the highest number of Food items per head/Child customer. From these scores we can interpret that despite the fact that the Child’s overall Food items purchased is comparably low (score of 4), he/she is a good customer relative to the amount of Food items ordered per head/customer. Management should attempt to attract more Child customers when selling Food. When comparing this to the Cilantro versus its Competitors we see that the Competitors are doing slightly better only in the total number of Child-Food customers (Demographic score of 4 relative to the 5).
On the other hand, the (Demographic) as well as the (Item Distribution) of the teenager TA-Food customer constitutes a very small portion of the total overall customers (score of 4 for both variables). With the (Attribute) score of 3, the TA-Food customer is an OK customer but probably management should not do anything in the short run. When comparing this to the Cilantro versus its Competitors we see that the Competitors are doing slightly better only in the total number of TA-Food items sold (Item Distribution score of 4 versus 5).
The (20-30)-Food customer constitutes the highest portion of the total overall customers (Demographic) as well as the highest portion of the Food items sold (Item Distribution). However, with an (Attribute) score of 3, makes the (20-30) year Food customer an average OK customer relative to the amount of Food items ordered per head (almost one on one). Management should attempt to up-sell more Food to the (20-30) year customer (note how the ADI score is the same for Cilantro and its competitors in Exhibit #18). Linking this to Exhibit #23, we see that the (20-30)-Food customers make up 40% and 34% for the number of customers and items sold respectively!
The (31-40)-Food customer constitutes a good portion of the overall Food customers (Demographic) as well as more than just OK portion relative to the (Item Distribution). With an (Attribute) score of 2, the (31-40) year customer is a good Food customer ordering a relatively high amount of Food items per head/person (note how the Demographic and scores for Cilantro are worse than its competitors in Exhibit #18 but are better for the Item Distribution).
The (41-50)-Food customer constitutes a very small portion of the total overall Food customers (Demographic) as well as an average portion of the (Item Distribution). However, the (Attribute) score of 1 for the (41-50)-Food customer indicates that its orders are of the highest number of Food items per head/customer. From these scores we can interpret that despite the fact that the (41-50) customers are only a small portion of the overall Food customers, they are good customers relative to the amount of Food items ordered per head. Management should attempt to attract more (41-50) customers when selling Food items (note how the Demographic and Item Distribution scores for Cilantro are the same as its competitors in Exhibit #18).
The (51-60) and the (60+) year customers constitute a very small portion of the total overall customers (Demographic) as well as the number of Food items bought (Item Distribution). However, the (Attribute) score of 1 for the (51-60) and the (60+) customers indicates that their orders are of the highest number of Food items per head/customer. From these scores we can interpret that despite the fact that the (51-60) and the (60+) customers constitute a very small portion of the overall Food customers &/or items ordered, they are good customers relative to the amount of Food items ordered per customer/head. Management should attempt to attract more (51-60) and (60+) customers when selling Food items (note how in Exhibit #18 the Attribute of the (60+)-Food Cilantro customers is 1 versus 2 for its Competitors which indicates that Cilantro is doing a better job in terms of Food items ordered per head for this age group).
Beverage, and Food + Beverage Items
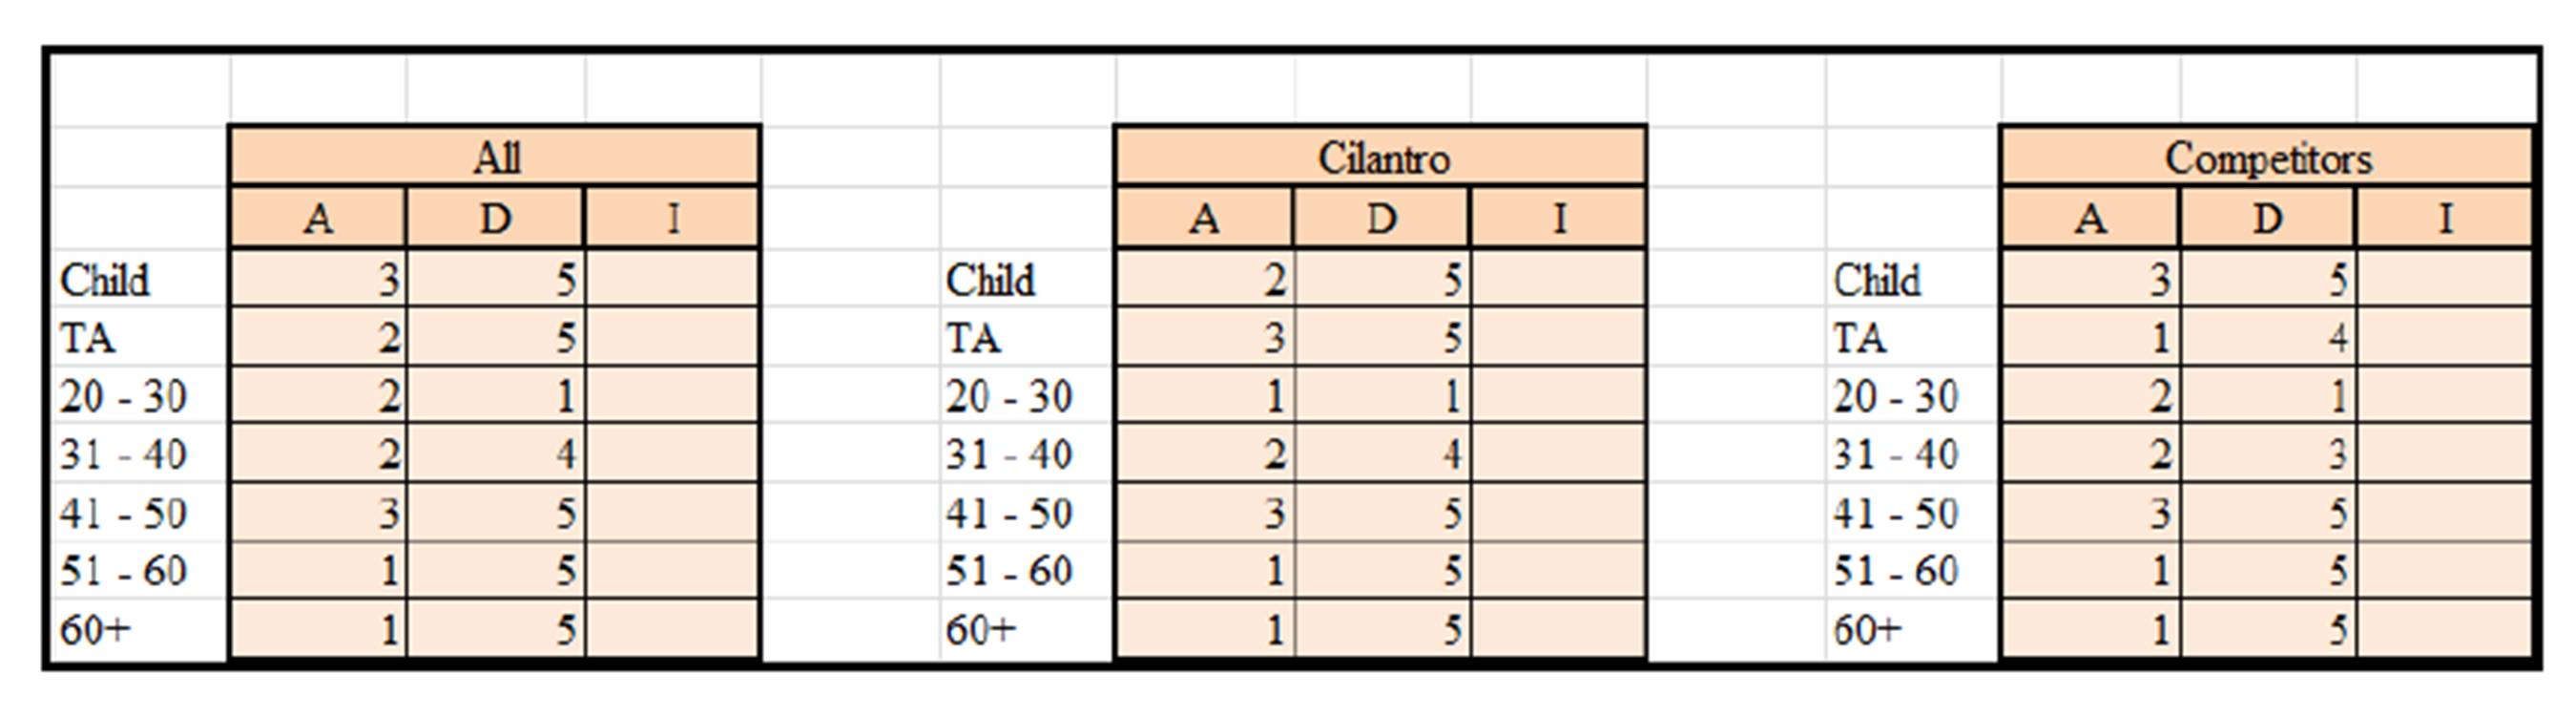
The following three Exhibits display the ADI for the Beverage, Food + Beverage, and NO order items respectively (as distributed by age). The previous analysis for the Food more or less prevails for the Beverage. In Exhibit #19 we see how the (20-30) Beverage customers have identical scores with the Food customers from the previous Exhibit. The rest have very minor differences. For example, the Beverage is selling less for the (TA) customers as well as the (31-40) customers. As for the (Attribute) Beverage score, it is worse for the (41-50) Beverage customers of the competitors and better for the 60+ of the competitors. Despite the fact that the difference is minor it is very important to look closely into this data because the Beverage items give more net profit per item than the Food items (almost three times as much).
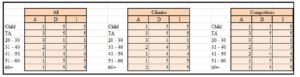 Exhibit #19: ADI for the Beverage Items for all Coffee Shops Watched (left), Cilantro Only (middle), and All the Competitors (right) as Distributed by Age
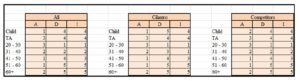
Exhibit #20: ADI for the Food + Beverage Items for all Coffee Shops Watched (left), Cilantro Only (middle), and All the Competitors (right) as Distributed by Age
NO-Order Items
For the NO order items, the ADI scores and the analysis are also very important. However, a score of 5 for the (Demographic) is considered a good thing in Exhibit #21 contrasted with the previous three exhibits where it was considered a weak number. This is because a score of 5 for the Child-NO order customer means that hardly any Child customer sits but does not order (whereas a 5 for the Child-Beverage customer means that there aren’t many Child-Beverage customers –Exhibit #19). Back to Exhibit #21 we see that the (20-30) customers have a 1 under (Demographic) which indicates that those are the most customers who do not place orders (compatible to Exhibit #23 where those customers make 54% of the NO-order customers). When comparing the (Demographic) of Cilantro against its Competitors in that same exhibit, we see that Cilantro is doing relatively better than its Competitors with the (TA)-NO order customers and the (31-40)-NO order customers. In other words, the (TA) and the (31-40) Cilantro customers who do not order are fewer than their competitors’ counterparts (less NO-order).
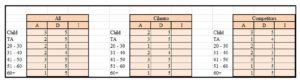
Exhibit #21: ADI for the NO Order Items for all Coffee Shops Watched (left), Cilantro Only (middle), and All the Competitors (right) as Distributed by Age
It is important to note how in Exhibit #21 the number of items sold (Item Distribution) is not filled; because this is the NO-order exhibit meaning we cannot count the number of items that have not been ordered /sold yet.
To analyze the Attribute score of the NO-order it was important to benchmark this against the previous three exhibits. The following exhibit is merely the Attribute data extracted from the previous 4 exhibits of the Food, Beverage, Food + Beverage, and NO order exhibits (Exhibits #18, 18, 19, and 20 respectively).
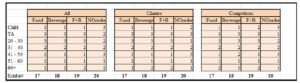
Exhibit #22: The Attribute (A) Score for all Coffee Shops Watched (left), Cilantro Only (middle), and All the Competitors (right) as Distributed by Age
Interestingly we see that the Attribute score for the (51-60) customers is 1 for the Food, Beverage, Food + Beverage, and even the NO-order items (Exhibit #22). This means that despite the fact that the orders of the (51-60) customers are of the highest number of Food, Beverage, Food + Beverage items per head/customer, the (51-60) customer also have the highest number of NO-order items per head. This is because the ADI technique is a vertical analysis per age group customer; so a high Food score indicating a high number of Food items ordered per head in that age group is a relative thing (number of items ordered in that age group relative to the number of customers in that age group). Whereas for the NO order ADI score we cannot see how many NO order items there are relative to the NO order customers (how can we count the items that were not ordered?). In this case it is simply the number of NO-order customers in a particular age group relative to the total number of customers in that age group. Note how the (41-50) customers also have the highest Attribute for the Food, Beverage, Food + Beverage items per head, but an average Attribute of 3 for the NO-order score; indicating that they do not usually sit without placing an order. The same goes for the Child customers, but the Child of the competitor does less NO-order than that of Cilantro’s. For the (TA) customers, Cilantro is doing much better than its competitors where most (TA) customers of the competitors do not place orders. For the (20-30) customers, the competitors are doing better with fewer NO-orders taking place per head as opposed to those of Cilantro. This is lost business for Cilantro because the (20-30) customers constitute the biggest portion of Beverage customers as well as Beverage items sold in general as can be seen from Exhibit #23. Beverage, as previously noted, give a much higher net profit per item than that of the Food. Also Beverage has much more customers and much more items sold as was previously displayed and discussed in Exhibit #2.
From Exhibit #23 we can see how the (20-30) customers are by far the largest in terms of the number as well as the total items purchased (40%/34%, 50%/42%, and 39%/33% for Food, Beverage, and Food + Beverage respectively). The (20-30) customers are also the ones with the highest percentage of those who do not place orders (54%)! Second to that come the (31-40) customers but they are also among the highest who do not place orders (20% NO-order). It is up to Management to decide what to do with this data. For example, Cilantro openly allows customers to come in without placing orders while some of its competitors do not allow this and when done it is simply “under the table”. Trying to up sell Food/Beverage items to the (20-30) customers will definitely be the ultimate goal of all those coffee shops but the approach might differ. When the coffee shop is crowded it needs a different approach than when it is not for those customers who although ranked the highest with the ADI scores, also have the highest number of NO-order. In other words, there is no one strategy or data mining technique that fits all – neither at the coffee shop level nor at the day-to-day level. Combining the ADI with the previous analysis supports decision making and data mining especially when major changes takes place. For example, as previously stated, the data collected was before the Egyptian revolution, whereas after the uprising the Evening shift significantly decreased in terms of the number of customers (obvious even to the naked eye).
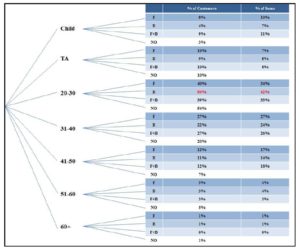
Exhibit #23: The Percentage of Customers and Items Sold as Distributed by Age
Conclusion
Rateb’s ADI (2013) is à la Hughes’s RFM (2010), but the emphasis is on coffee shop items purchased per customer as categorized by age (A), the total number of customers (D) in each age group, and the total items purchased by each age group customer (I); instead of the recency (R), frequency (F), and money (M). The ADI thus focuses on the attitudes and lifestyles of the coffee shop customers as segmented by age groups; which is very useful in forecasting trends in the long run; and thus, it supports decision making by simply delivering a summary of customer behavior and purchasing patterns. That is why the ADI technique is the one used in this study.
This research used the ADI technique to analyze the data in terms of the Food items sold, the Beverage items, the Food + Beverage, as well as the NO-orders as categorized by age groups. Further analysis was done to compare the Cilantro business against its coffee shop competitors. Padhy et al., (2012) warn against trying to come up with one data mining system that fits all. The data mining techniques used in this study could help generate new business opportunities by providing: prediction of trends and behaviors as well as discovery of previously unknown or hidden patterns.
(adsbygoogle = window.adsbygoogle || []).push({});
References
Alpion, Gėzim (2011), Encounters With Civilizations: From Alexander the Great to Mother Teresa, retrieved June 2013, http://books.google.com.eg/books?id=Ikb8zMXSViMC&pg=PA48&redir_esc=y#v=onepage&q&f=false
Bentley and Whitten, Systems Analysis and Design for the Global Enterprise, McGraw-Hill International Edition, seventh edition, 2007.
Google Scholar
Bizzari, H, “Cilantro, ‘Appetite for Life’”, http://www.touregypt.net/featurestories/cilantro.htm , (accessed August 16, 2010)
Cambridge University Press, http://thesaurus.maths.org/mmkb/entry.html?action=entryById&id=470; (accessed September 12, 2010).
Cheng, C., and Cheng, Y., “Classifying the Segmentation of Customer Value via RFM Model and RS Theory,” Expert Systems with Applications, Vol. 36, No. 3, 2009.
Publisher – Google Scholar
Cilantro, http://www.kingtutshop.com/Egyptian-Herb/Cilantro.htm (accessed August 16, 2010).
Diab, O., “From Egypt to the World: Bon Appétit”, http://www.businesstodayegypt.com/article.aspx?ArticleID=8417, April 2009.
Fact Group, “Leading Practices in Market Analysis, How Top Retailers are Using Market Basket Analysis to Win Margin and Market Share,” http://www.factpoint.com/pdf2/1.pdf, 2008.
Francis, J. K., “Coffea arabica L. RUBIACEAE”. Factsheet of U.S. Department of Agriculture, Forest Service. Retrieved 2007-07-27.Goele, S., and Chanana, N., Data Mining Trend in Past, Current and Future,” International Journal of Computing and Research, 2012.
Gane, C., and Sarson, T., “Structured Systems Analysis: Tools and Techniques”, Prentice-Hall, Inc., Englewood Cliffs, New Jersey, 1979.
Gray, Paul, “Manager’s Guide to Making Decisions about Information Systems”, John Wiley & Sons Inc., 2006.
Gutierrez, N., “Demystifying Market Basket Analysis,” Information, http://www.information-management.com/specialreports/20061031/1067598-1.html, April 2013.
Hoanca B., and Mock, K., “Using Market Basket Analysis to Estimate Potential Revenue Increases for a Small University Bookstore,” Conference for Information Systems Applied Research, Wilmington North Carolina, USA, 2011.
Google Scholar
Hoffman, C., “Egypt’s Coffeehouses”, National Geographic, retrieved June 2013, http://travel.nationalgeographic.com/travel/egypt/coffeehouses/.
Hughes, Arthur, “Quick Profits with RFM Analysis”, http://www.dbmarketing.com/2010/03/quick-profits-with-rfm-analysis/; (accessed September 12, 2010).
Ruiz, J., “Starbucks Customer Profile; Relationship Marketing Customer Analysis,” Relationship Marketing, 2012.
Kolce E., and Frasheri N., “A Literature Review of Data Mining Techniques Used in Healthcare Databases ICT Innovations, 2012 Web Proceedings.
Kroenke, D., “Experiencing MIS”, Pearson Education, 3rd edition, 2011
Kroenke, D., “Using MIS”, Pearson Education, 2nd edition, 2009
Liu, L., BhattacharyLaudon & Laudon, Essentials of Management Information Systems, Pearson International Edition, 8th Edition, 2009.
Ya, S., Sclove, S. L., Chen, R., and Lattyak, W. J., “Data Mining on Time Series: an Illustration Using Fast-Food Rstaurant Franchise Data,” Computational Statistics & Data Analysis, 37, 2001.
Mostafa, H., “Homegrown Cilantro Girds for Starbucks”, http://www.businesstodayegypt.com/article.aspx?ArticleID=6820, July 2006.
Ngai, E.W.T., Xiu L., and Chau, D.C.K., “Application of Data Mining Techniques in Customer Relationship Management: A Literarture Review and Classification,” Expert Systems with Applications, 36 (2009).
Google Scholar
Padhy, N., Mishra, P, Panigrahi, R., “The Survey of Data Mining Applications and Feature Scope,” International Journal of Computer Science, Engineering and Information Technology (JICSEIT), Vol. 2, No. 3, June 2012.
Pande A. and Abdel-Aty, M., “Market Basket Analysis of Crash Data from Large Jurisdictions and its Potential as a Decision Support Tool,” http://digitalcommons.calpoly.edu/cenv_fac/220/, retrieved May 2013.
Rateb, D. F., “Cilantro Database and Information Systems for Marketing,” the 21st IBIMA Conference, June 2013.
Shell, Cashman, and Rosenblatt, Systems Analysis and Design, Course Technology Thomson Learning, fourth edition, 2001.
Starbucks and Others, https://sites.google.com/site/neverflops/cases/case2, 2013.
Starbucks Customer Profile; Relationship Marketing Customer Analysis, http://www.strategicdriven.com/marketing-insights-blog/starbucks-customer-profile-relationship-marketing-customer-analysis/, posted by Ruiz, August 2012.
Starbucks SWOT Analysis, http://www.starbucks.com, 2012.
Silwattananusarn T. and Tuamsuk T., “Data Mining and Its Applications for Knowledge Management: A Literarture Review from 2007 to 2012”, International Journal of Data Mining & Knowledge Management Process (IJDKP), Vol. 2, No. 5, September 2012.