Introduction
As a result of ever increasing environmental concerns on global warming issues due to the fossil based energy consumption, industries have been increasingly interested in alternative energy sources, especially biological ones such as biogas from their process wastes. It is well known that increasing energy demand of fast growing economy in all developed and developing countries have been causing environmental pollution. Eventually, the interest in biofuels, especially biogas production, has also been increasing. In this respect, food industry wastes have great potential to meet this ever increasing energy demand of industries via biogas production which has also economic and ecological benefits. Both aerobic and anaerobic processes are usually used for metabolizing most biodegradable organic pollutants at approximately same rates per unit of biomass (Speece, 1996). Anaerobic biodegradation system is more cost effective than the aerobic process in most cases (especially when the influent COD is high) and other advantages such as minimizing the off-gas production, much lower foot print and less nutrient requirement etc. make process more attractive (Speece, 1996). Last but not the least, energy recovery in the form of bio-methane from anaerobic treatment contributes to energy security not only at industrial scale but also at national scale (Kaushalya, et al., 2010). Anaerobic digestion processes are suitable for many types of industrial wastes, especially of organic origin such as potato waste (Parawira, et al., 2005), food (Lee et al., 1999) and sugar beet pulp (Weiland, 1993), fruit and vegetables craps (Viturtia, et al., 1989), animal waste (Qiao, et al., 2011) and municipal organic solid wastes (Bolzonella, et al., 2006). Significant numbers of studies and research activities on the biogas potential of solid organic substrates have been carried out; on the other hand, there is very limited data in regard to the valorization of brewery solid wastes in this manner.
Brewery is one of the traditional industries with an important economic value in the agro-food sector. The total beer production in Europe is more than 358×105 m3 with 117.000 employees working in more than 1840 facilities which corresponds to over 8.8 billion € revenues (The Brewers of Europe, 2004). In brewery industry, approximately 3-10 l of wastewater is generated for each liter of beer produced (Tabatabaei, et al., 2010). Beer production steps include both chemical and biochemical reactions such as mashing, boiling, fermentation, maturation and also separation processes (wort separation, wort clarification and rough beer clarification, filtration, CIP (Clean In Place), packaging, etc.) respectively (Fillaudeau et al., 2006). For every 1, 000 tons of beer produced, 137 to 173 tons of solid waste may be created in the form of spent grain, trub from wort production, waste yeast (Jurado, 2011). During these processes different types of wastewater is released based on the production process. Therefore, pollution parameters such as pH, temperature, suspended solids, organic materials etc. of brewery effluent and temperature vary depending on the source. Nitrogen and phosphorous levels mainly depend on the handling of raw material and the amount of spent yeast present in the effluent. Elevated phosphorous levels can also be the result of phosphorous containing chemicals used in the CIP unit. Brewery effluent include sugar, soluble starch, volatile fatty acid, ethanol (Driessen and Vereijken, 2003), high content of suspended solids, e.g. spent maize, malt, and yeast (Parawira, et al., 2005), etc. which also contribute to the organic pollution which is amenable for biodegradation (BOD – Biochemical Oxygen Demand/COD – Chemical Oxygen Demand ratio of 0.6-0.7 (Driessen and Vereijken, 2003). The brewery process results in the generation of wide variety of solid wastes including spent grains, trub, spent yeast, and diatomaceous earth slurry from filtration. Some of these residues have a commercial value as byproducts for livestock feed, even though the nutritional value of spent grain is less than that of the same amount of dried barley. Amongst slurry type wastes, trub consists of heavy fats, wort, inactive yeast and hop particles and unstable colloidal proteins coagulated during the wort boiling. Surplus yeast which has a high content of organic matter is a residue produced during natural sedimentation at the end of the fermentation and conditioning. Most of the spent yeast is sold as a feeding material for livestock. Another solid waste during the brewery process is diatomaceous earth slurry from the filtration of beer which is composed of large amount of Suspended Solid (SS) and high BOD/COD ratio (Bolzonella, et al., 2006). Due to the high organic loadings of the brewery industry, the demand for environmental investments are high, on the other hand, the organic material available in brewery wastes has also very high potential for bioenergy production allowing an environmentally friendly disposal solution.
In this study, the conversion of brewery wastewater (Türk Tuborg Bira ve Malt Sanayi A.Ş.) into bioenergy is reported at real scale and the bioenergy potential of other solid organic waste streams such as malt wastes and grid wastes were examined using BMP (Biochemical Methane Potential) protocol. To the best of our knowledge, there is only one literature report in regard to full scale performance of a UASB (Up flow Anaerobic Sludge Blanket) reactor (Parawira, et al., 2005). In our study, we report the performance of a novel bioreactor configuration, namely EGSB reactor and furthermore; we also report additional data on the extra bioenergy potential of the brewery wastes (malt waste and grid waste) which doubles the bioenergy potential of the brewery waste streams. As a result, both economically and ecologically attractive model for the disposal of brewery wastes is presented in this study. The results were reported to demonstrate the potential of organic wastes in the whole energy budget of the factory as a model solution for other industries.
Material and Method
Characterization of Wastewater and Solid Wastes
The beer industry wastes (industrial malt and grid wastes) and wastewater samples were taken from Türk Tuborg Bira ve Malt Sanayi A.Ş., Izmir, Turkey. Both wastewater and solid wastes (malt wastes) were characterized in accordance with Standard Methods (APHA, AWWA and WPCF, 2001). The following parameters were analyzed: COD, Total Suspended Solids (TSS), pH, temperature, nitrogen, phosphate, sulphate, Volatile Fatty Acids (VFA), alkalinity (APHA, AWWA and WPCF, 2001).
Wastewater Treatment by EGSB (Expanded Granule Sludge Blanket) reactor
All of the performance data used in this study was obtained from the industrial full-scale EGSB reactor operating in Türk Tuborg Bira ve Malt Sanayi A.Ş. in Izmir, Turkey. The whole treatment system consists of screening unit, flow equalization tank, EGSB reactor, secondary settling tank, sludge thickener and decanter as sketched in Fig.1. There is no extra heating applied since the process wastewater is already warm (about 25-30oC) (Table 1). The total volume of the EGSB reactor was 2280 m3 and the organic loading rate of 6 kg COD m-3.day-1, on the average. In order to monitor the performance of the whole treatment system, especially EGSB bioreactor, the following operational parameters such as CH4% in the head space, temperature, pH, OLR (Organic Loading Rate), HRT (Hydraulic Retention Time) and influent flow rate were monitored daily at different sampling points.
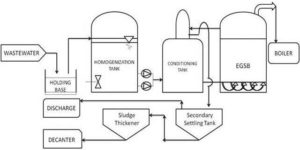
Fig. 1: Anaerobic Treatment System Flow-Scheme
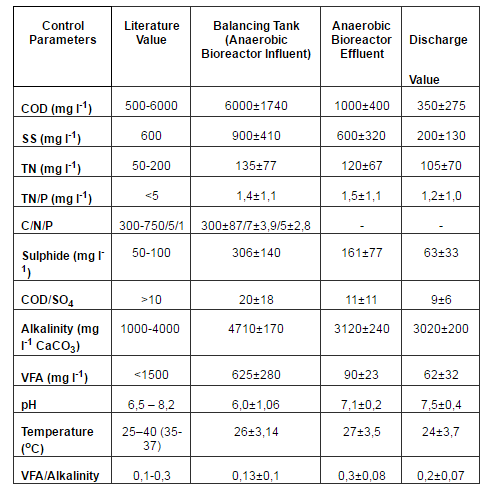
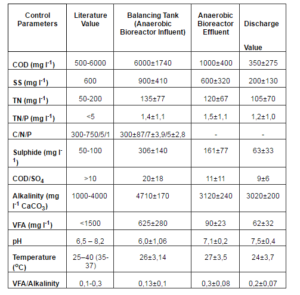
Table 1. Result of Characterization Studies (Speece, 1996; Parawira, et al., 2003; Igoni, et al., 2008; Tchobanoglous, et al., 2003; Weiss, et al., 2009)
Biochemical Methane Potential (BMP) Tests
Biochemical methane potential assay (BMP) was used to monitor the anaerobic biodegradability (Owen, et al., 1979). In order to determine the anaerobic biodegradability of the two different solid wastes such as malt waste and grid wastes from primary screening unit; BMP tests were used. The BMP Assay was performed in 100 ml serum bottles capped with rubber stoppers and sealed with aluminum covers. The serum bottles were seeded with flocculent anaerobic stock culture with VSS (Volatile Suspended Solids) values of 66 g l-1 respectively. The flocculent anaerobic consortium was obtained from the anaerobic UASB reactor. The bioreactors were seeded with 10 ml inoculum obtained from the main stock in order to provide a VS concentration of 10 g l-1in reactors and 5 ml of basal medium from a ten times concentrated stock solution prepared according to Speece et al. (2006) . The organic dry matter content was increased from 10% to 17.5% in different reactors the pH was kept at 7 and after flushing the head space with N2 gas to provide anaerobic conditions the reactors were kept at 36oC incubator. All bottles were purged with a gas mixture of 75% of N2 and 25% of CO2 for 4 min to provide anaerobic conditions and were then capped with rubber stoppers and sealed with aluminum covers. Total gas production recorded daily for 30 days by a glass syringe and the methane content of biogas in the head space was determined by gas chromatography (GC). The control serum bottles that contained only biomass but no organic wastes were also run in all experiments to determine the background gas production. The total gas production was recorded each day using a hypodermic needle connected to a calibrated fluid reservoir through the serum cap. All experiments were run in triplicate and the mean values of net biogas production were reported (Azbar, et al., 2010).
Result & Discussion
Result of Characterization
Table 1 summarizes the characterization values reported in literature and the average results of the analysis from various sampling points at the Türk Tuborg plant. It was seen that the results of the wastewater analysis are in parallel to the literature values.
C/N/P is an important parameter for the successful anaerobic degradation of organic wastes. In comparison with industrial scale results, N and P coming from barley structure are above the literature values. But no significant negative effect was noticed throughout the study in terms of the operation of the reactors.
Suspended or dissolved solids in influent and effluent were also analyzed. In this study, a TSS value in the influent was 900 mg l-1. SS values in the influent were found to be slightly higher than the literature values; on the other hand, finals discharge had low SS values around 200 mg l-1. In order to minimize the COD contribution of residual SS in the final discharge, Türk Tuborg employs a final sedimentation tank before discharging into publicly owned sewer.
The average COD value of influent of the anaerobic biodegradation system is 6000 mg l-1. The average COD value was observed to be significantly dependent on the beer production process. But, the existing anaerobic bioreactor which had a HRT of 1-2 days was able to accommodate these variations resulting in a final discharge COD values between 200-500 mg l-1 COD before the final discharge point (Table 2, Fig. 2).
Table 2. Discharge Values and Compliance with Turkish Standards
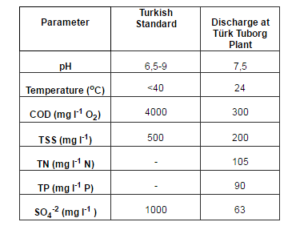
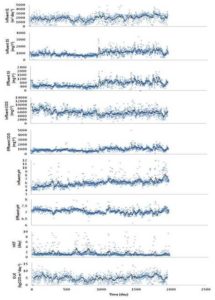
Fig. 2: Wastewater Characterization Study
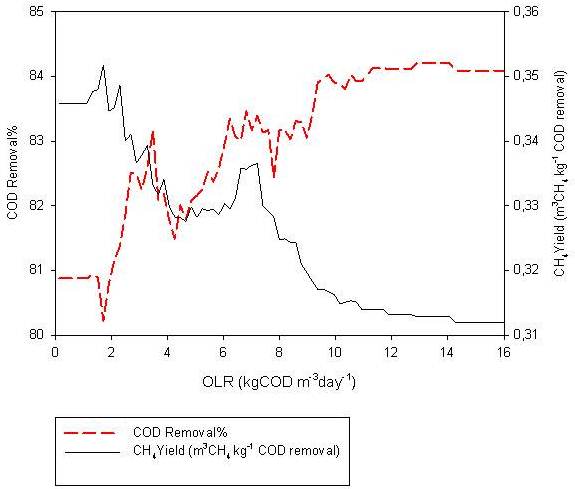
COD removal and methane yields are affected by organic loading rates (OLR) (Fig. 3). As seen in Fig. 3, OLR rates are in a large range between 1-16 kg COD m-3day-1, depending on the flow rates, on the other hand, COD removal efficiency of the EGSB reactor was quite acceptable varying between 80-84%. Methane yields were calculated to change between 0.30-0.35 m3 CH4 kg-1 COD removal. It was observed that as the OLR increases, the methane yield increases, especially above the OLR rates of 10 kg COD m-3day-1. Parawira et al. (2005) also reported a field scale anaerobic digestion of brewery wastewater where an UASB bioreactor configuration was employed with a low COD removal efficiency of 57% COD removal efficiency. It is obvious that the EGSB reactor system available at Türk Tuborg was performing significantly better with COD removal efficiency over 81%. EGSB reactors are known to accommodate higher OLR values which OLR is closely related to biodegradation kinetics and biomass inventory in reactor in biological treatment processes (Khanal, 2008). High organic loading rates can speed up acetogenic reactions resulting in buildup of VFAs and reduction of pH values. OLR also affects Food to Microorganism (F/M) ratio which is also another important operational parameter for system’s stability (Igoni, et al., 2008; Tchobanoglous, et al., 2003). In this study, even though the OLR values changed between 1-16 kg COD m-3day-1 throughout the study, the average OLR was between 6-8 kg COD m-3 day-1 OLR. Even 1 day HRT conditions resulted in high COD removal. Parawira et al. (2005) reported 57% COD removal under the operation conditions of 6 kg COD m-3day-1 OLR and 1 day HRT. Ling et al. (2004) reported performance of an EGSB reactor operating under acidic conditions (pH 6). COD removal efficiency of 95% was achieved with an OLR of 5 kg COD m-3day-1.

Fig. 3: COD Removal and Methane Production Performance of EGSB Reactor
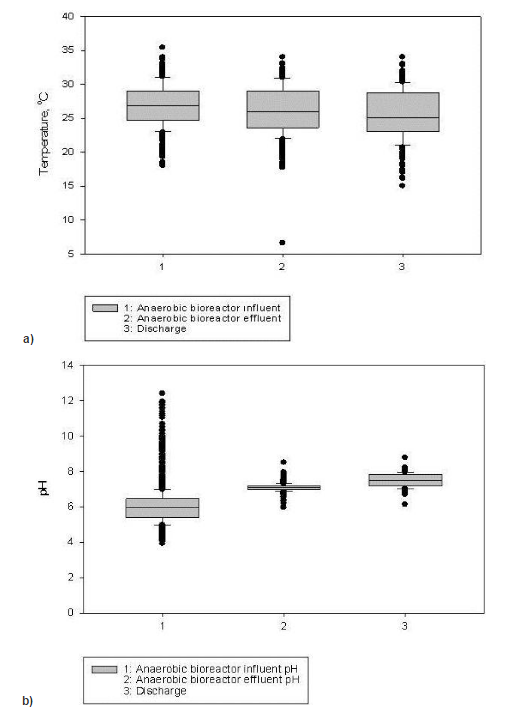
Temperature is another important parameter for both design and operation of anaerobic systems. Generally, external supply of heat is required in most anaerobic digester to provide optimum working conditions, especially for the maximum activity of the methanogenic groups in the anaerobic consortium. Therefore, an external isolation system to prevent the heat loss is also required (Speece, 1996; Igoni, et al., 2008; Alvarez, 2003). Tchocanoglous et al. (2003) reported that temperatures lower than 20oC slow down the microbial growth and increase the start-up period since 35±2oC is an optimum range for mesophilic systems in anaerobic bioreactors. Türk Tuborg Bira ve Malt Sanayi A.Ş. had approximately 18oC influent temperature in winter and 35oC during summer time. This temperature values correspond to an average temperature of 27±3.5oC in the EGSB reactor (Fig 4.a). Even though, there was no external heat application at the plant, EGSB reactor was able to operate with no significant problem and with high COD removal efficiency which is in compliance with the official discharge standards. Installation of an automatic temperature control system can easily improve biogas production yields.
The optimum pH changes for methanogens are approximately in the range of 6.5 to 8.2 (Speece, 1996). At low pH conditions acidogenes may repress the activity of methanogenes. Moreover anaerobic consortium starts to produce VFAs rather than bio-methane, so methane production yield decreases and CO2 content increases. In our study, pH values were in the optimum range (Fig 4.b) except for a few cases where a slight acidification was observed which did not affect the operation.

Fig. 4: a) Temperature, b) pH Value of Brewery Wastewater
Fig.5 shows that there is an interaction between alkalinity, pH and VFA concentration in EGSB reactor. While alkalinity neutralize the system, increasing VFA concentration decrease the pH value (acid buffer capacity). Alkalinity value around 2500 mg l-1 can protect the system from sudden decline of pH. Lettinga et al. (1997) suggested that anaerobic system alkalinity value must be higher than 1500 mg CaCO3 l-1. The VFA/Alkalinity ratio must be 0.1 to 0.3 in anaerobic system. As a matter of fact, actual ratio for VFA/Alkalinity in this study was around 0.29. The anaerobic bioreactor’s influent alkalinity value is nearly 9.45 mgHAc l-1 (472.5 mg CaCO3 l-1). VFA concentration in the reactor was less than 20 mgHAc l-1 (1000 mg l-1). VFA concentration affects the activity of both acetogenic and methanogenic bacteria. Acetic acid and butyric acids are the most commonly observed VFA’s in an anaerobic process (Khanal, 2008). All VFAs are converted into acetate in an anaerobic degradation process. The influent and effluent VFA concentrations for Türk Tuborg is 12.5 mgHAc l-1 (625 mg l-1) — 6.5 mgHAc l-1 (90 mg l-1) respectively. Demirci and Saatci (2003) reported VFA concentrations as 100-350 mg l-1 in a mesophilic anaerobic digestion process. Ozturk (2007) suggested VFA concentration should be lower than 1000-1500 mg HAc l-1 for preventing inhibition.
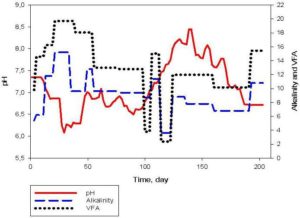
Fig. 5: Interaction between pH, Alkalinity and VFA in EGSB Reactor
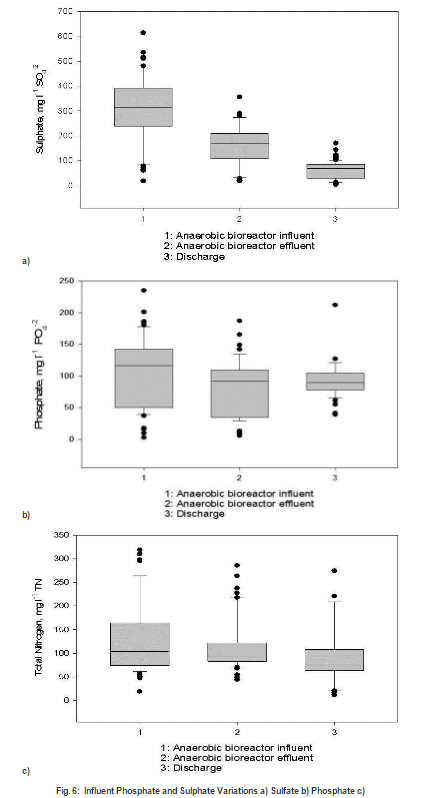
In anaerobic biodegradation sulphate and methane production values are important for H2S toxicity. Also COD/SO4ratio should be above 10 for process control. During the sulphate removal, COD removal can be negatively affected and biogas production can be inhibited. The COD/SO4 ratio in this study was 20 which is higher than 10 indicating that the process was in the safe range for this parameter (Fig. 6.a).
Phosphate is another very important parameter providing an optimum C/N/P ratio for methanogenic activity. The influent’s phosphate values were determined between 40-180 mg l-1 and effluent’s values were calculated between 30-120 mg l-1 (Fig 6.b). Nitrogen is also important for the C/N/P ratio and the bacterial activity (Ozturk, 1999). Especially, free ammonia concentration is of importance at pH>7.5. In this study, non-ionized NH3 concentrations were found to be between 50 to 200 mg l-1 which is in safe range (Fig. 6.c).

Result of BMP Experiments for Solid Wastes
In this study, Biochemical Methane Production protocol was used to investigate the bioenergy potential of solid wastes at Türk Tuborg plant. Anaerobic inoculum which was taken from Izmir-Pakmaya A.Ş was used throughout the BMP tests. Both total biogas and methane gas were measured continuously.
The organic solid waste generation in Türk Tuborg varies between 2250-3200 ton per month in parallel to the beer production which is in the range of 11000-16000 tons per month. In total, annual solid waste generation from beer production is estimated to be around 35000 tons per year in Türk Tuborg. In order to estimate the bioenergy content of these wastes, BMP tests were carried out for approximately 77 days using various solid waste materials as shown in Fig.7. As it is clearly seen from the lag time and total gas production values given in Fig.7, grid wastes seem to be more amenable to anaerobic digestion than malt wastes. Malt wastes started to produce biogas only after 20 days of incubation while the grid wastes started to show gas production in almost a few days of incubation. In terms of total biogas production, again the grid wastes produced much more biogas (1000 ml) than malt wastes (450 ml). It was also observed that increasing dry matter content in the reactors negatively affected the total biogas production. For example, malt wastes with a dry matter content of 10% produced a total of 1100 ml while the same solid substrate with a higher solid content (17.5%) produced only 450 ml biogas. The similar trend was also observed for grid wastes, the total gas production for dry matter content of 17.5% dropped from 1300 ml to 1000 ml. Methane content of the total biogas was started to be monitored in a few days of the incubation in all assays, except for the malt sample with a dry matter content of 17.5% which needed 20 days for the start of gas production. The maximum methane production was noticed after 55 days of incubation (Fig. 7). Biogas production in each test bottle continued at least for 75 days. All the biogas production values were normalized to a unit amount of solid material in each test bottle as shown in Table 3.
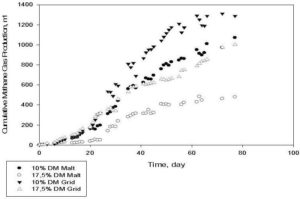
Fig. 7 Results of BMP Tests
Table 3. BMP Test Results for Anaerobic Digestion of Other Solid Wastes at Türk Tuborg
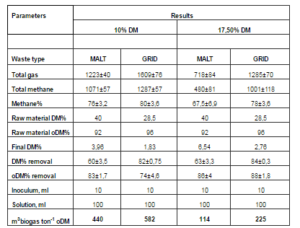
Maximum biogas production per ton of organic dry matter (581 m3biogas ton-1 oDM) was achieved with grid wastes having 10% dry matter content in the test reactor (Table 3). Malt wastes followed this with a value of 440 m3biogas ton-1 oDM when 10% dry matter in the test reactor was used. Both types of organic substrates showed a decreasing trend in unit biogas production as the dry matter content in the test reactors were increased from 10% up to 17,5 (114 and 225 m3biogas ton-1oDM for malt and grid wastes, respectively).
In regard to methane content of biogas in the head space of each test reactor, methane content was observed to vary between 68 and 78%. There was no statistical difference in methane content. Dry matter content of organic substrates used throughout the experiments was between 29 and 40%. It was seen that all the substrates were quite rich in organic material as indicated by the VSS (volatile suspended solids) measurements varying between 92 and 96%. oDM (Organic Dry Matter) removal efficiencies also indicated that grid wastes more amenable to anaerobic digestion than malt wastes. oDM removal values were between 82-84% for grid wastes, on the other hand, this value was only 60-63% for malt wastes. oDM removal values varied between 74-88% for all tests.
Table 4 shows literature values for biogas production values from various organic materials. In this study, biogas value per organic dry matter is in the range and nearly similar with organic municipal solid wastes. Food wastes, fruit and vegetable scraps have a higher biogas value per ton dry matter than brewery solid wastes. The biogas content per dry matter during the two-stage digestion of solid wastes are successful and in range between 514-728 m3 biogas ton-1 DM as shown in Table 4. Despite using batch system, malt and grid waste’s biogas value (581 m3biogas ton-1DM) is as higher as organic municipal solid wastes. Our results are comparable to those reported in the literature, although the differences in the waste and characteristics of the substrate(s) are believed to be the major reason for the difference in biogas content.
Table 4. Comparison of the Results with Literature Values
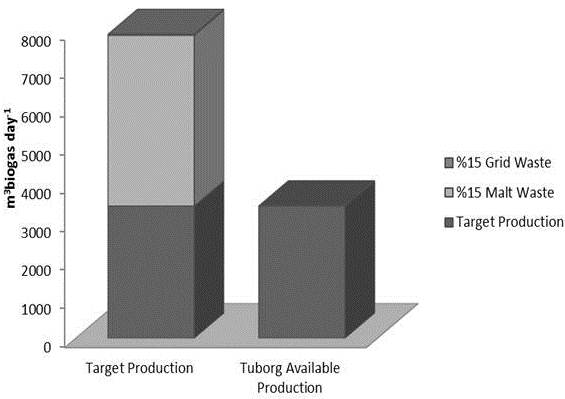
Brewery wastes are bulky material with high moisture content. The bulk of the organic waste arising as spent malt and hops has traditionally been categorized as food grade allowing a direct recycling to agriculture, either as animal feed or soil improver (Thomas and Rahman, 2006). Türk Tuborg plant also valorizes these organic materials as animal feed but now there seems to be a better option for valorization of these materials as bioenergy. The current biogas production at Türk Tuborg plant is around 3900 m3biogas day-1 (Fig. 8). Use of malt and grid waste as bioenergy sources seems to provide a significant increase in energy production from waste material.
Fig. 8: Contribution of Solid Wastes in Overall Energy Budget
Conclusion
Waste management in breweries remains a critical and practical problem. Brewing industries exhibit a wide range of production capacities, which induces a strong difference in waste management. All breweries try to keep disposal costs low whilst the legislation concerning waste disposal is becoming more and more stringent. Spent grains, Kieselguhr sludge, yeast surplus and waste labels represent the most important wastes. The most common disposal alternative is to sell these wastes as feed for livestock. However, other technical alternative such as biofuel production via anaerobic biological approach appear to be promising due to the sustainability advantages of the final products (bio-methane and potential fertilizer).
All malt waste anaerobic biodegradation options used in this study has a good and high biogas production. In terms of improving anaerobic biological degradation of raw organic matter available, malt waste provided the best results.
As a conclusion, it was found that the potential of extra biogas production from the brewery solid waste is obvious. Türk Tuborg will be a good reference for the anaerobic bioconversion of solid wastes into bioenergy and for the reduction of carbon emissions.
Acknowledgments
The authors wish to thank Türk Tuborg Bira ve Malt Sanayi A.Ş. for economic and technical support.
References
Alvarez, J. M. (2003). Biomethanization of the Organic Fraction of Municipal Solid Wastes, Iwa Publishing, 1-43.
Publisher – Google Scholar
A. P. H. A., A. W. W. A. & W. P. C. F. (2001). ‘Standard Methods for the Examination of Water and Wastewater,’American Public Health Association, Ed. Washington, D.C.
Bolzonella, D., Pavan, P., Mace, S. & Cecchi, F. (2006). “Dry Anaerobic Digestion of Differently Sorted Organic Municipal Solid Waste: A Full-Scale Experience,” Water Science and Technology, 53(8) 23-32.
Publisher – Google Scholar
Demirci, Y. & Saatci, Y. (2003). “Bira Anaerobik Çamur Çürütme Sisteminde Çeşitli Yük Parametrelerinin Sistem Verimine Etkileri,” Fen ve Mühendislik Bilimleri Dergisi, 15(3) 337-348.
Publisher
Driessen, W. & Vereijken, T. (2003). “Recent Developments in Biological Treatment of Brewery Effluent,” The Institute and Guild of Brewing Convention, Livingstone, Zambia, March 2-7, 2003.
Publisher – Google Scholar
Fillaudeau, L., Blanpain-Avet, P. & Daufin, G. (2006). “Water, Wastewater and Waste Management in Brewing Industries,”Journal of Cleaner Production, 14 (2006) 463- 471.
Publisher – Google Scholar
Igoni, A. H., Ayotamuno, M. J., Eze, C. L., Ogaji, S. O. T. & Proberd, S. D. (2008). “Designs of Anaerobic Digesters for Producing Biogas from Municipal Solid-Waste,” Applied Energy, 85 (2008) 430—438.
Publisher – Google Scholar
Jurado, J. (2011). “Reducing Waste in Beer Production 2011,” [http://www.alfalaval.com/about-us/press/product-press/Pages/reduced-waste.aspx]
Publisher
Khanal, S. K. (2008). “Anaerobic Biotechnology for Bioenergy Production: Principles and Applications,” John Willey & Sons, USA
Publisher – Google Scholar
Lee, J. P., Lee, J. S. & Park, S. C. (1999). “Two-Phase Methanisation of Food Wastes in Pilot Scale,” Applied Biochemistry and Biotechnology, 77(79) 585—593.
Publisher – Google Scholar
Lettinga, G., Field, J., Lier, J. V., Zeeman, G. & Pol, L. W. H. (1997). “Advanced Anaerobic Wastewater Treatment in the Near Future,” Water Science and Technology, 35(10) 5-12.
Publisher – Google Scholar
Ling, X. F., Zuo, J. E. & Gu, X. S. (2004). “Study on the Operation of a Methanogenic EGSB Reactor under Acid Condition at pH 6.0,” Enviromental Science and Technology, 25(1) 57-6
Publisher – Google Scholar
Owen, W. F., Stuckey, D. C., Healy, J. B., Young, L. Y. & McCarty, P. L. (1979). “Bioassay for Monitoring. Biochemical Methane Potential and Anaerobic Toxicity,” Water Research, 13: 485.
Publisher – Google Scholar
Ozturk, E. (2007). ‘Peyniraltı Suyunun Anaerobik Arıtma Çamuru Reaktörü Arıtımında en Uygun Koşulların Belirlenmesi,’Gazi Üniversitesi Fen Bilimleri Enstitüsü, Ankara.
Ozturk, I. (1999). “Anaerobik Biyoteknoloji ve Atık Arıtımındaki Uygulamaları,” İ.T.Ü İnşaat Fakültesi, Istanbul.
Publisher
Parawira, W., Kudita, I., Nyandoroh, M. G. & Zvauya, R. (2005). “A Study of Industrial Anaerobic Treatment of Opaque Beer Brewery Wastewater in a Tropical Climate Using a Full-Scale Uasb Reactor Seeded with Activated Sludge,”Process Biochemistry, 40(2005) 593—599.
Publisher – Google Scholar
Pekin, G., Haskök, S., Sargın, S., Gezgin, Y., Eltem, R., Ikizoglu, E., Azbar, N. & Sukan, F. V. (2010). “Anaerobic Digestion of Aegean Olive Mill Effluents with and without Pretreatment,” Journal of Chemical Technology and Biotechnology, 85(7) 976-982.
Publisher – Google Scholar
Qiao, W., Yan, X., Ye, J., Sun, Y., Wang, W. & Zhang, Z. (2011). “Evaluation of Biogas Production from Different Biomass Wastes with/without Hydrothermal Pretreatment,” Renewable Energy, 36(12) 3313-3318.
Publisher – Google Scholar
Speece, R. E. (1996). Anaerobic Biotechnology for Industrial Wastewaters, Archae Press, USA, 3-36.
Publisher – Google Scholar
Speece, R. E., Boonyakitsombut, S., Kim, M., Azbar, N. & Ursillo, P. (2006). “Overview of Anaerobic Treatment: Thermophilic and Propionate Implications,” Water Environment Research, 78: 460- 473.
Publisher – Google Scholar
Tabatabaei, M., Rahim, R. A., Abdullah, N., Wrighte, A.- D. G., Shirai, Y., Sakai, K., Sulaiman, A. & Hassan, M. A. (2010). “Importance of the Methanogenic Achaea Populations in Anaerobic Wastewater Treatments,” Process Biochemistry, 45: 1214—1225.
Publisher – Google Scholar
Tchobanoglous, G., Burton, F. L. & Stensel, H. D. (2003). ‘Waste Water Engineering: Treatment and Reuse,’ Tata McGraw-Hill Publishing Company Limited, New Delhi; 1819.
Google Scholar
The Brewers of Europe, (2004). [25.10.2013]. Available: http://www.brewersofeurope.org/docs/publications/pdf-Mei04.pdf
Publisher
Thomas, K. R. & Rahman, P. K. S. M. (2006). “Brewery Wastes: Strategies for Sustainability: A Review,” Aspects of Applied Biology, 80: 147-153.
Publisher – Google Scholar
Viturtia, A., Mata-Alvarez, J., Cecchi, F. & Fazzini, G. (1989). “Two-Phase Anaerobic Digestion of a Mixture of Fruit and Vegetable Wastes,” Biological Wastes, 29:189—99.
Publisher – Google Scholar
Weiland, P. (1993). ‘One and Two Step Anaerobic Digestion of Solid Agro Industrial Residues,’ Water SciTechnol , 27:145—51.
Weiss, A., Jerome, V., Burghardt, D., Likke, L., Peiffer, S., Hofstetter, E. M. et al. (2009). “Investigation of Factors Influencing Biogas Production in a Large-Scale Thermophilic Municipal Biogas Plant,” Applied Microbiology and Biotechnology, 84: 987—1001.
Publisher – Google Scholar
Wijekoon, K. C., Visvanathan, C. & Abeynayaka, A. (2010). “Effect of Organic Loading Rate on vfa Production, Organic Matter Removal and Microbial Activity of a Two-Stage Thermophilic Anaerobic Membrane Bioreactor,” Bioresource Technology.
Publisher – Google Scholar