Introduction
This section should follow keywords. This section should provide background of the study and highlight research motivation. The issue of appraising intangible assets, and specifically trademarks, is discussed extensively in specialized literature (Čižinská & Krabec, 2013a, 2013b, Gerzema, Lebar, 2008, Hubbard, 2010, Krabec & Čižinská, 2013, Murphy, 1990, Perrier, Stobart, 2008, Salinas, 2009); among other things, this is because intangible assets are becoming more and more important within intensifying competition in hypercompetitive, more and more saturated, product markets.
In appraising intangible assets of unlisted companies operating in developing markets, appraisers have to face the problem of the lack of empirical data, or their low quality. This makes the application of standard methodology used for appraising identifiable intangible assets disputable. Within this paper, possible approach to appraising the fair value category of trademark of an unlisted (private) company will be suggested. Our ambition is to solve these methodological issues in a way that will have a sufficiently informative value that will enable that the resulting valuation may be seen as a valuation of the selected and/or assigned category of the value of the particular assets. For many reasons presented below, the valuation of identifiable intangible assets is even more difficult than the valuation of a business as whole.
First of all, the main categories of the value usable for the purposes for which intangible assets are normally appraised will be summed up. Then we will deal with problems that appraisers have to face in appraising intangible assets of unlisted private companies. On the basis of that analysis, we suggest the VIM model (Verifiable Interdependent Model), which has been designed specifically for the conditions of use in this environment. This is followed by a case study, where the application of the model is demonstrated, and the informative value of the obtained results is evaluated.
The Fair Value Category for Appraising the Trademark of an Unlisted Company
Within the established practice of assets valuation, specialised literature, property valuation professional standards, and, last but not least, applicable legal regulations of the Czech Republic normally respecting the fact that the value and the method of being derived is always exclusively relevant for the appraised object, appraised subject(s), and the purpose for which the value of the appraised object is determined with respect to appraised subjects. At the same time, the established rules also provide recommendations, or even define a duty to apply particular valuation methods. In some cases, the methods have to be applied in a particular way in order to guarantee and maintain a sufficiently reliable and demonstrable link between the object, subject(s), and purpose of the valuation. It can be generally stated that the methods which can be used for valuation in a particular case are predetermined by the selection of an object, subjects, and purpose of the valuation; this predetermination follows from established assets valuation best practice rules, valuation standards, or applicable legal regulations. Therefore, the result of the valuation does not and may not have any general “transpersonal” validity; it applies only within its definition by the object, subject, and purpose.
Frequent orders for the valuation of a certain type were standardised in the form of the so-called value categories. The selection of a value category is based either on the assignment or on the purpose for which the identifiable intangible assets are appraised. In this case, the valuation will be conducted within the fair value category, according to the definition of this term in the latest edition of the International Financial Reporting Standards, IFRS 13 Fair Value Measurement standard, where the fair value category is defined as follows: “This IFRS defines fair value as the price that would be received to sell an asset, or paid to transfer a liability in an orderly transaction between market participants at the measurement date.”
Valuation Methods
The value and appraisal of a trademark is based on its economic benefit to its owner or the business that owns the trademark. Products and services produced by a business with a successful trademark are sold at premium prices. The business owning the trademark receives this bonus because it can sell at higher prices than its rivals who are either without a trademark or with a weaker trademark, or because it sells and produces more, and thus it has saved more fixed costs per production unit.
All methods of appraising the fair value of a brand are based on three approaches (see Čižinská & Krabec, 2013a, IFRS 13, IVS, 2011, Krabec, 2009, Svačina, 2010):
- Comparability approach – this approach is based on the balance principle = competitive intangible asset markets are able to create balanced prices of intangible assets with a comparable utility. This approach serves as the basis for the “market multiples method”.
- Cost approach – based on the principle of economic substitution = a prospect is not willing to pay more for the relevant assets than he would spend on their creation. In this case, we consider two types of costs: reproduction costs and substitution costs.
- Income approach – based on the expectation principle = a prospect is not willing to pay more for the relevant assets than the present amount of expected income from the use of the assets.
The following list of normally applied methods is based primarily on the work of Čada (2007), Gerzema, Lebar (2008), Hubbard (2010), Krabec (2009), Murphy (1990), Perrier, Stobart (2008), Salinas (2009), subject to partial terminological and factual modifications made for the purposes of their application.
Benchmarking Valuation Approach
In appraising unitary and multiple assets by benchmarking (market) methods, it is important to consider the quality of historic balanced prices (comparable market data), which comparable assets, or directly the assets in the relevant market, used to be traded at. If the conditions of the operation of an identical active relevant market have not changed, and if the data used is reliable, it will be possible to find out quite reliably, what the price which the appraised assets would be traded at under standard conditions would be. If the market works effectively, the benchmarking approach should be preferred, because the working market provides valuation involving preferences and expectations of market makers. This knowledge is also important, because it reveals the fact that although forward-looking income-based valuation determines the present value of expected future cash flow, but it entirely abstracts away from the importance of the relationship between the supply and demand side of the market. Again, it is important to differentiate between the ex ante and ex post valuation. In the case of the ex ante valuation, the application of benchmarking methods based on data obtained from the competitive market is more reliable because we summarise and use data resulting from shown preferences of market makers (regardless of the fact whether they are based on a correct or incorrect understanding of the present and future), which is not enabled by methods based on the capitalisation of cash flow or profit. The ex post approach, following the appraised transaction, enables legitimising the valuation, based on expected income only by the fact whether market makers accept it or not. Neoclassical models of the capital market do not have to face these practical problems, because they expect that transactions are carried out in a perfect market, so all expectations are homogeneous and perfect.
The key (traditional) methods include (see also the OECD Transfer Pricing Guidelines for Multinational Enterprises and Tax Administration):
- a) Comparable Uncontrolled Price Method (CUP) – is a relatively simple method based on the comparison of prices. Unfortunately, in the case of intangible assets, applied market prices will not usually be known at all (domain names sold at auctions can be a certain exception).
- b) Resale Price Method (RPM).
- c) Cost Plus Method (COST +).
Cost Based Valuation Methods
The Reproduction Cost Method Is based on the creation of a true copy of the appraised intangible assets, including wear and tear as at the valuation date, which represents a decrease in the utility of created assets. This approach requires the use of original inputs and procedures which, however, are priced as at the valuation date.
The mathematical formulation of the reproduction costs:
HNA = 
Ni……………… The costs of creating the original intangible assets
ICPI…………. The rate of change in the costs from the expenditure date (t) to the valuation date (T), measured by an appropriate price index
i ……………. The opportunity costs
A…………….. Amortisation
TAB………….. Benefit from tax amortisation of intangible assets
The Replacement Cost Method Is based on the creation of intangible assets with a comparable utility by means of new, effective inputs and procedures available as at the valuation date.
HNA = 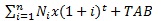
Ni…………….The costs of creating the intangible assets with a comparable utility
For both methods, cost items, which must be included in the valuation, are identical:
- Costs of creating a logo – this amount includes the following basic cost items: logo graphic designs, tenure, licence to use;
- Protection of industrial rights, which consists of two items: the costs of the protection and the costs of services provided by a patent agent;
The Concept of Tax Amortisation Benefits of Cost Methods: In addition to normally calculated benefits from using intangible assets, standard transactions involving intangible assets also bring an additional benefit in terms of taxes. This benefit results from the possibility of depreciation of purchased intangible assets, which leads to lower income tax, i.e. savings on the grounds of tax amortisation. The savings on the grounds of tax amortisation should be reflected in the real value if the savings are generally available to a typical buyer in the market. The increase ratio, which multiplies the value without tax benefits, has the following form:
Increase coefficient = 
Tax shield present value = = 
Where
n……………. Number of years of tax depreciation of intangible assets
Ot…………… Relative proportion of tax amortization in year t
Dt…………… Applicable corporate income tax rate
i……………. Discount factor in year t
These methods can be applied to almost all intangible assets, for which their owner kept detailed records of the cost of creating those assets. These methods should be used for solutions protected by patents and utility designs in the early stages of their lifecycle without specific concept, where we cannot estimate, or it is very difficult to estimate their future application and resulting earnings. Considerable imbalances between the costs of creating the relevant assets and the benefit brought by the established intangible assets to a business militate against these methods.
Income Based Methods of Determining the Value of a Brand
These include the relief-from-royalty method, incremental cash flow method, financial indicator capitalisation method (either capitalisation of adjusted cash flow or the EBIT-level profit) and adjusted discounted cash flow method.
The Incremental Cash Flow Method (see also Brigham, Erhard, 2005) is based on a price and volume premium, which can be obtained on the grounds of ownership of a strong brand. The premium is determined as the difference between the price charged by a company owning the appraised brand and the price of the cheapest rival selling a comparable product. The volume premium is based on a thesis that the brand sells a higher volume of products, and is determined as the difference between the average volume of products sold under the appraised brand and a comparable rival (again, the same rival is considered). The obtained income is reduced by the costs connected with reaching the considered income. The EBIT-level cash flow is adjusted by the brand relevance in buying decisions1, corporate income tax, and investment in working capital. Free cash flow is then discounted to the present value. In order to calculate the terminate value, the Gordon’s formula is applied (see e.g. Koller, Goedhart, Wessels, 2010).
| 1 The calculated cash flow is generated by all intangible assets, such as customer relations, distribution channel. In order to separate the cash flow related to the brand, brand relevance in the buying decision is considered. |
The Relief-from-Royalty Method (“RfR”) is based on determination of a royalty rate, application of planned income, cash flow taxation, and discounting to the present value. The royalty rate was determined on the basis of the Knoppe formula, which says that the royalty rate ranges from 25 to 33% of the EBIT margin (see Knoppe, 1972, s. 108).
The BEVA – Brand Equity Valuation for Accounting method is based on the RfR income based method, but a royalty fee is referred to as a brand profit rate (“BPR”). As for the calculation method, it is the ordinary discounting of cash flow. The method consists of the determination of BPR, calculation of cash flow by multiplying BPR and future income obtained from a financial plan, corporate income tax deduction, and discounting to the present value.
BPR is derived from the brand strength and usual range of royalty fees applicable to this segment (the range is given by the experience of the appraiser). The brand strength is determined on the basis of a five-level brand leadership model. The five levels reflect the following areas of the brand:
- Functional status of a brand (perceived quality, legal protection),
- Market status (higher degree of recognition and distribution),
- Psychographic status (strength, quality, unique associations, brand personality),
- Brand identity (brand popularity, brand interaction – brand community, trust in the brand, brand identification, brand alliance, benefit from use), and
- Brand myth (providing individual and social values, tradition, originality, inaccessibility, desire, timelessness, a product giving the meaning of life).
The individual levels represent the maximum number of points that can be acquired by a brand. The brand usually acquires points by polling customers in the form of special questionnaires with closed questions created for each brand. Researchers are trained on how the answers are to be analysed. The process of allocating points is known as the brand strength score. On the basis of the brand strength score, an increment in BPR is calculated. A non-adjusted BPR is calculated by totalling all of these increments for all five levels. The resulting BPR is then adjusted according to the fact how important the brand is in buying decisions. A discount rate was determined on the basis of the weighted average cost of capital (“WACC”).
Valuation by using the profit capitalisation income based method has two basic components: determination of the brand strength compared to competitors, and determination of the achievable profit in the market by entities under consideration (i.e. companies owning the appraised brand and their rivals). The brand valuation is based (especially for the purposes of determining the brand strength) on the following indicators: market attractiveness (market volumes and growths; power to break through in the market (market share and its growth); acceptance by customers (brand recognition and brand relevance); presence in the market (distribution channels).
On the basis of these factors, the strength of the appraised brand and the strength of considered competitive brands is analysed by means of scoring models. It leads to the allocation of brand strength in % to all brands under consideration, so that the sum of all allocated % amounts to 100% (the strongest brand holds the highest share in %, the weakest one holds the lowest share). The next step is to determine attainable profit in the market, which can be accomplished by means of the segment benchmarking based approach.
Similarly, the profit share method presented by Svačina (2010) is formulated. The principle of this method is to appraise the value of intangible assets by the discounting of shares in profits resulting from the use of the assets to the present value. Actually, this profit share estimates the potential market level of a royalty.
Mathematical formulation
HNA = 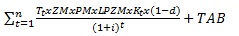
Tt…………… Expected volume of sales of products containing the appraised intangible assets
ZM…………. Profit margin from the sale of the product
PM…………. Share of the intangible assets
LPZM……… Royalty rate expressed from the profit
Kt………….. Obsolescence rate
i…………….. Opportunity cost
t…………….. Remaining lifetime of the intangible assets
TAB………… Intangible assets tax amortisation benefits
The profit share method combines the income based approach and the benchmarking approach. Although this method is less precise than the royalty analogy method, it brings us important information about the relationship between the profit and hypothetical royalties. This method reflects the owner’s expectations of future earnings from the relevant intangible assets. It should mainly be applied to established assets where future earnings can be predicted.
Earnings before interest and taxes (EBIT) are the basic parameters for its calculation for the following reasons:
- The influence of financial and capital policies of a business, which is reflected in the debt ratio, and thus through outstanding interest in profit from ordinary activities or profit for an accounting period, must be excluded from the market valuation;
- The impact of taxation should be excluded.
Also, the operating profit should not include non-operating transactions.
In appraising based on this method, profits on any of the three possible levels can be used:
- Profit of a business – offers the expression of actual profitability of the relevant production; on the other hand, the relevant business can achieve much lower or higher profits than other business enterprises.
- Profit of comparable competitive business enterprises – provides more suitable data in terms of valuation, because it takes more probable prospects into consideration.
- Industry middle value profit (average, median value) – it is a neutral solution, which, however, can be disputable, especially in segments with a high dispersion of business sizes. If the segment profitability is much lower than the profitability of the owner of the intangible assets, it can cause problems too.
The real value concept agrees best with the use of a middle value of profitability of comparable competitive business enterprises in combination with the profitability of the owner’s business.
The Method of Discounted Cash Flow Attributable to the Brand is based on the prediction and quantification of the EVA economic profit of a business as a whole. The key step with respect to the brand value is to determine its impact on the business’s ability to generate economic profit. We can refer to this impact as brand relevance, and to the portion of economic profit which corresponds to brand relevance, as the cash flow attributable to the brand. Brand relevance should be expressed in %. The quantification of this relevance is based on the study and analysis of behavioural aspects of purchasing behaviour, which is aimed at finding out which factors influence purchasing behaviour, and what is most important for them.
According to IDW S 5, within the quantification of cash flow attributable to the brand, it is necessary to consider tax amortisation benefits, like in the case of cost methods.
Duration of the future period, for which the brand cash flow is predicted, should correspond to a time horizon of the brand “lifetime”. In other words, like in the case of appraising a business as a whole, the going concern principle cannot be generally assumed with respect to the brand cash flow automatically and without any proper justification. As a benchmark for defining the economic life of the brand, IDW S 5 recommends applying the product lifecycle analysis.
In order to determine the income based value of a brand by using this method, the cash flow attributable to the brand, predicted for an economically justifiable period for which its economic life can be predicted, should be discounted to the present value by an appropriate and reasonable discount rate. In this connection, the Absatzwirtschaft study (2004) refers to the possibility of adjusting the corporate WACC rate by the brand strength by means of a transformation curve. This should only reflect specific risks related to these intangible assets and their ability to generate expected cash flow. The brand strength must be determined at least partly on the basis of the behavioural aspect analysis. In the Absatzwirtschaft study (ibid), brand strength is associated with the analysis of seven factors – market, stability, market leader, brand promotion, brand development trend, international recognition, and protection. Brand strength is based on the scoring of these factors, which enables drawing the aforesaid transformation curve, which transforms the score into the risk-free rate premium.
VIM Model – Combination of Methodical Approaches
In applying the aforesaid basic or somehow modified valuation methods, appraisers usually obtain results which differ significantly. This is usually caused by the subjectivity of parameterisation of relevant valuation models, and mainly by the lack and/or high scatter of market data. Therefore, we suggest the following combined application of competitive/market, cost and income based methods so that the results obtained from independent, mutually confirming calculations can be verified.
We have suggested a phase VIM model (Verifiable Interdependent Model), where the calculation procedure includes steps in the following order:
First Step: Calculation of the Enterprise Value of the Whole Company
All other calculation steps are based on the valuation of a real value of the capital invested in the business enterprise. In our opinion, this interim step is inevitable primarily for two reasons:
- Deriving of a real capital structure and/or real amount of WACC, the value of which is used in the calculation of brand value by income based valuation methods (step 3),
- Estimation of hypothetical market capitalisation of equity and/or Enterprise Value, in relation to which the benchmarking of values of intangible assets can be carried out according to parameters obtained from comparison to listed companies operating in the same industry.
With regard to the VIM model structure, the sequence of steps in the whole procedure and the requested information inputs, it is appropriate to use one of the income based methods for the calculation, preferably the economic value added (EVA) method.
Interim Step: Partial Analysis of Financial Brand Impact and Its Evaluation
Financial brand impact can be evaluated by using the results of the strategic and financial analysis. As described in the section dealing with the method of discounted cash flow attributable to the brand, brand impact should be reflected in the WACC value by “financial brand impact adjustor” (brand WACC = enterprise WACC / brand impact adjustor) which results in a discount rate necessary for the income based valuation of the brand (step 3).
At this moment, the economic lifetime of the brand can be justified and, in reasonable cases, arguments can be provided to support the assumption of a going concern. As mentioned above, an analysis of the lifecycle of a product related to the brand can be a useful benchmark here.
Second Step: Application of the Benchmarking Valuation Method
The benchmarking approach is based on the application of multipliers resulting from the share of a price of comparable intangible assets on the selected economic characteristics related to those assets. It is evident that the existence and availability of market prices of intangible assets and ensuring their sufficient similarity will be difficult on this level. However, as for the accuracy and informative value of VIM model results and their mutual comparability, it turns out that it is more than appropriate to apply this interim step. The values of various multipliers can be found in many empirical surveys, e.g. the long-term quantitative research of the Corporate Branding Index® by the CoreBrand company, which works with the contribution of the brand value to the market capitalisation of the business.
Third Step: Application of Income Based Valuation Methods
Within the calculation of the enterprise value of a whole company in step 1, parameters and assumptions of the income based value of the business were derived and justified. We first determine the brand value using “premium method”based on the estimated increase in sales of branded business, compared with sales of “benchmark” and increased operating margin of the branded business compared to “benchmark”. We start therefore from the total change in profit that was initiated by the branding of the production, mainly due to volume and price premiums, which the company acquires through the brand that, in comparison with the competition without a brand or a less established brand can afford to sell at a higher price (or simultaneously) achieves higher sales volumes (see also Smith, 1996, Smith & Parr, 2000). A benchmark here means a hypothetical company that achieves results at the level of sector-percentile values. Specific percentile is yet determined depending on the structure and branding of the production in the industry in which the company operates.
In the first interim step following after the calculation of the enterprise value of a whole company, a corporate discount rate was transformed into a discount rate corresponding to the brand-specific risk on the basis of the evaluation of brand impact. In order to determine the income based value by methods of discounted cash flow attributable to the brand, brand impact level is used to identify the portion of economic profit (EVA) attributable to the brand. The cash flow attributable to the brand is discounted at a discount rate adjusted by the brand impact. The following steps follow the common practice in determining the value of a business by the economic value added method.
The calculated income based value of the brand by these two methods (EVA attributable to the brand and “premium attitude”) is an important information input for the calculation of an implicit royalty rate. The procedure is similar to the valuation of a business by the method of discounted cash flow, the operating profit being replaced with the total income and implicit royalty rate. Such “profit” is subject to an effective income tax rate. Then, investment that is necessary in order to ensure and maintain the brand value driving, is deducted. This determines free cash flow on the FCFF level.
The real nature of the calculated implicit royalty rate must be evaluated in the context of available information about market transactions. There are many commercial databases and empirical surveys. In this context, solutions of Svačina (2010), who talks about relatively high constancy of royalty rates in terms of time, which is, however, connected with their high variance, are positive (see also an another perspective in Koleňák & Koleňáková, 2012).
Fourth Step: Calibration and Reconciliation of Results
The last step involves a detailed study of differences in results, if any, detailed economically and methodologically justified calibration of model parameters of income based valuation and further specification of empirical methods according to step 2.
Financial Brand Impact Adjustor
In the VIM model the financial brand impact adjustor is used in two ways: first by using the reagence function (brand WACC = enterprise WACC / BIA) which affects the brand associated WACC which is needed for deriving the present value of the brand relevant cash flows and, second, the BIA determines the factual level of the brand relevant cash flow in the particular year (EVA attributable to the brand = EVA on the enterprise level * BIA).
The BIA can reach from -100 % up to + 100 %. The derivation of the BIA is based on the examination of stability, extent, and growth of the brand using the comparative list of competitive brands and other empirical benchmarking methods, verifiably providing key indicators of brand performance. All brands in the market are evaluated on the basis of mutual measuring, which leads to relevant scoring classification for the appraised brand. The total score can range from 0 to 100.
Case Study: Valuation of the XYZ Brand Owned by XYZ HOLDING
XYZ HOLDING operates in the area of light engineering, which is highly fragmented. A market study of that segment mentions more than 5000 producers worldwide. The study divides world producers into three groups according to their turnover: big companies with the turnover exceeding 1 billion USD; medium-sized companies with earnings ranging from 100 million to 1,000 million USD; small companies with earnings under 100 million USD. The highest number of producers is among small and medium-sized companies, frequently of a family type. Only a few companies are daughter companies and branches of listed parent organisations, and only a small group of producers are traded on stock exchanges.
In this industry, key value drivers include technologies, design, marketing, manufacturing processes, and research and development. After-sales services – supply of spare parts, installation, and checks – constitute a crucial part of this industry.
Manufacturing of products of a relevant market segment is correlated with the total economic climate and the amount of investment in key segments, which includes especially water management, paper industry, power engineering, food industry, civil engineering, chemical industry, and petrochemical industry. With regard to this wide range of segments, the sector achieves a stable and steady growth without significant fluctuations, unlike other industrial segments.
In the context of the global market of the relevant production, XYZ HOLDING is a relatively small company. Export is becoming more and more the main source of earnings and operating profit, where the XYZ brand has to face strong competition from many world brands. Therefore, turnkey supplies and complex services consisting of supplies as well as installation and service are becoming a competitive advantage. A permanent presence via local representation is important here. Customer stability is also supported by long-term activity in key operated markets. Positive references from accomplished orders create conditions for the growth of other foreign activities. Another strength of the XYZ brand is its legal protection and renowned status. In 2009, it was registered as a Community brand, and enjoys protection in all member states of the European Union. The questionnaire research conducted in the domestic market confirms a strong association of the brand with the product and recognition of XYZ HOLDING as the leading manufacturer of the product.
Evaluation of XYZ Financial Brand Impact and Determination of a Brand Impact Adjustor for the Purposes of Brand Discount Rate Evaluation
In order to evaluate brand impact, brand analysis, which is based on the examination of key brand performance indicators such as stability of the turnover, extent, and growth of the brand sales comparing to the comparative list of competitive or similar brands was applied. Brand impact of the brand XYZ is 20%, resulting in sales volume premium of 33 % compared to the benchmark. Brand impact adjustor produces brand value discount rate 10.27 % compared to company WACC 12.86 %.
Valuation of Equity of XYZ HOLDING by Income Based Methods
The business valuation is based on an income based potential as at the valuation date. Basically, the income based potential lies in the business prospects known as at the valuation date. The appraisable income based potential contains all chances resulting from measures taken prior to the valuation date, or from sufficiently specified measures within the current business concept and generally known market information. Possible measures (e.g. expanding investment/disinvestment), which, however, have not been specified sufficiently so far, and also financial surplus allegedly arising from them, will not be taken into account in calculating the objectified values of the business. A financial plan for valuation purposes is based on the analysis and prognosis of value drivers (see Mařík et al., 2011 and many others).
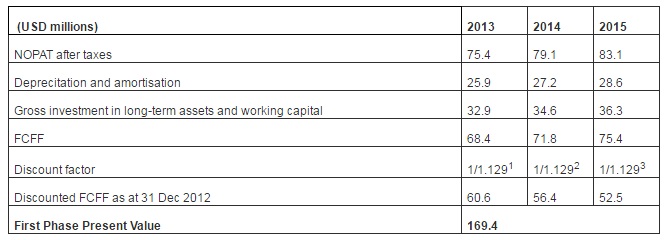
The valuation was performed by the DCF entity income based method and the economic value added method; in both cases, we used the same parameters. The conducted analysis proved that the conditions of a going concern have been met. For such a long period of time, it is usually impossible to plan cash flow for individual years, so we applied the standard two-stage method which is usually applied in practice. The basic parameters of the plan for the period of the first stage of the valuation process (years 2013, 2014, and 2015) were borrowed from the plan provided by the management of XYZ HOLDING. The calculation of the ongoing value requires the selection of parameters of infinite time series of cash flow. In particular, it is an expected rate of growth of free cash flow during the second stage (g) and return on net investment (rI) calculated as a ratio of the total increment of the operating profit after taxes and increment of the invested capital in the previous year. From the long-term point of view, the g/rIratio corresponds to the investment rate (mI), which is a share of profits devoted to net investments. On the basis of industry analysis and current and planned results of XYZ HOLDING, it was estimated that the rate of growth (g) was 5%, investment rate was 9.3%, and the corresponding return on investment was 53.8%. The income based value was calculated by the standard method described in literature (e.g. Mařík, 2011). Table 1 shows the calculation of the present value of the first stage of valuation based on the DCF entity method.
Table 1: Calculation of the Present Value of the First Stage of Valuation Based on the DCF Entity Method
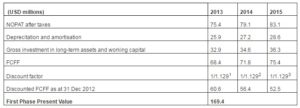
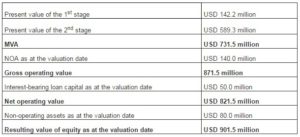
Free cash flow in 2016 (i.e. in the first year of the second stage of the valuation process) is based on NOPAT after taxes for 2014 increased by the rate of growth and decreased by the investment in operating assets, i.e.:FCFF2016 = NOPAT2015 * (1+ g) * (1 – mI) = 83.1 * (1 + 5%) * (1 – 9.3%) = USD 79.2 million. On the basis of that the ongoing value of USD 1,105.1 million was calculated by means of a parametric formula and Gordon’s formula. The calculation of the resulting value of equity is shown in Table 2.
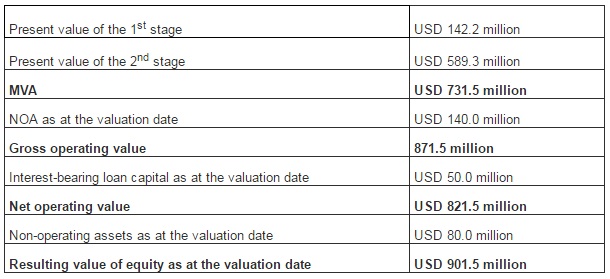
Table 2: Calculation of the Resulting Value of Equity of XYZ HOLDING as at 31 December 2012 by the DCF Entity Method
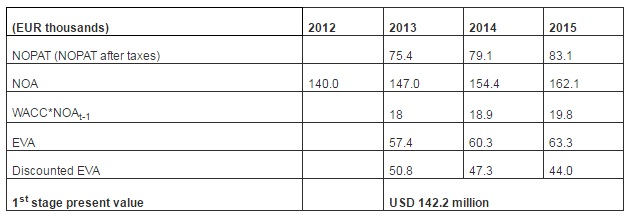
Tables 3 and 4 show that the valuation of equity of a business based on the economic value added method, provided that the parameters are equal, brings approximately the same result as the DCF entity method. For the explanations of possible differences, see Mařík (Volume II, 2012).
Table 3: Calculation of the Present Value of the First Stage of the Income Based Valuation by the EVA Entity Method
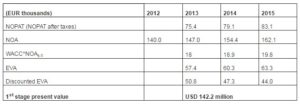
Table 4: Calculation of the Resulting Value of Equity of XYZ HOLDING as at 31 December 2012 by the EVA Method
Valuation of Equity of XYZ HOLDING
In order to appraise the equity of XYZ Holding by the market benchmarking method, the P/E (price / earnings; price / net income after taxes) multiplier, which is popular among appraisers and often referred to in theory, will be applied. Since the net income can be influenced by many extras, the calculation will be checked by means of the P/EBIT multiplier.
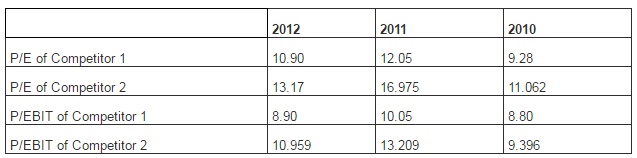
Comparable enterprises are identified on the basis of the competition analysis. Among identified competitors, two companies have listed shares – Competitor 1 and Competitor 2. Table 5 shows the result of the multipliers for both companies. In 2012, both companies experienced a decrease in share quotations. However, a high range of both indicators can be seen. Competitor 2 has been operating in several industries and the earnings from sales constitute approximately 50% of total earnings; we will accept the multipliers of Competitor 1, whose portfolio of activities and products are more similar to XYZ HOLDING.
Table 5: P/E and P/EBIT Multipliers of Competitor 1 and Competitor 2
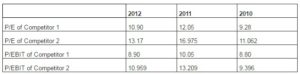
Earnings of XYZ HOLDING after taxes for 2012 amounted to USD 68.3 million; EBIT (and/or net operating profit before taxes) amounted to USD 71.8 million. According to the multipliers of Competitor 1 for 2012, the value of the company would be from USD 631.84 million to USD 823.015 million. The upper limit approximately corresponds to the income based valuation result. If we used the multipliers of Competitor 2, the resulting value would be approximately 20% higher. The value of XYZ HOLDING calculated according to the multipliers thus ranges from USD 631.84 million to USD 1159.4 million. The average of this range is USD 784.8 million.
Determination of the XZY Brand Value Using Premium Method
Based on the brand analysis we assume that XYZ HOLDING sells and produces 33 % more than its rivals who are either without a trademark or with a weaker trademark. However, considering the industry specifics, we do not suppose that products are sold at premium prices. Therefore the economic benefits of the XYZ trademark result in the increase of sales and in the increase in operating margin (as a result of the saved fixed costs per production unit).
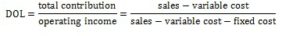
As a measure of how revenue growth translates into growth in operating margin is used operating leverage. Change in operating income for a given change in sales (revenue) is degree of operating leverage (DOL).
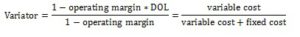
For the estimation of the change in XYZ HOLDING operating income we used benchmark values of operating margin and operating leverage producing the level of variator (variable cost to total cost):
Profit differential attributable to the brand comparing to benchmark based on previous formulas is then calculated as follows:

TXYZ………….. Total revenues of XYZ HOLDING
OMXYZ………. Operating margin of XYZ HOLDING
OMBenchmark. Operating margin of benchmark companies
%ΔT….. …. Percent change in sales attributable to XYZ brand comparing to benchmark companies
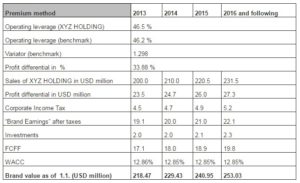
Calculated profit differential after income tax (19 %) is net earnings of the XYZ Brand. After deduction of incremental investments into brand building it produces free cash flow attributable to the brand and Brand Value of USD 218.5 million (as at 31 Dec 2012) – see Table 6.
Table 6: Valuation of the XYZ Brand by the Premium Method
Valuation of the XYZ Brand Using the Brand Impact Evaluation
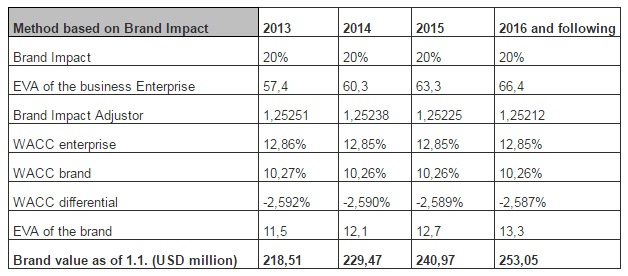
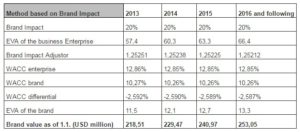
Brand Impact Evaluation (20 %) enabled us to identify the portion of enterprise economic value added attributable to the brand. EVA of the brand is calculated as a multiple of brand impact and enterprise EVA. As a discount rate we used enterprise WACC divided by the financial brand adjustor. The reagent function for computing the brand impact adjustor (BIA) has the following form:
BIA = WACCt / (EVAt*BI/BVt + g)
Where
BIA Financial brand impact adjustor
BI Brand impact
WACCt Weighted average cost of capital in t
EVAt Economic value added in the year t
BVt Brand value in the year t
g Annual growth rate
Table 7: Valuation of the XYZ Brand by Using the Brand Impact Evaluation
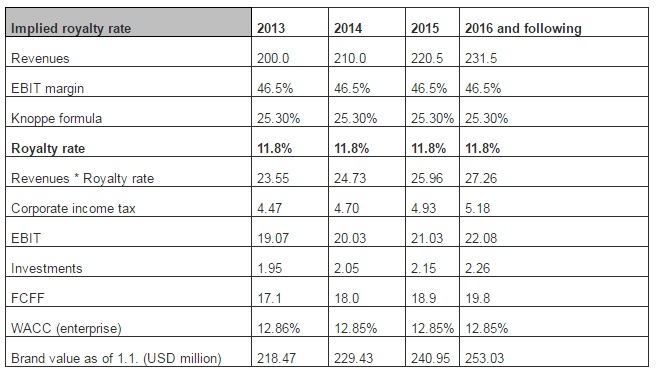
Calculation of Implicit Royalty Rate
In order to calculate an implicit (internal) royalty rate determined by the proportion of total revenues (total sales of goods and performance), the relief-from-royalty method was applied. Within this method, the revenues are multiplied by a royalty rate, adjusted for income tax (19%) and necessary investment in brand management. On the basis of empirical experience, we assume that approx. 8.3% of royalty payments (“rent”) are reinvested in brand management. Cash flow in individual years of the first stage can be calculated as follows:
T …….. Total revenues
LS …….. Royalty rate
t …….. Income tax rate (19%)
mIZ ….. Investment in brand management (8.3 %)
N …….. Duration of the first stage of the plan in years (3)
The present value of the ongoing value is calculated by means of Gordon’s formula with the expected rate of growth g = 5 % as follows:
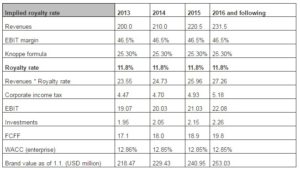
Assuming that the brand value is approximately USD 218.5 million, which was calculated by the method of discounted cash flow attributable to the brand, then the aforesaid relations determining the value of the first and second stage are equivalent to an implicit royalty rate of 11.8% (see the following Table 8).
USD 218.5 million = 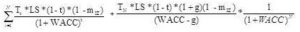
Table 8: Calculation of a Royalty Rate, If the Brand Value Amounts to USD 218.5 – Rfr Method
Conclusions and Critical Evaluation
The paper suggests possible approach to appraising the fair value category of trademark of an unlisted (private) company. The valuation of this identifiable intangible asset is even more difficult than the valuation of a business as whole. All methods of appraising the fair value of a brand are based either on comparability (comparable uncontrolled price method, resale price method, cost plus method), costs (reproduction and replacement cost method) or income approach (brand equity valuation for accounting, incremental cash flow and relief-from-royalty method). However, the results that appraisers obtain applying these methods usually differ very significantly.
Therefore we have suggested the VIM model (Verifiable Interdependent Model), which has been designed specifically for the conditions of use in this environment. The paper has also presented a case study demonstrating the application of the model and evaluating the informative value of the obtained results. The calculation procedure comes out of the valuation of invested capital and WACC of the whole company. We have found this step necessary in order to verify the level of brand value within the meaning of model valuation. Without identifying invested capital required for operation, the prognosis of the operating profit margin and operating cash flow cannot be made correctly in terms of methodology. And last but not least, without knowing the real capital structure, a discount rate for appraising the incremental cash flow appertaining to the brand cannot be determined correctly.
On the basis of the strategic and financial analysis conducted within the valuation process, “brand impact” can be evaluated successfully. Brand impact is based on the examination of stability, extent, and growth of the brand using the comparative list of competitive brands and on the study and analysis of behavioural aspects of purchasing behaviour, which is aimed at finding out which factors influence purchasing behaviour, and what is most important for them. These results are verifiably providing key indicators of brand performance. Brand impact reflected in the WACC value produces the discount rate appropriate for the income based valuation of the brand.
Afterwards we apply the income based valuation methods. Discounted cash flow attributable to the brand is identified using brand impact information input. Premium method is based on the estimated increase in sales of branded business, compared with sales of “benchmark” and increased operating margin of the branded business compared to “benchmark”. Income based value of the brand is an important information input for the identification of an implicit royalty rate. The rate is to be of course evaluated in the context of available information about market transactions. For example, according to the rule of thumb, frequently used in Germany to support the appropriateness of licence fee rates, the licensor shall receive a profit share of approximately 1/4 to 1/3 of the profits generated by licensee by using the brand (i.e. the royalty rate ranges from 25 to 33 % of the EBIT margin).
The last step involves a detailed study of differences in results, if any, detailed economically and methodologically justified calibration of model parameters of income based valuation and further specification of empirical methods. We found the income based value of the brand to be the most sensitive to the rate of the brand impact, sales volume and price premium, to the amount of reinvestment of earnings from the brand after taxes in ensuring and maintaining the brand value creation and to the assumed rate of growth of the operating profit and/or free cash flow during the second stage of the valuation process.
(adsbygoogle = window.adsbygoogle || []).push({});
References
Absatzwirtsachft. (2004). ‘Markenbewertung – Die Tank AG,’ Verlagsgruppe Handelsblatt, Munich.
Brigham, E. F. & Ehrhardt, M. C. (2005). ‘Financial Management,’ (11. Ed.),
Čada, K. (2007). Oceňování Nehmotného Majetku. Oeconomica, Praha.
Publisher
Čižinská, R. & Krabec, T. (2013a). “Metody pro Ocenění Ochranné Známky: Doporučení pro Použití v České Republice,” Scientia ét Societas, IX(2), 160-175.
Publisher
Čižinská, R. & Krabec, T. (2013b). ‘VIM Model for Appraising the Trademark of an Unlisted Company,’ Entrepreneurship Vision 2020: Innovation, Development Sustainability, and Economic Growth. Proceedings of The 20th International Business Information Management Association Conference, ISBN: 978-0-9821489-9-0, 25-26 March 2013, Kuala Lumpur, Malaysia, 908-926.
FASB. (2006). SFAS 157 Fair Value Measurements. Norwalk, Financial Accounting Standards Board.
Publisher
Gerzema, J. & Lebar, E. (2008). The Brand Bubble: The Looming Crisis in Brand Value and How to Avoid It, Jossey-Bass.
Publisher – Google Scholar
Gordon, V. S. & Russell, L. P. (2000). ‘Valuation of Intellectual Property and Intangible Assets,’ John Wiley & Sons, New York.
Google Scholar
Greco, S. (2010). Verwertung von Know-how. Vertragstypologische Zuordnung, Vertragserfüllung und Hinweise zur Vertragsgestaltung, Peter Lang Verlag, Frankfurt am Main.
Publisher – Google Scholar
Groß, M. & Rohrer, O. (2012). Lizenzgebühren (3. Ed.), Recht Und Wirtschaft GmbH, Frankfurt am Main.
Publisher
Hubbard, D. W. (2010). How to Measure Anything: Finding the Value of Intangibles in Business (2. Ed.), John Wiley and Sons, Chichester.
Publisher – Google Scholar
IFRS, (2008). International Financial Reporting Standards 3, Supplement A.
Publisher
IFRS, (2011). International Financial Reporting Standards 13.
Publisher
IDW S 5. (2011). “Grundsätze zur Bewertung Immaterieller Vermögenswerte,” IDW Fachnachrichten, Heft 7.
Publisher
IVSC. (2007). International Valuation Standards, London.
Publisher
IVSC. (2011). International Valuation Standards, London.
Publisher
Knoppe, H. (1972). ‘Die Besteuerung der Lizenz- und Know-how-Verträge,’ (2. Ed.), O. Schmidt, Köln.
Google Scholar
Koleňák, J. & Koleňáková, L. (2012). “Je Synergie Cestou ke Zvýšení Hodnoty Podniku?,” Scientia& Societas, 8(3), 128-138.
Publisher – Google Scholar
Koller, T., Goedhart, M. & Wessels, D. (2010). Valuation: Measuring and Managing the Value of Companies (5. Ed.), Wiley and Sons, New Jersey.
Publisher – Google Scholar
Krabec,T. (2009). Oceňování Podniku a Standardy Hodnoty, Grada, Praha.
Publisher – Google Scholar
Krabec, T. & Čižinská, R. (2013). “Introducing the Financial Brand Impact Adjustor in the VIM Model for Appraising the Brand of an Unlisted Company,” Recent Advances in Energy, Environment, Economics and Technological Innovation (1st Ed.), Proceedings of the 4th International Conference on Development, Energy, Environment, Economics (DEEE ’13), ISBN: 978-960-474-343-8, 29-31 October 2013, Paris, 157-163.
Publisher – Google Scholar
Kruschwitz, L. & Löffler, A. (2006). Discounted Cash Flow: A Theory of the Valuation of Firms, John Wiley and Sons, Chichester.
Publisher – Google Scholar
Mard, M. J., Hitchner, J. R. & Hyden, S. D. (2007). Valuation for Financial Reporting. Fair Value Measurement and Reporting, Intangible Assets, Goodwill and Impairment (2. Ed.), John Wiley & Sons, New Jersey.
Publisher – Google Scholar
Murphy, J. (1990). ‘Brand Valuation,’ Murphy, J. (ed), Random House Business Books, London.
Nestler, A. (2008). “Ermittlung von Lizenzentgelten,” Betriebs-Berater, 2008(37), 2002-2006.
Publisher – Google Scholar
Perrier, R. & Stobart, P. (1997). ‘Brand Valuation,’ (3. Ed.), Perrier, R. and Stobart, P. (eds), Premier Books, Rosedale.
Google Scholar
Salinas, G. (2009). The International Brand Valuation Manual: A Complete Overview and Analysis of Brand Valuation Techniques, Methodologies and Applications, John Wiley and Sons, Chichester.
Publisher
Smith, G. V. (1996). Trademark Valuation, John Wiley & Sons, New York.
Publisher – Google Scholar
Svačina, P. (2010). Oceňování Nehmotných Aktiv, Ekopress, Praha.
Publisher – Google Scholar