Introduction
Intangible Assets: New Sources for Development
At present, we live in the era of intellectual property. The access to vital resources has changed, since physical assets are no longer the most important resources. As Denis Waitley writes in Empires of the Mind (Waitley, 1995, apud. Smith and Parr, 2005), “present and future leaders will be more often champions of collaboration than of competition. (…) The leaders of the future will obtain what they want only by helping others obtain what they want”. Acquiring access to technology means collaboration with other companies, even with rival ones, in order to gain access to knowledge-based resources.
Intangible assets have accompanied us all along the history of mankind. A combination of innovation with the statu quowas needed before intellectual property could be identified as a special form of the intangible, but creativity has always existed (Smith and Parr, 2005).
The expert in the evaluation of intangible resources, Patrick Sullivan (2006), includes in the category of intangible assets the following: market related assets (trademarks, brands, newspaper titles, Internet domain names, etc.), customer related assets (customer lists, contracts with the customers, customer relations), artistic creations (theater plays, opera, ballet, books and other literary works, musical works, photographs, audio-visual materials), contract-based assets (license, publicity, maintenance, leasing contracts, building authorizations, broadcast rights, work contracts), and technology-based assets (patented technology, computer software, unpatented technology, databases, commercial secrets, secret formulae).
Created in 1997, Intellectual Capital Sweden AB is the first company in the world specialized in measuring intellectual capital, by using an especially designed instrument – IC Rating. Starting from Leif Edvinsson’s theories, the Swedish company structures intellectual capital into organizational capital (intellectual property and processes), human capital (management and employees), and relational capital (networks, customers, brand). IC Rating is a practical platform for measuring and describing the non-financial assets that are not reported in traditional annual financial statements, but which bring an important contribution to the long-term success of the organization.
Many authors tried to define as precisely as possible the term intangible capital, an objective not at all easy to attain because of the complexity of the term, as well as of the embryonic stage of the field. As a result, both practitioners and researchers prefer to use, as a starting point in their approaches, various classifications of intangible capital according to components, the most often used being the one where intangible capital is made up of human capital, structural capital, and relational capital. There are other classifications as well, but the differences are often rather related to the form than to the contents. Usually, intangible capital is considered equivalent to intellectual capital, but specialized literature (Hunter et al., 2005) showed that between them there is an inclusion relation, not equality. Intellectual capital could be assimilated to human capital, meaning the totality of the employees’ knowledge and skills.
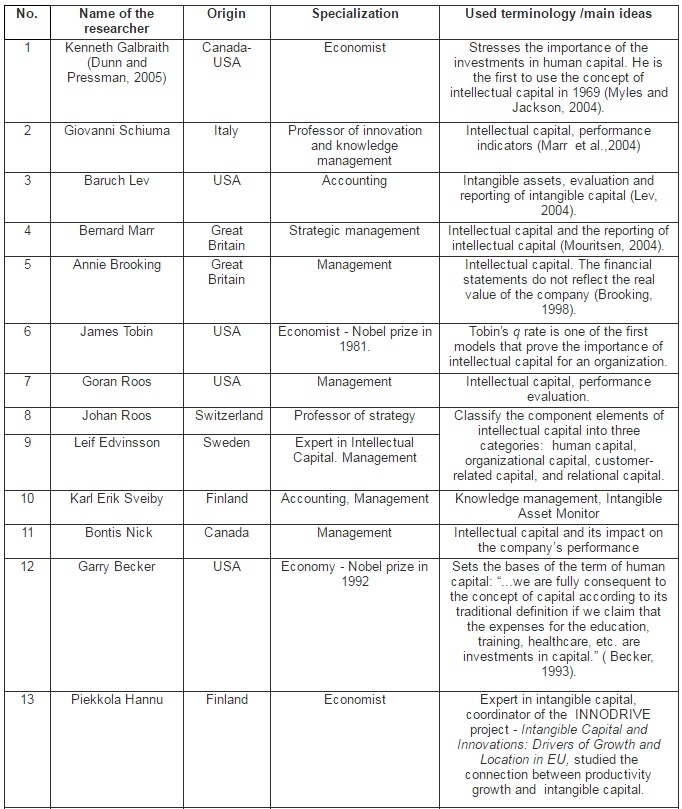
In table 1, we have synthesized the main ideas of the most renowned researchers in the field, considering that their basic specialization is interesting. As we can notice, accounting generally operates with the term “intangible assets”, while management mainly uses the notion of “intellectual capital”.
In our study, we refer both to intangible assets, which meet the acknowledgement criteria in the balance sheet, and to intangible capital, regarded through a set of non-financial indicators.
Table 1: Usage of the Terms: Intellectual Capital, Intangible Capital, and Intangible Assets in the Studies of the Most Renowned Researchers in the Field
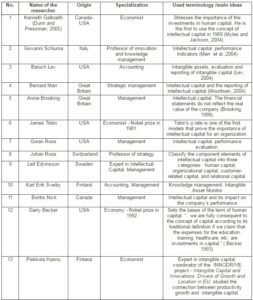
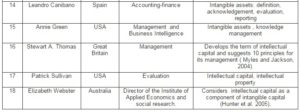
Source: The authors’ projection
The Financial Reporting of Intangible Capital in International Theory
One of the characteristics of contemporaneous organizations is their ambition to develop advanced management systems and practices, an objective that imposes focusing the efforts in the direction of the knowledge management and of the management of the intangible capital. As a result, strategies are no longer designed only for positioning the company in relation to its competitors, but are correlated to intangible assets and intellectual capital as the employees’ know-how, relations with customers and providers, information technologies, and brand (Marr et al., 2003). By their nature, such resources are hard to reproduce, having the potential to create extraordinary value.
Ever since 1994, the American Institute of Certified Public Accountants (AICPA), noticed: “the severe competition and the fast advances of technology have lead to dramatic changes. In order to survive and be in competition, companies change everything – the way in which they are organized and administrated, the way in which they work and develop new products, the way in which they manage risk and the relationships with the other organizations…[they] change their information systems and the type of information they use to lead their business … Can business reporting remain immune to all these fundamental changes?”(Smith and Parr, 2005).
The current financial-accounting system is unable to explain “the new resources” as relationships, internally generated assets and knowledge, an aspect signaled by the Jenkins report, Steven Wallman, ex-commissioner of the USA Securities and Exchange Commission (SEC), the International Accounting Standards Board (IASB), the Canadian Institute of Certified Accountants and the Chartered Institute of Management Accountants (Mouritsen et al., 2004).
According to Botosan (1997), providing new information regarding such resources may contribute to reducing the cost of capital, as it diminishes the uncertainty regarding the company’s perspectives and facilitates better business evaluation. Also, the dissemination of information on intellectual capital contributes to increasing the demand for the company’s shares and the share liquidity (Healy and Palelu, 2001). The experts in the evaluation of intellectual property, Smith and Parr (2005), signal that although the accountants were the first to acknowledge the existence and unique features of commercial fund, they did not manage to combine them with the principles of accounting and with those of financial reporting and that the traditional financial statements become less and less useful to investors, financial analysts, and creditors.
In order to insure the transparency of the financial statements and to gain the stakeholders’ trust, companies voluntarily present more and more extended information on intangible assets, surpassing the limitations of the suggestions formulated by accounting standards (García, 2003).
In the field of reporting of intellectual capital, the Danish Guide and the Intellectual Capital Guide, suggested by the MERITUM project, are the most important sources of information for practitioners (Guimon, 2003).
The guide suggested by MERITUM describes the way in which the Report on intellectual capital is drawn, into three stages: 1. The company must present the business perspective, describing the strategic objectives and the critical intangibles; 2. A summary is drawn of the intangible resources and activities needed for meeting the objectives, and 3. A system of indicators is created to measure the degree to which the objectives are met. The guide recommends classifying the intangible resources and activities into three categories: human capital, structural capital, and relational capital.
The guide for declarations concerning intellectual capital of the Danish Agency of Commerce and Industry, whose creation involved 17 Danish companies (1997-2000), reveals a deep understanding of the fact that there are aspects of the companies’ value that cannot be rendered in the accounting sheet (Cohen, 2005). Some of the indicators used by the Danish Guide for measuring intangible capital are: the percentage of staff with academic studies; the investment in training per employee; the staff flow; social events, including theme days (proves what the company does to develop the employees’ social network); collaboration agreements with business administration universities and faculties; the number of patents approved at present; information documents available online; the product innovation ratio.
Between the two “references” in the field of reporting of intangible capital there are some differences. First of all, the MERITUM project uses the term “report” when suggesting the reporting model, while the Danish Guide uses the term of statements. What is the difference between a report and a statement? Jose Guimon, in “Recent European models for intellectual capital management and reporting: A comparative study of the MERITUM and the Danish Guidelines” (2003) provides the answers given by the coordinators of the two projects: for the Spanish researchers, the term “statement” refers to compulsory financial reporting, and they prefer the term “report” because it is more suggestive for the voluntary character of the guide. Professor Mouritsen, direct of the Danish Guide, considers that the report suggests a rigid format, while the statement is more descriptive, less formal.
If the MERITUM Guide project suggests classifying the actions and indicators into three categories: human capital, structural capital, and relational capital, the Danish Guide is more flexible, suggesting the classification of the actions and indicators into employees, customers, processes, and technologies. The Danish Guide allows the companies to decide how they will classify the intangible elements, considering their classification as secondary to the decision to develop indicators.
However, the two guides have more points in common than differences; the application of one guide or another will not determine significant differences in what concerns the reporting practices of intellectual capital. The practitioners should explore the differences between the two references before deciding which one to apply. From a certain perspective, the Danish Guide starts where the MERITUM ends: the guide suggested by the MERITUM project includes the conceptual frame and the processes that can be used to manage intangible assets, and the Danish Guide contains practical recommendations for drawing the intellectual capital statement.
In order to use the results of the MERITUM project, the E*KNOW-NET project was started, whose general objective is the creation of a research and communication network on intangible elements. The activities correlated to the suggested objective are: creating a network; disseminating the results of the researches regarding intellectual capital and allowing access to a large number of users; promoting the discussions with the users in order to define the research agenda and explore new needs related to the management of intangible capital. The guide suggested by MERITUM drew the practitioners’ attention, but did not manage to clarify the steps that the companies should take in order to manage and report intangible capital. The business environment underlined the need for more specific indicators, for concrete examples and work instructions. On the other hand, for the MERITUM guide to become a standard in the field of intellectual capital, it has to keep its general character in order to provide a common language. It is, actually, a compromise between a complete character and the simplicity and flexibility required from a standard. Thus, although the adoption and application rate of the MERITUM guide is high, there still are issues concerning the deep meanings of intangible capital, its management and reporting. The switch from understanding the importance of knowledge and the application of actions to capitalize upon it proves extremely difficult.
In performing the E*KNOW-NET activities, numerous cases of adopting the guide suggested by MERITUM were identified, the most eloquent being in Spain. The regional government of the community of Andalusia, through the Andalusia Agency for business promotion, recommended companies to apply the MERITUM guide, analyze it, and make suggestions. On the other hand, the Spanish Ministry of Economy formed a group of experts with the mission to draw the “White Book” of the accounting reform. The “White Book” promotes the intangible capital reporting practices, starting from the provisions included in the MERITUM guide. The MERITUM guide was tested at a large extent in Spain: the 6 largest companies in the industry of electric facilities were counseled by the Autonomous University of Madrid in the process of drawing the reports on intangible capital. At the same time, interviews were organized to test the MERITUM guide on small and medium enterprises in the Telefonica group.
The MERITUM recommendations were also taken integrally by the FRAME project, funded by the Northern Industrial Fund, and the Norwegian Ministry of Economy considers the MERITUM guide as a starting point in drawing a national report on intangible capital. Both the MERITUM guide and the methodology suggested by the Danish Guide were taken by the Astrophysics Institute and the Technology Institute for regenerative resources in Spain.
In the knowledge economy, intangible capital is a very important factor of value creation. Traditional financial-accounting statements do not provide relevant information for managers and investors that would explain how their resources, of which most are intangible, will create value in the future. Intangible capital statements come to complete financial-accounting reporting, as a communication instrument outside the organization of the knowledge-based strategy, as well as of internal management (Mouritsen et al,. 2004).
In our study, we have analyzed, on the one hand, the extent to which companies comply with the IAS 38 provisions referring to intangible assets and, on the other, the volume and type of information provided by the companies concerning their involvement in the life of the community, in preserving and protecting the environment, in managing and evaluating the human resources, in research and development activities, etc.
Research Methodology
We have analyzed the annual financial statements corresponding to the fiscal year closed on 12.31.2011, drawn according to IAS/IFRS provisions, for 19 companies listed in the Bucharest Stock Exchange and 27 Spanish companies quoted in the Madrid Stock Exchange, components of the IBEX 35 market index, and we have computed the mean degree of dissemination of the information on intangible assets based on the points obtained by each company to a set of questions, designed in the spirit of the IAS 38 provisions. In the data collection stage, we resorted to mediated data collection techniques from the annual financial statements and reports, and in the processing and analysis stage we used the empiric comparative analysis, in order to identify the resemblances and differences between the information published by the companies in the two countries subject to the study and the quantitative analysis. The data was processed using the SPSS- Statistical Package for the Social Sciences software.
In our approach, we have studied the consolidated financial statements of the companies in the analyzed sample and we have tried to see if they meet the minimum information criteria regarding the inclusion, in the explanatory notes, of significant elements related to intangible assets, imposed by the international standard IAS 38 Intangible assets. In order to achieve this objective, we have built a set of 8 questions:
Q1. Does the entity make a distinction between internally generated intangible assets and the acquired ones?
Q2. Is there any mention made of whether the useful lifetime is undetermined or determined, and in case it is determined, of the useful lifetime or the depreciation ratios used, as well of as the depreciation method employed for intangible assets with determined useful lifetime?
Q3. Does the entity describe the factors that played a significant role in finding out whether the useful lifetime of an intangible asset is undetermined?
Q4. Does the company present the movements, rises and reductions in the period, providing details that would explain the dynamics of intangible assets?
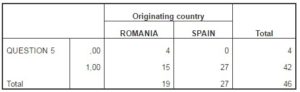
Q5. Is the gross accounting value presented, as well as any cumulated depreciation (aggregated with the cumulated losses from impairment) at the beginning and at the end of the period?
Q6. Does the entity present the impairment adjustments accompanied by a short explanation of the corresponding causes?
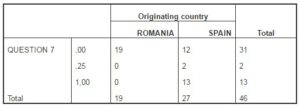
Q7. Is the aggregated value of research and development costs acknowledged as expenses for the presented period?
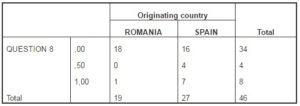
Q8. Is there any description of any completely depreciated intangible asset that is still used, and a brief description of the significant intangible assets controlled by the entity, but not acknowledged as assets because they did not meet the acknowledgement criteria in the present standard, or because they have been acquired or generated before the coming into force of the version issued in 1998 of IAS 38 Intangible assets?
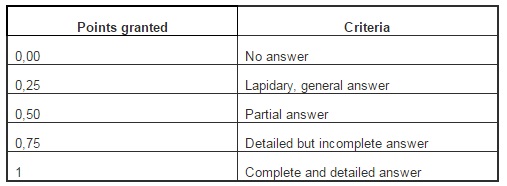
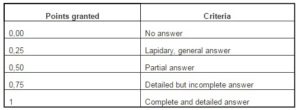
Each answer has been subsequently noted with points from 0 to 1, 1 representing a satisfying, complete, and detailed answer. The notation grid is presented in table 2:
Table 2: Criteria for Assigning Points
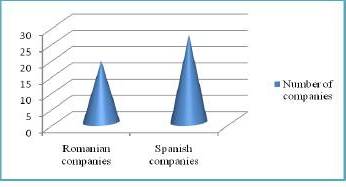
The sample subject to analysis is composed of Romanian and Spanish companies that apply IFRS: 19 Romanian companies quoted in the Bucharest Stock Exchange and 27 Spanish companies quoted in the Madrid Stock Exchange.
In establishing the sample for Romania, we took into account the companies quoted in the Bucharest Stock Exchange, section BSE, categories I, II, and III. Of the total 106 companies (on 07.20.2012), 25 are no longer listed, and 12 are financial investment societies (FIS) or banks and were excluded from the studied sample as a result of the fact that they apply specific accounting regulations. For the 69 remaining companies, we analyzed the financial statements published on their own Web sites or on the Stock Exchange Web site and we identified 14 companies that draw consolidated financial statements compliant with the International Financial Reporting Standards. Since the size of the resulting sample was very low, we set as a starting point the activity fields of the already selected companies and extended the analysis on the companies quoted in the Bucharest Stock Exchange, section RASDAQ, from the following activity branches: extraction industry, processing industry, production and supply of electric and thermal energy, constructions, wholesale and retail trade, transport, hotels and restaurants, and professional, scientific, and technical activities. We identified 5 more companies that apply IAS/IFRS, resulting in a final sample for Romania made up of 19 trading companies, of a total 252 analyzed companies.
In establishing the sample for Spain, we considered the companies quoted in the Madrid Stock Exchange that are part of IBEX 35. Of the 35 companies, 7 are financial institutions and one is an insurance company, and we eliminated them from the analysis because of the nature of their activity. All the 27 remaining companies draw consolidated financial statements, apply IFRS, and have financial statements published on their own Web site, therefore our final sample for Spain is made up of 27 trading companies.
Figure 1: Graphically Represents the Structure per Country of the Analyzed Sample.
Fig 1. Sample Structure
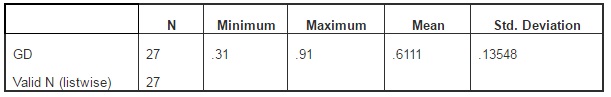
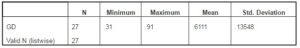
The average degree of dissemination was computed as an arithmetic mean of the answers identified to the questions in the set. A first analysis reveals significant differences at the level of this indicator (tables 3 and 4): while the average value of the degree of dissemination is 32.57% for the analyzed Romanian companies, the Spanish companies in the sample present information in intangible assets according to IAS 38 to a percentage of 61.11 %.
Table 3: Average Degree of Dissemination – Romania
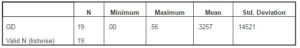
The minimum value of the average degree of dissemination of the information on intangible assets according to IAS 38 is equal to 0, since the ELECTROAPARATAJ company does not have the explanatory notes published on the website, while two other companies, IMPACT DEVELOPER&CONTRACTOR and DAFORA, have no explanatory note for intangible assets.
In the case of the Spanish companies, the average degree of dissemination of the information on intangible assets is 0.91, while Romanian companies reach a maximum value of 0.56.
Table 4: Average Degree of Dissemination – Spain
We wished to analyze the correlation between the weight of the intangible assets into the fixed assets and the average degree of dissemination of the information on intangible assets.
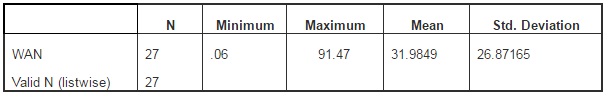
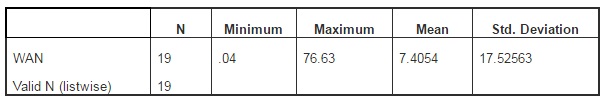
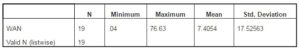
The average weight of the information on intangible assets is 31.98% for Iberian companies (table 5) and 7.41% in the case of Romanian companies (table 6).
Table 5: Weight of the Intangible Assets into the Fixed Assets – Spain
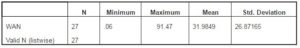
Table 6: Weight of the Intangible Assets into the Fixed Assets – Romania
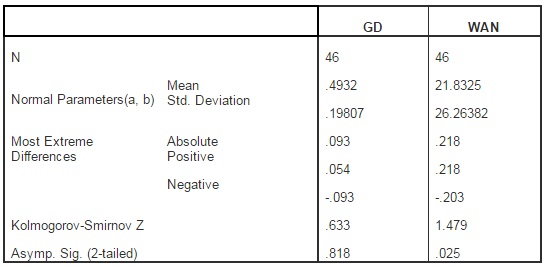
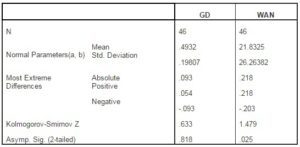
Data processing in SPSS reveals the fact that only the analyzed variable “DD” has a normal distribution (table 6).
The statistical hypotheses are:
H1. Null hypothesis: the “WAN” variable is normally distributed.
H2. Alternative hypothesis: the “WAN” variable is not normally distributed.
and
H3. Null hypothesis: the “DD” variable is normally distributed.
H4. Alternative hypothesis: the “DD” variable is not normally distributed.
Asympt Sig=0.818, respectively 0.025, meaning the risk to reject the null hypothesis is 0.818, meaning 81.8%, respectively 0.025, meaning 2.5%. The risk obtained is much higher than the allowed risk of 5%, therefore we cannot reject the null hypothesis only for the DD variable. For the WAN variable, we can reject the null hypothesis, the variable is not normally distributed. As a result, we cannot compute the Pearson correlation coefficient in order to identify the correlation between the two variables.
Table 7: One-Sample Kolmogorov-Smirnov Test
a Test distribution is Normal.
b Calculated from data.
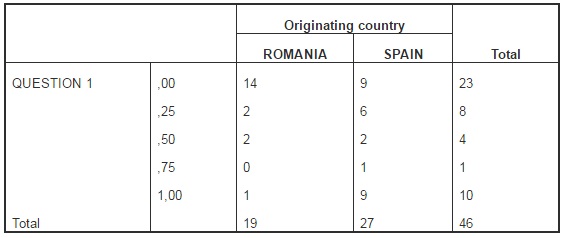
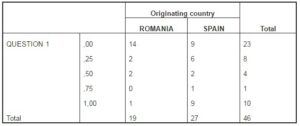
In what concerns the distinction between the internally generated intangible assets and the acquired ones, 14 Romanian companies and 9 Spanish companies do not have this delimitation, while 9 Spanish entities and only one Romanian company din provide a clear and complete answer to this question in their financial statements. The results of the analysis according to the answers identified to question 1 are synthesized in the table below:
Table 8: Sample Analysis according to the Answers to Q1
Most analyzed companies provide complete information in the explanatory note concerning the accounting policies on depreciable assets, the depreciation duration and methods used. Figure no. 2 synthetically presents the results obtained:
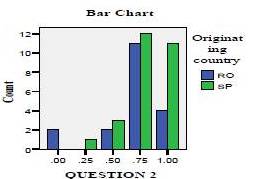
Fig 2. Sample Analysis according to the Answers to Q2
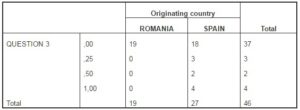
The explanatory notes to the financial statements drawn by the Romanian companies do not include the description of the factors that played a significant role in establishing the fact that the useful life duration of an intangible asset is undefined, while only 4 Spanish companies in the analyzed sample meet this requirement of the standard (table 9).
Table 9: Sample Analysis according to the Answers to Q 3
Only 4 Romanian countries do not present the dynamics of the intangible assets, while all the Spanish companies present the movements, increases, and reductions for the period, also providing some narrative information (figure 3).
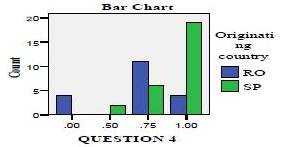
Fig 3. Sample Analysis according to the Answers to Q 4
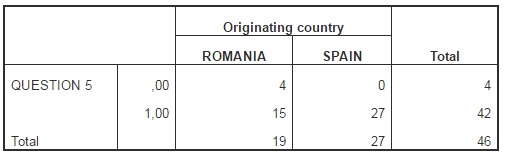
All the Spanish companies and 15 Romanian companies present the gross accounting value and any cumulated depreciations (aggregated with the cumulative losses from impairment) at the beginning and at the end of the period (table 10).
Table 10: Sample Analysis according to the Answers to Q 5
For Romania, only 2 companies of the 19 analyzed – approximately 10.53% – present detailed and complete information on the factors that determined value adjustments, while for the Spanish companies, the percentage rises to 51,85% (figure 4).

Fig 4. Sample Analysis according to the Answers to Q 6
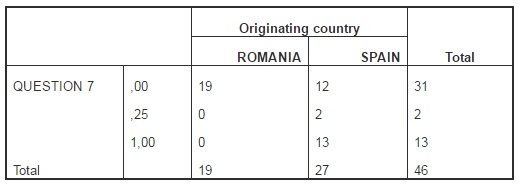
48.15% of the analyzed Spanish companies present information on the aggregated value of the research and development costs acknowledged as expenses for the period, while this information is not present in Romanian companies (Table 11).
Table 11: Sample Analysis according to the Answers to Q 7
IAS 38 stipulates as a recommendation the requirement for information related to the description of the completely depreciated intangible assets that are still used, but most companies included in the sample do not present this information (table 12).
Table 12: Sample Analysis according to the Answers to Q 8
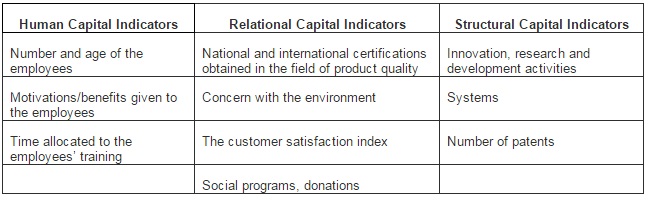
In our approach, we aimed to study the extent to which companies present in annual reports, besides the IAS/IFRS requirements and recommendations, elements of intangible capital. Therefore, we considered the following indicators:
Table 13: Indicators of Intangible Capital
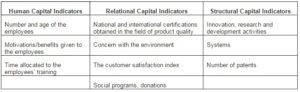
The computing algorithm for human capital, relational capital, respectively structural capital is easy: if the company presents complete information on an indicator, it is graded with 1, if it does not present information, it receives 0 points, and if it presents certain information only partially, it is graded appropriately: 0.25, 0.5, or 0.75. At the end, each component of intangible capital will be equal to the arithmetic mean of the scores obtained for. The arithmetic mean of the values obtained for human, relational, and structural capital is the intangible capital of the company.
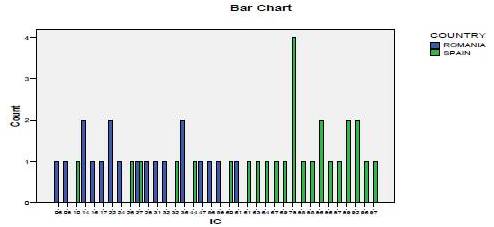
The results obtained for the analyzed sample are presented in the figure below:
Fig 5. Values of Intangible Capital for the Analyzed Sample
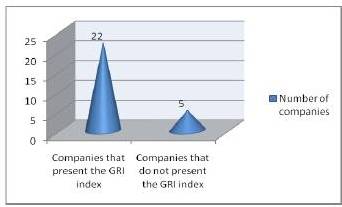
The SPSS output shows that the highest value of intangible capital reached by Romanian companies is 0.61, while most Iberian companies (21 companies out of 27) have values higher than this threshold. The high difference between the values of intangible capital obtained by each country is justified, on the one hand, by the fact that only one Romanian company (OMV PETROM) presents a social responsibility report, and 4 other companies present, on their official Web page, sections with vague information on social responsibility, while all the Spanish companies present such reports. Also, we noticed that some Iberian companies (e.g.: Gamesa, Ferrovial) present, on their official page, a menu titled “human capital”. No Romanian company and only 5 Spanish companies present the GRI index – Global Reporting Initiative.
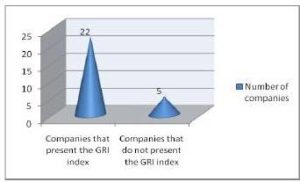
Fig 6. Spanish Companies that Apply the Global Reporting Initiative
The Global Reporting Initiative (GRI) is a non-profit organization that promotes economic, environmental, and social sustainability. GRI provides all companies and organizations with a comprehensive sustainability reporting framework that is widely used around the world. GRI’s Sustainability Reporting Framework enables all companies and organizations to measure and report their sustainability performance. By reporting transparently and with accountability, organizations can increase the trust that stakeholders have in them, and in the global economy.
The mean values of the degree of dissemination of the information on intangible assets intangible capital per activity branch are presented in the tables and figures below:
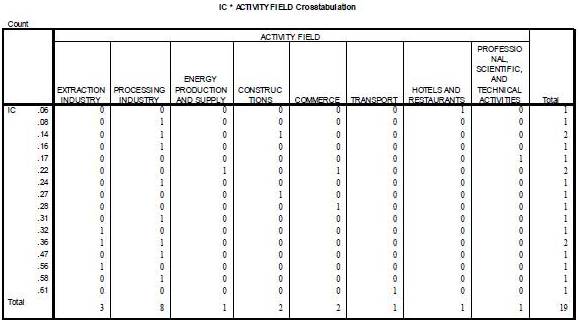
Table 14: Values of Intangible Capital in Romanian Companies, per Activity Field
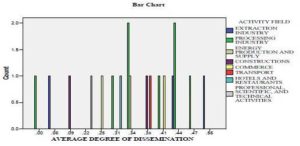
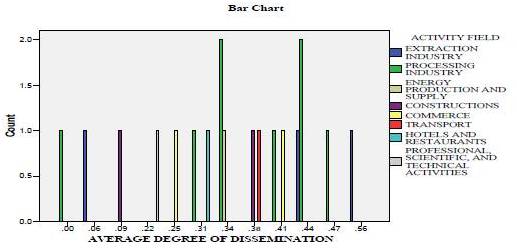
Fig 7. Values of the Mean Degree of Dissemination of the Information on Intangible Assets in Romanian Companies, per Activity Field
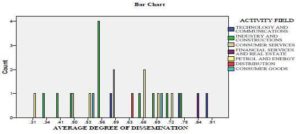
Fig 8. Values of the Mean Degree of Dissemination of the Information on Intangible Assets in Spanish Companies, per Activity Field
Table 15: Values of Intangible Capital in Spanish Companies, per Activity Field
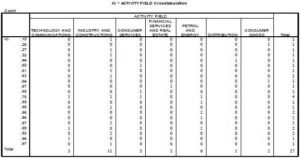
From the analysis of the information per activity field, we can notice that there is no coherent practice of the companies in the same activity sector. For example, of the 27 Spanish companies included in the analysis, 11 companies are in the branch “Industry and constructions”. Within this sub-sample, only 2 companies present an equal value of intangible capital, for the rest, the values of the indicator cover almost all the interval [0.1; 0.97]. In what concerns the mean degree of dissemination, we can notice that most Spanish companies in the previously mentioned activity field present a value of this indicator of 0.56, the maximum value reached by the companies in this activity field being equal to 0.75.
Conclusions and Discussions
In order to identify the policies used by companies in the reporting of intangible assets and to determine the extent to which companies forced to apply the International Financial Reporting Standards comply with the IAS 38 provisions, we have analyzed the consolidated financial statements, drawn according to IFRS by 19 Romanian companies quoted in the Bucharest Stock Exchange and 27 Spanish companies quoted in the Madrid Stock Exchange, components of the IBEX 35 index. We have determined the weight of the intangible assets in the fixed assets and have computed the mean degree of dissemination of the information on intangible assets based on the scores obtained by each company to a set of questions, designed in the spirit of the IAS 38 provisions.
After analyzing the collected data with the Statistical Package for the Social Sciences (SPSS) statistic software, we noticed significant differences in what concerns the reporting of intangible assets. First of all, the degree of dissemination of the information on this category of assets is lower in the case of the sample of autochthonous companies (32.57%) compared to that of Spanish companies (61.11%). The financial-accounting reports of the Spanish companies contain a vast amount of information referring to intangible capital and comply to a greater extent with the provisions of international norms in the financial reporting of intangible assets. To the 8 questions in the set, created in the spirit of the IAS 38 provisions, the Iberian companies generally give more analytical answers. Also, they present significant weights of the intangible assets into the fixed assets.
Besides the financial reporting of intangible assets, we have been concerned with analyzing non-financial information referring to human, relational, and structural capital. It is worth mentioning that, unlike the Romanian companies, the Spanish companies present in their annual reports a large amount of data and information on intangible capital. Moreover, as shown on the official page of IBERDROLA, this company, together with other five companies, components of IBEX 35, created the “Corporate Excellence Centre for Reputation Leadership” foundation, considered a laboratory of ideas dedicated to the promotion of the management of intangible assets as strategic values in reaching excellence.
The SPSS output revealed that there are no correlations between the weight of the intangible assets into the fixed assets and the mean degree of dissemination of the information on immaterial assets, nor between the mean degree of dissemination and the value of intangible capital.
Secondly, we have also monitored the audit companies contracted to verify the annual financial statements: all the Spanish companies and 78.94% of the autochthonous companies have auditors in the BIG 4.
One of the limitations of our study is the small size of the sample for Romanian companies. We consider that this issue will be overcome starting with the financial statements for 2012, considering that, according to art. 1 of OMFP 881/2012 regarding the application by the trading companies whose tangible assets are allowed for transactions on a market regulated by the International Financial Reporting Standards, starting with the fiscal year 2012, the companies whose tangible values are allowed for transactions on a regulated market, have the obligation to apply the International Financial Reporting Standards (IFRS) in drawing the annual individual financial statements.
The points granted for the eight questions related to the dissemination of the information referring to the intangible assets, as well as for the indicators of intangible capital, may determine a certain degree of subjectivity in what concerns the collected information. Obviously, this aspect may bias, to a small extent, in our opinion, the results of the research.
Future research directions will consider a dynamic analysis of the financial reports on the intangible assets and intangible capital of the companies.
Acknowledgment
This work was supported by the the European Social Fund in Romania, under the responsibility of the Managing Authority for the Sectorial Operational Programme for Human Resources Development 2007-2013 [grant POSDRU/CPP 107/DMI 1.5/S/78342]”.
(adsbygoogle = window.adsbygoogle || []).push({});
References
A European Research Arena on Intangibles (E*KNOW-NET). (2003). “Report Of Work Package 2. Intellectual Capital Statements in Firms,” [accessed on 01.29.2012.], http://www.pnbukh.com/files/pdf_filer/Final_report_WP2.pdf,
Publisher
Becker, G. S. (1993). ‘Human Capital: A Theoretical and Empirical Analysis, with Special Reference to Education,’ Chicago University Press, Chicago.
Google Scholar
Botosan, C. A. (1997). “Disclosure Level and the Cost of Equity Capital,” The Accounting Review, 72(3), 145-154.
Publisher – Google Scholar – British Library Direct
Brooking, A. (1998). Intellectual Capital. Core Asset for The Third Millennium Enterprise, International Thomson Business Press, Berkshire House, London
Cohen, J. A. (2005). ‘Intangible Assets- Valuation and Economic Benefit,’ translation by Prims Grup, Bucharest: Irecson, 2008
Google Scholar
Dunn, S. P. & Pressman, S. (2005). “The Economic Contributions of John Kenneth Galbraith,” Review of Political Economy 17(2), 161–209, April 2005, [Online], [accessed on 03.20.2012],http://www.bib.uab.es/socials/exposicions/galbraith/docs/dunn.pdf,.
Publisher
Guimon, J. (2003). ‘Recent European Models for Intellectual Capital Management and Reporting: A Comparative Study of the MERITUM and the Danish Guidelines,’ [Online], [accessed on 03.19.2012], www.iade.org/files/mcmaster2.doc
Healy, P. M. & Palelu, K. G. (2001). “Information Asymmetry, Corporate Disclosure, and the Capital Market: A Review of the Empirical Disclosure Literature,” Journal of Accounting and Economics, 31, 112-122
Publisher – Google Scholar
Hunter, L., Webster, E. & Wyatt, A. (2005). “Forum: Intellectual Capital. Measuring Intangible Capital: A Review of Current Practices,” Australian Accounting Review; July 2005; 15(2); 67-74.
Publisher
Intellectual Capital Sweden.official page: http://www.intellectualcapital.se/Default.aspx?page=17, accessed on 01.31.2012.
Publisher
International Symposium. (1999). “Measuring and Reporting Intellectual Capital: Experience, Issues, and Prospects,” Amsterdam, Technical Meeting June 9-10, 1999 available at http://www.oecd.org/dataoecd/16/21/1947886.pdf, accessed on 03.20.2012.
Publisher
Lev, B. (2004). “Sharpening the Intangibles Edge,” [Online], [accessed on 03.20.2012], http://people.stern.nyu.edu/blev/Documents/Lev_HBR.pdf,
Publisher
Manuel García-Ayuso. (2003). “Intangibles: Lessons from the Past and a Look into the Future,” Journal of Intellectual Capital, 4(4), 108-117.
Publisher – Google Scholar – British Library Direct
Marr, B., Gray, D. & Neely, A. (2003). “Why Do Firms Measure Their Intellectual Capital?,” Journal of Intellectual Capital, 4(4), 54-63.
Publisher – Google Scholar – British Library Direct
Marr, B., Schiuma, G. & Neely, A.. (2004). “Intellectual Capital – Defining Key Performance Indicators for Organizational Knowledge Assets,” Business Process Management Journal, 10(5), 111-129.
Publisher – Google Scholar – British Library Direct
Mouritsen, J., Bukh, P. N. & Marr, B. (2004). “Reporting on Intellectual Capital: Why, What and How?,” Measuring Business Excellence, 8(1), 45-55.
Publisher – Google Scholar – British Library Direct
Myles, J. & Jackson, P. (2004). “Managing Intellectual Capital through the Balanced Scorecard,” [Online], [accessed on 03.20.2012], http://www.sujo.com.au/_docs/We-B00280.pdf,.
Publisher
Parr, R. L. & Smith, G. V. (2005). Intellectual Property – Valuation, Exploitation and Infringement Damages, John Wiley & Sons, Inc., Hoboken, New Jersey, translation by: Prims Grup, Bucharest, Ed. Irecson, 2008
Publisher – Google Scholar
Sullivan, P. H. (2006). “Valuing Intellectual Property (IP),” [Online], [accessed on 01.27.2012], ]http://www.ipd.gov.hk/chi/promotion_edu/seminars/IAM/9_patrick_sullivan_valuing.pdf.
Publisher
https://www.globalreporting.org/Information/about-gri/Pages/default.aspx, accessed on 08.20.2012.
Publisher
http://www.iberdrola.es/webibd/corporativa/iberdrola?IDPAG=ESWEBRESIND, accessed on 09.01.2012.
Publisher