Ligthelm (2005:1) pointed out that “South African cities are characterised by extensive informal sector markets concentrated largely at transport interchanges where trains, taxis and/or buses assemble for commuter movement.”
In this paper the researcher reports on a survey that was conducted amongst informal businesses in one of South Africa’s economically most active regions. The researcher obtained 73 questionnaires from a wide array of business types. All the businesses that were included in the sample all fall within the very small, micro and survivalist categories.
Objectives
The objective of the study was to investigate the usage of computing and internet technologies in the informal business sector in South Africa in order to ascertain the impact of the digital divide.
The location of the business, the number of employees, the use of computers (desktop as well as laptop) and mobile phones, as well as the use of software and e-mail services formed part of the aspects that were addressed in the questionnaire. Respondents were also given the opportunity to indicate in which of the business functions the various technologies are applied.
Methodology
In order to collect the acquired information, the researcher developed a questionnaire that he used in the survey. No other data collection tools were implemented. The researcher and one of the fieldworkers did a number of inspections in loci in order to ascertain the type of businesses that could be accommodated in the sample. Since the bridging of the digital divide formed an important part of the study, the researcher decided to include questions on the types of technology and software that were used in the businesses.
The researcher opted for a sample of convenience since xenophobic violence in the area made it unsafe for fieldworkers to implement a random sample.
Three fieldworkers were trained to administer the questionnaire in accordance with the ethical rules of Monash University. They also received instructions on the selection of interviewees.
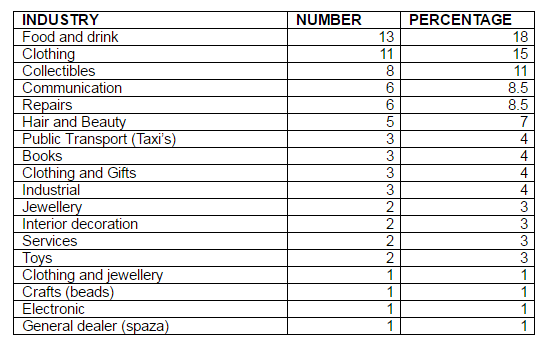
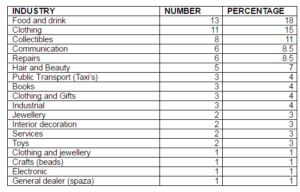
The sample was drawn in the central and western parts of Gauteng, the largest and economically most active of South Africa’s nine provinces. Home industries, flea markets and pavement concerns and kiosks as well as street hawkers were targeted. Table 1 above contains a list of industries that feature in the sample.
Table 2: Industries in the sample
Results
Municipal distribution of the sample
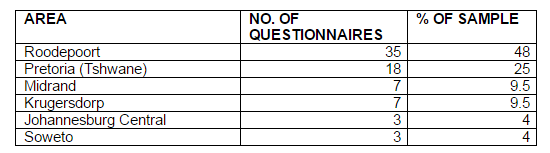
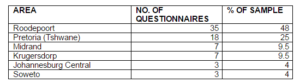
All the questionnaires were administered in the northern, central and western parts of Gautgeng province. The fieldwork was conducted at seven different types of premises. Thirteen regional zones spread over 6 municipal areas were included in the sample.
A table of the number of questionnaires conducted in each area depicts the geographic representativeness of the sample.
Table 3: Municipal Distribution of the Sample
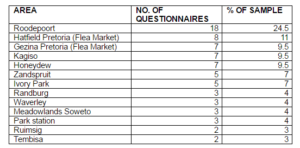
Area Distribution of the Sample
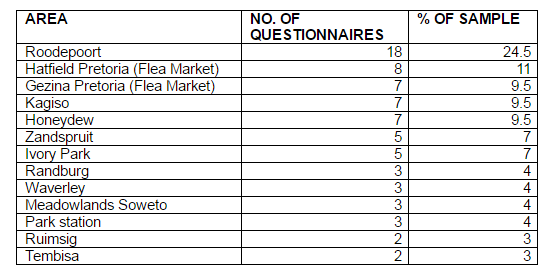
The area distribution of the sample is depicted in the following table. The areas in which the sample were collected vary from affluent suburbs with upmarket malls to pavements in disadvantaged areas.
Table 4: Area Distribution of The Sample In Gauteng province
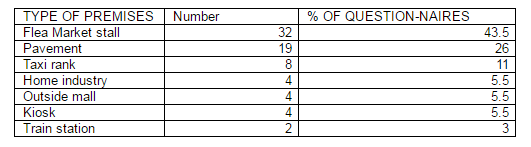
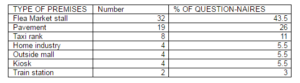
Type distribution of the premises in the sample
The researcher incorporated seven different types of premises in the sample. This type distribution is depicted in Table 5.
Table 5: Type Distribution of the Premises in the Sample
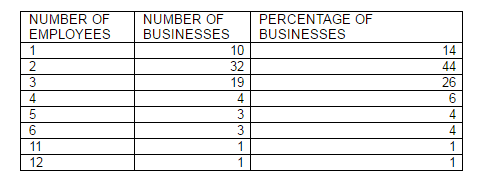
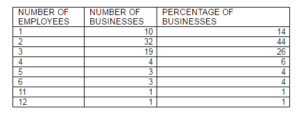
Number of employees
The number of employees employed by each of the small businesses that were incorporated in the study varied did not exceed eleven. Ten of the owners worked on their own. Table 6 depicts the employment pattern that was discovered with data analysis.
Table 6: Number of employees per business
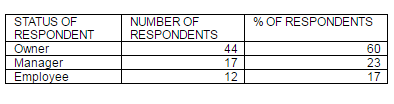
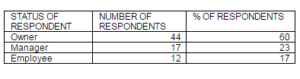
Status of the respondent
In the next question the researcher asked the respondent about his position in the business. The following table depicts the reported results:
Table 7: Status of the respondent
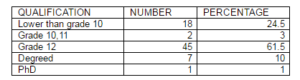
Academic qualifications of respondents
The researcher included a question on the qualifications of the respondent. The responses showed that one respondent had a PhD. The researcher personally interviewed him. He was trading in books at a flea market and proved not only to be very knowledgeable about market trends in his field but also technologically well-connected.
None of the respondents made mention of any technical qualifications. These responses indicated a pattern of limited career options.
Table 8: Academic qualifications of the respondent
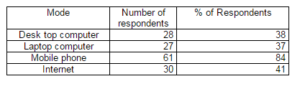
Access to Technology
The researcher included a question on access to technology. The respondent answered on behalf of the business.
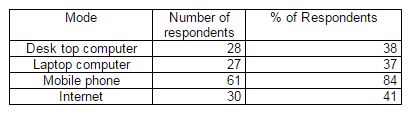
Table 9: Access to technology
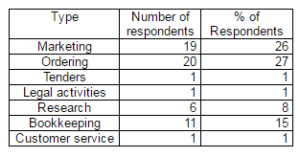
Primary Reason for Usage
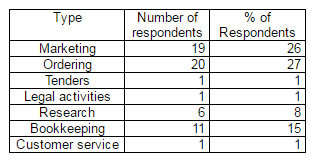
The researcher compiled a cafeteria question to establish the business functions for which the equipment and technologies are used. The following usage was reported.
Table 10: Business functions for which the technologies are used
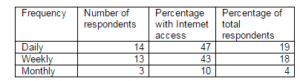
Internet usage
Of the 30 respondents who enjoy Internet access, 22 reported that they use it for business purposes. The respondents reported the following data regarding frequency of usage.
Table 11: Frequency of Internet usage
Points of access
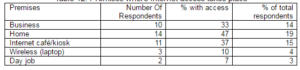
The respondents reported that they gained Internet access at the following venues. They were allowed to select more than one alternative.
Table 12: Premises where Internet access takes place
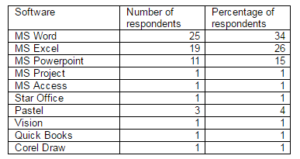
Software usage
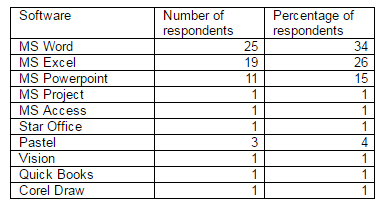
The respondents were given a list of popular software programs. They were given the opportunity to indicate which of these software packages they use. The list included widely-used productivity packages i.e. MS Word, MS Excel etc. The researcher also made provision for the reporting of software that did not feature on the list. Respondents could identify more than one package.
Table 13: Software usage by businesses in the informal sector
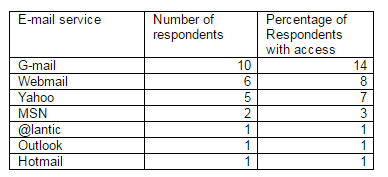
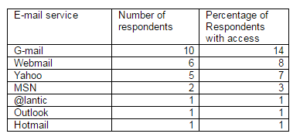
Usage of electronic mail
Electronic mail (e-mail) proved to be the most popular of the Internet services. Twenty six respondents reported the use of e-mail for business purposes. One respondent indicated that he used it only for private purposes. The data is sorted according to the e-mail service that is used by the business.
Table 14: Usage of electronic mail
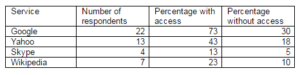
Usage of Internet services
The researcher also inquired about the use of other Internet services by the respondents. Usage of e-mail that was addressed in the previous question, was excluded. The respondents reported the following uses.
Table 15: Usage of Internet services
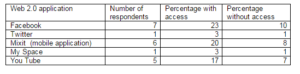
Usage of Web 2.0 applications
The respondents reported the following involvement in the wide array of applications that are offered within the realm of the Web 2.0.
Table 16: Usage of Web 2.0 applications
Discussion of results
The research on which this paper is based is a pilot project regarding the usage of computing and Internet facilities by the informal business sector in South Africa. The researcher incorporated 73 businesses that are all being conducted in the metropolitan areas.
From the data it was discovered that only 41% of the businesses in the sample enjoy Internet access. As far as access to equipment is concerned, the researcher found that 38% of the respondents had access to desktop computers, 37% to laptops and 84% to mobile phones. This finding is in line with the world wide trend favoring mobile technologies.
With regard to the business functions that technology is used for, the researcher found that 27% of the businesses in the sample uses it for ordering, 26% for marketing, 15% for bookkeeping and a mere 8% for research.
Forty seven percent of the respondents with access use the Internet on a daily basis and 43% weekly. This, respectively, makes up 19% and 18% of the businesses in the sample.
Of those with access, 47% enjoys home access, 37% access at Internet café’s or other public facilities and 33% at their place of business. The accounts for 19%, 15% and 14%, respectively, of the total sample.
The rest of the statistical picture projects the same patterns. Thirty four percent of the businesses use MS Word and 26% MS Excel. Fifteen percent indulge in MS Powerpoint. Only 36% percent make use of e-mail services to conduct business.
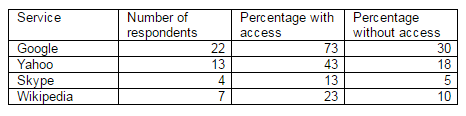
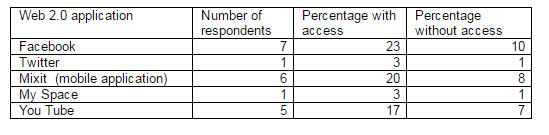
Thirty percent of the businesses make use of Google, 18% use Yahoo, and 10% get information from Wikipedia. Ten percent do Facebook profiling, 8% are into Mixit, a local messaging system whilst 7% access You Tube.
The general picture is one of technological starvation. However the results generated by the sample point to a technology gap produced by choice and skill rather than mere digital divide caused by infrastructural factors. The lack of computing and e-skills and its impact on these usage patterns may be top worth researching in a follow-up project.
References
Agupusi, P. (2007). Small Business Development and Poverty Alleviation in Alexandra, South Africa. Proceedings of the second meeting of the Society for the Study of Economic Inequality. ECINEQ Society, July 12—14, 2007, Berlin, Germany. [Online], [Retrieved February 16, 2007], http://web.diw−berlin.de/documents/dokumentenarchiv/17/60111/paperagupusi.pdf
Dearstyne, B. (2001) “e-business, e-government and information proficiency”, Information Management Journal, (34:4), [Online]. ARMA. [Retrieved February, 6 2009], http://web.ebscohost.com.ezproxy.lib.monash.edu.au/
Gurstein. M. (2000). Community Informatics: Enabling Community Uses of Information and Communications Technology, Idea Group, Hershey, PA.
Hart. M. Internet Statistics for 2005. [Online]. UPENN, [Retrieved December 20, 2006], http://onlinebooks.library.upenn.edu/webbin/bparchive
Johnson, T. (2006). The Future of Internet Technology. [Online]. Article Alley. [Retrieved February, 2 2006], http://www.articlealley.com/article_23546_45.html
Ligthelm, A.A. (2005). Informal Markets In Tshwane: Entrepreneurial Incubators or Survivalist Reservoirs? Unisa, 2005, Pretoria.
Mack. R.L. (2005). The Digital Divide. Academic Press, Durham, N.C.
Mannak, M. (2009). Economy-Africa: Informal Sector Also Needs Skills Training. [Online]. IPS. [Retrieved February, 6 2009], http://ipsnews.net/news
Annexure A
TYPE OF BUSINESS
African attire
African art
African curio’s
Bar snacks
Beads
Books
Buy & braai
Car repairs
Cell phone outlet
Child care
Cleaning supplies
Clothing
Clothing and jewelry
Comp accessories
Computer repairs
Confectionary
Construction
Costume jewelry
Dolls
Driving school
Electronic sales
Fine art
Food stall
Frames
Fruit & Vegetables
Hairdressing
Handbags
Hand-painted clothing
Hot dog stand
Jewelry
Knives
Leather goods
Panel beaters
PC Games
Public phones
Shoe repair
Spaza
Spices
Sports memoribilia
Sunglasses
Taxi
Teddy bears
Ties
Toys
Tuck shop
Tyre repairs
Used books
Welding works