Introduction
The gravity model is widely used in econometric analysis of international statistics. For the foreign trade, the gravitymodel analyses the determinants of bilateral trade flows, the goal being the development of more precise predictions onthe bilateral trade.
Newton’s gravitational equation measures the maximum force between two masses that are separated in space. Tradegravity equation follows the same principle, measuring trade that may exist between two countries, mainly depending on the distance between them and their level of development, plus a few specific factors.
Literature review shows two time periods of intensive use on empirical gravity model of trade, separated by a period oftheoretical foundations of the model. The first uses of gravity equations are from 1960, in 1962 when Tinbergen and then,in 1963, PÅ‘yhÅ‘nen applied the gravity model to explain the commercial trade between two partner countries using theclassical equation, in which the factors are the product of GDP’s of the two countries (positive correlation) andgeographical distance between the two partners (negative correlation).
Then followed a time period of theoretical background for the gravity model, mainly through the scientific works ofAnderson (1979), Bergstrand (1985, 1989), Armington (1969), Helpman and Krugman (1985) and Deardorf (1988).
After 2000, the papers are highly empirical, extending the model with a number of factors that show geographical,historical or economic relationships between the partner countries.
This paper is empirical and aims to identify significant influence factors on bilateral trade flows between Romania and its trade partner countries, in order to estimate the degree of the external trade efficiency, identifying the most effective and most ineffective foreign trade partnership for Romania. The econometric model used for this purpose is not a proper gravity model, since we only used the bilateral trade flows between one reference country, Romania, and its trading partners, but it uses gravity variables as explicative factors.
Methodology and Data
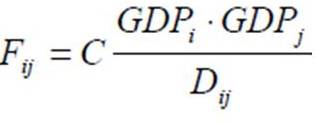
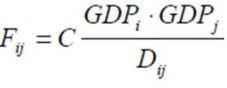
The standard expression for the trade gravity ecuation is:
 , unde
- Fij represents the bilateral trade flows between country i and country j;
- C is the constant of the equation;
- GDPi is the gross domestic product for the country i;
- Dij is the distance between the capitals of the two partner countries.
The equation is linearised using the logarithm function, and the gravity model of trade will have the following form:

In addition to these traditional explanatory variables, the model may include a number of additional variables, dummy ornot, geographical, historical or economic, relevant to explain trade between two partner countries. Glick and Rose (2002)have introduced a number of additional variables, such as the existence of common borders, a common language, acommon currency and some variables showing colonial links between the two countries – a variable indicating whetherone was current or past colonized by the other, and a variable showing whether the two countries have the samecolonizer. Franklin, Stream and Wei (1995) included, as economic variables, a number of variables that indicate the stage of development of partner countries in terms of production factors – human capital, physical capital and land.
The econometric model proposed in this paper to explain Romania’s trade with partner countries of the world, has thefollowing form:

- BTFi represents the bilateral trade flows between Romania and the country i. The values of this variable are obtained as the sum of exports and imports between the two countries in 2009, expressed in millions of euro;
- GDPi is the gross domestic product of the partner country i, expressed in dollars at purchasing power parity, in 2009;
- DISTi is the distance in kilometers between Bucharest and the capital of the partner country i;
- FDI_dummy is a dichotomical variable that indicates whether the partner country made significant direct investments in Romania or not. The variable takes the value 1 for the partner countries that had, in 2009, over 100 million euros investments in Romania, and 0 otherwise;
- BORD_dummy is a dichotomical variable and shows whether Romania has territorial or sea borders shared with the partner country. The variable has value 1 if there is a common border and 0 if countries don’t have commonborders;
- EU_dummy is a dichotomical variable and has the value 1 if the partner country is an EU member and 0otherwise.
The data used in the analysis are from World Bank, World Trade Organisation, Eurostat and the Romanian National Institute of Statistics. The database contains 74 partner countries with which Romania has bilateral trade. Were excluded those countries for which, in 2009, there were either import or export operations only with Romania.
Estimation of the Econometric Trade Model
Parameters were estimated using Ordinary Least Squares method, and for the selection of the regression variables was used the stepwise method.
The parameters of the econometric model were estimated with SPSS 17.0 software.
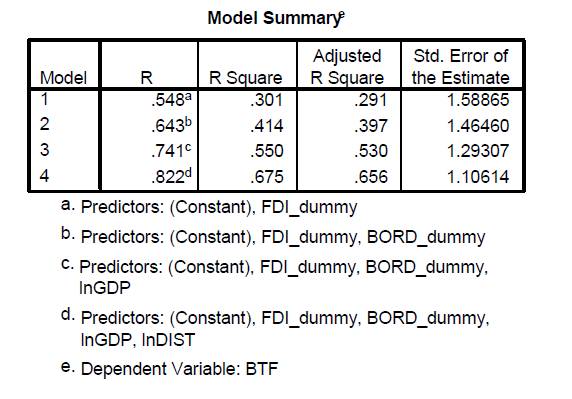
Table 1 shows the square of the correlation coefficient values (R Square) obtained for the models based on all the regression factors. It is noted that from the 5 variables entered into the model, the best model selected has foursignificant influence factors, namely lnGDPi, lnDISTi, FDI_dummy and BORD_dummy. The chosen model explains67.5% from the variation of the dependent variable, the bilateral trade flows between Romania and partner countries. The variable EU_dummy did not contribute significantly to the explain of the bilateral trade.
Table 1. R Square Statistics for the Selected Models Using Stepwise Method
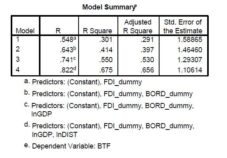
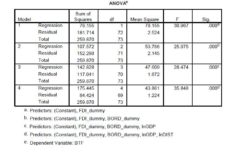
The analysis of the data presented in Table 2, ANOVA results, shows that the models explained significant variation inbilateral trade flows, based on factors included in the model (Sig. <0.05), but we can observe that the model with the lowest residual error is the fourth model, the one that, consequently, has the highest R Square value.
Table 2. ANOVA Result for the Selected Models
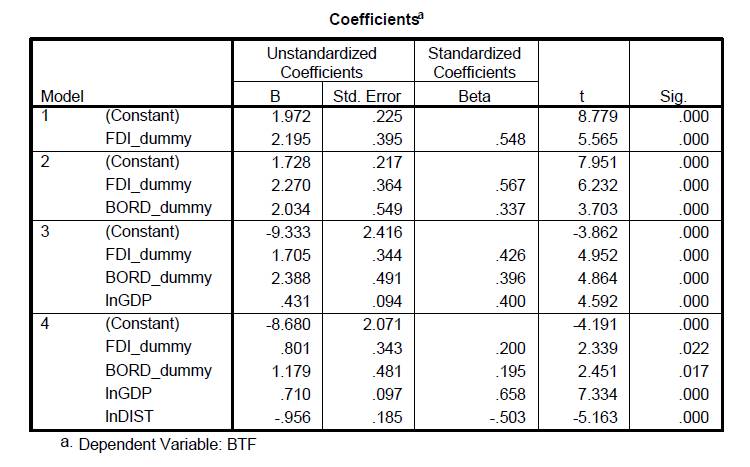
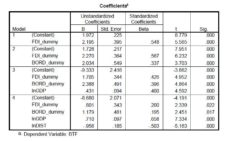
Analysing the results presented in Table 3 for the fourth model, the estimated trade equation is:
The results show that bilateral trade flows (BTF) are explained by GDP, the distance between the two countries, thepartner country’s foreign direct investment in Romania and the existence of common borders between Romania and the partner country.
The positive correlation between:
- BTF and GDP shows that Romania has more intense external trade with countries that have higher GDP than with the countries with lower GDP;
- BTF and FDI_dummy shows that Romania has more intensified trade activities with countries that invested more than 100 million euros, compared to countries with low or zero foreign direct investment;
- BTF and BORD_dummy shows that Romania has a bigger trade volume with countries having a common border, territorial or by sea.
The negative correlation between BTF and the geographical distance shows that the greater the distance between Romania and the partner country, the lower is the trade volume between the two.
Tabel 3. Parameter Estimates of the Trade Model
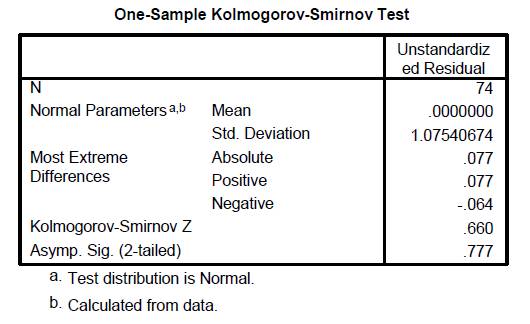
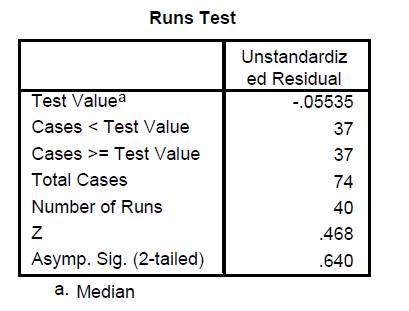
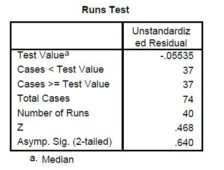
Model errors were tested for normality and independence. The results are presented in Tables 4 and 5. The assumptionthat the errors are normally distributed is accepted (Sig. = 0.777> 0.05), as well as the error’s independence hypothesis(Sig. = 0.64> 0.05).
Table 4. Validation of Normality Hypothesis
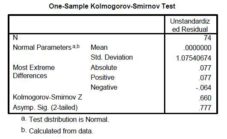
Table 5. Validation of the Independence Hypothesis
Determination of Efficient and Inefficient Trade Partnerships for Romania
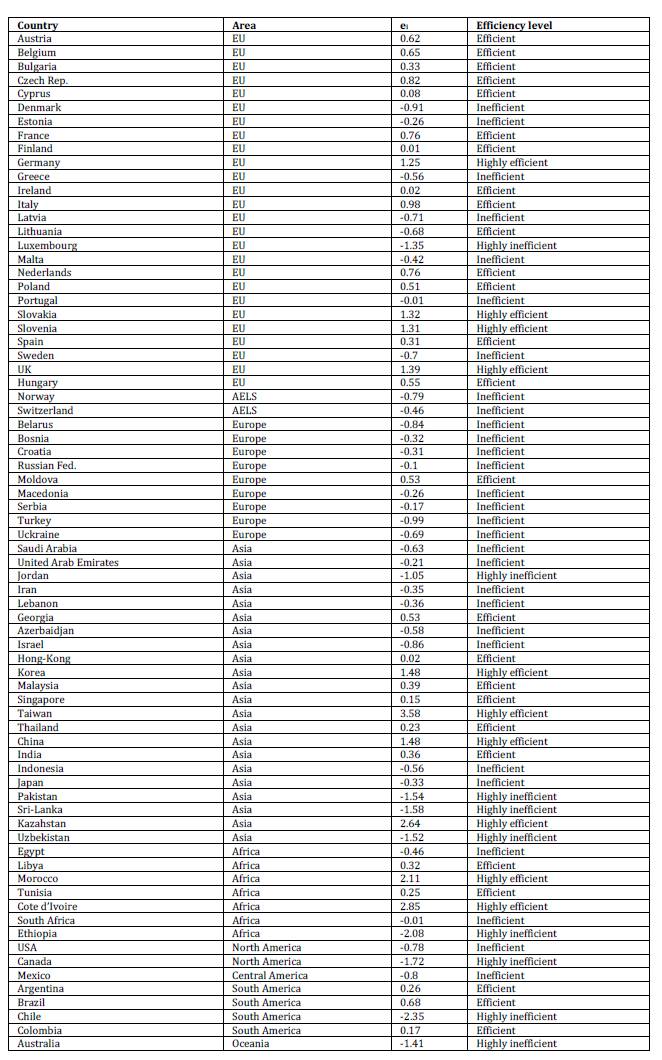
To analyse the efficiency of Romania’s bilateral trade with a partner country, we have analysed the model error series that resulted from estimating the trade model. Negative error values shows that the real value of the BTF is below theestimated one, and positive error values indicate that the real value is greater than the estimated value. The working hypothesis is that negative error values indicate an inefficient trade, which has not reached its potential and positive error value show an effective trade, above the theoretical potential.
To determine the degree of trade efficiency or inefficiency, we calculated, for the error series, the one standard deviation interval around the mean, which is (-1, +1). If the error values are outside the range, then for positive values there is ahigh efficiency of bilateral trade and for negative values we have a highly inefficient trade. The result is presented in Table 6.
Table 6. The Degrees of Efficiency for the Bilateral Trade Flows between Romania and the Partner Countries
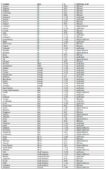
Analysing the data in Table 6, we see that, regarding the area, Romania has the most efficient bilateral trade with EU countries, the rest of European partners deploying ineffective trade relations with Romania, the only exception beingMoldova. It has the most inefficient bilateral trade with the countries in the Middle Asia. The most effective partnershipsare with Germany, Slovakia, Slovenia, United Kingdom, Korea, Taiwan, China, Kazakhstan, Morocco, Cote d’Ivoire, and the most ineffective partnerships are with Luxembourg, Jordan, Pakistan, Sri Lanka, Urbekistan, Ethiopia, Canada, Chileand Australia.
Concluding Remarks
In this paper we presented an external trade model, derived from a gravity model, in order to identify significantexplanatory variables for bilateral trade between Romania and partner countries. Based on the obtained model errorvalues, we determined the partners and areas to which Romania develops, efficient or inefficient, foreign trade activities.
The results for Romania confirm existing studies. Thus, bilateral trade flows (BTF) are explained on the one hand, by theGDP of the partner country, by the FDI in Romania and the existence of a common border, between which we have positive ccrrelations, and other hand, the distance between the two countries, which has a negative correlation with BTF.
Values for the model errors showed an efficient bilateral trade with EU member states and an inefficient one with theother European countries, and the best trade partnerships are with European, East and Southeast Asian countries.
The analysis was carried out for exports and imports of both goods and services, but recent studies have showndifferences between the trade models of goods and the trade model of services, so a further study for the building of a sectorial model for external trade would be very useful.
Acknowledgment
This paper is suported by the project “Post-doctoral studies in Economics: training program for elite researchers – SPODE”, co-funded by European Social Fund Operational Programme Human Resources Development 2007 — 2013, contract no. POSDRU/89/1.5/S/61755.
References
Amrington, P. S. (1969). “A Theory of Demand for Products Distinguished by Place of Production,” IMF Staff Papers, 16.
Publisher – Google Scholar
Anderson, J. E. (1979). “A Theoretical Foundation for the Gravity Equation,” American Economic Review, 69, 106-116.
Publisher – Google Scholar
Baldwin, R. & Taglioni, D. (2010). Gravity Chains: Estimating Bilateral Trade Flows when Parts and Components Trade is Important, Available at www.nber.org/papers/w16672
Publisher
Baxter, M. & Kouparitsas, M. A. (2006). What Determines Bilateral Trade Flows?, National Bureau of Economic Research, Massachusetts, available at www.nber.org/papers/w12188
Publisher
Bergstrand, J. H. (1985). “The Gravity Equation in International Trade: Some Microeconomic Foundations and Empirical Evidence,” The Review of Economics and Statistics, 67, 474-481.
Publisher – Google Scholar
Bergstrand, J. H. (1989). “The Generalized Gravity Equation, Monopolistic Competition, and the Factor-Proportions Theory in International Trade,” The Review of Economics and Statistics, 71, 143-153.
Publisher – Google Scholar
Deardorff, V. (1998). “Determinants of Bilateral Trade: Does Gravity Work in a Neoclassical World?,” In Jeffrey A. Frankel ed., The Regionalization of Economy, Chicago:Univerty of Chicago Press.
Publisher – Google Scholar
Frankel, J., Stein, E. & Wei, S.- J. (1995). “Trading Blocs and the Americas: The Natural, the Unnatural and the Supernatural,” Journal of Development Economics, 47, 61-95.
Publisher – Google Scholar
Glick, R. & Rose, A. K. (2002). “Does a Currency Union Affect Trade? The Time Series Evidence,” European Economic Review 46(6), 1125-1151.
Publisher – Google Scholar – British Library Direct
Helpman, E., Krugman, P. (1985). ‘Market Structure and Foreign Trade: Increasing Returns, Imperfect Competition and the International Economy,’ Cambridge, MA: MIT Press.
Google Scholar
Kimura, F. & Lee, H.- H. (2004). The Gravity Equation in International Trade in Services, disponibil lacc.kangwon.ac.kr/~hhlee/paper/Kimura-Lee-040831.pdf
Publisher
Pöyhönen, P. (1963). “A Tentative Model for the Volume of Trade Between Countries,” Weltwirtchaftliches Archiv, Vol 90, 93-100.
Publisher – Google Scholar
Tinbergen, J. (1962). Shaping the World Economy: Suggestions for an International Economic Policy, The Twentieth Century Fund.
Publisher – Google Scholar
data.worldbank.org/
http://www.wto.org/english/res_e/statis_e/statis_e.htm
http://epp.eurostat.ec.europa.eu/portal/page/portal/statistics/
http://www.insse.ro