Introduction
The renewable sources of energy in Romania (wind and photovoltaic power plants) introduce imbalances in the power system; these imbalances must be taken over and managed by the natural gas transmission systems because fast balancing groups work on gas. The paper presents a method of dynamic management of the gas transmission network in Romania in order to ensure energy security.
The operation of a natural gas transportation system requires real-time information collected from the entry / exit points and from the technological nodes, and this can be achieved by using SCADA type systems. The interpretation of such information, essential in the process of decision making, is processed by software which performs rapid balance calculations on the transportation network providing a near real-time representation of both the transported gas flow and the main transportation parameters.
According to Neacșu and Eparu (2012), for the data on the basis of which decisions are made to be accurate, the numerical simulator that processes these data should be based on a properly calibrated model of the transportation network and, if possible, it should have certifications attesting the accuracy of the results. In Europe, the most often used numerical simulator of natural gas transportation is SIMONE.
Using this type of infrastructure consisting of SCADA + numerical simulator, Eparu et al., (2011) showed that the dispatcher can simulate any manoeuvre that is to be performed later on, or he/she can plan the transportation schedule for the forthcoming day based on the current day balance values, and also on the customer requirements collected in the nominations.
For larger transportation systems, like the one in Romania that covers over 13.000 km with more than 1.000 exit points and 130 entry points, Neacșu and Eparu (2012) emphasized that the planning of the schedule for the following day becomes difficult because of the large amount of data that must be handled in a short period of time. To overcome such difficulties, it is necessary to design an IT platform useful for the dispatcher to plan the following day schedule or to simulate various manoeuvres.
In this paper we shall present the concept of such a computing platform, a platform that is currently being developed at Transgaz SA, the company in charge with the national gas transportation system in Romania.
The Use of Simone for Simulations on a Gas Transport Network
The Simone simulator is the main engine performing both real-time interpretations of the data collected by the SCADA system as well as simulations. Simone is a numerical simulator that allows the calculation of gas flows and other related quantities using the network transportation graph. Simulations can be performed on line, using data from SCADA, or off line when aimed to plan the transportation programme or to find solutions for various situations.
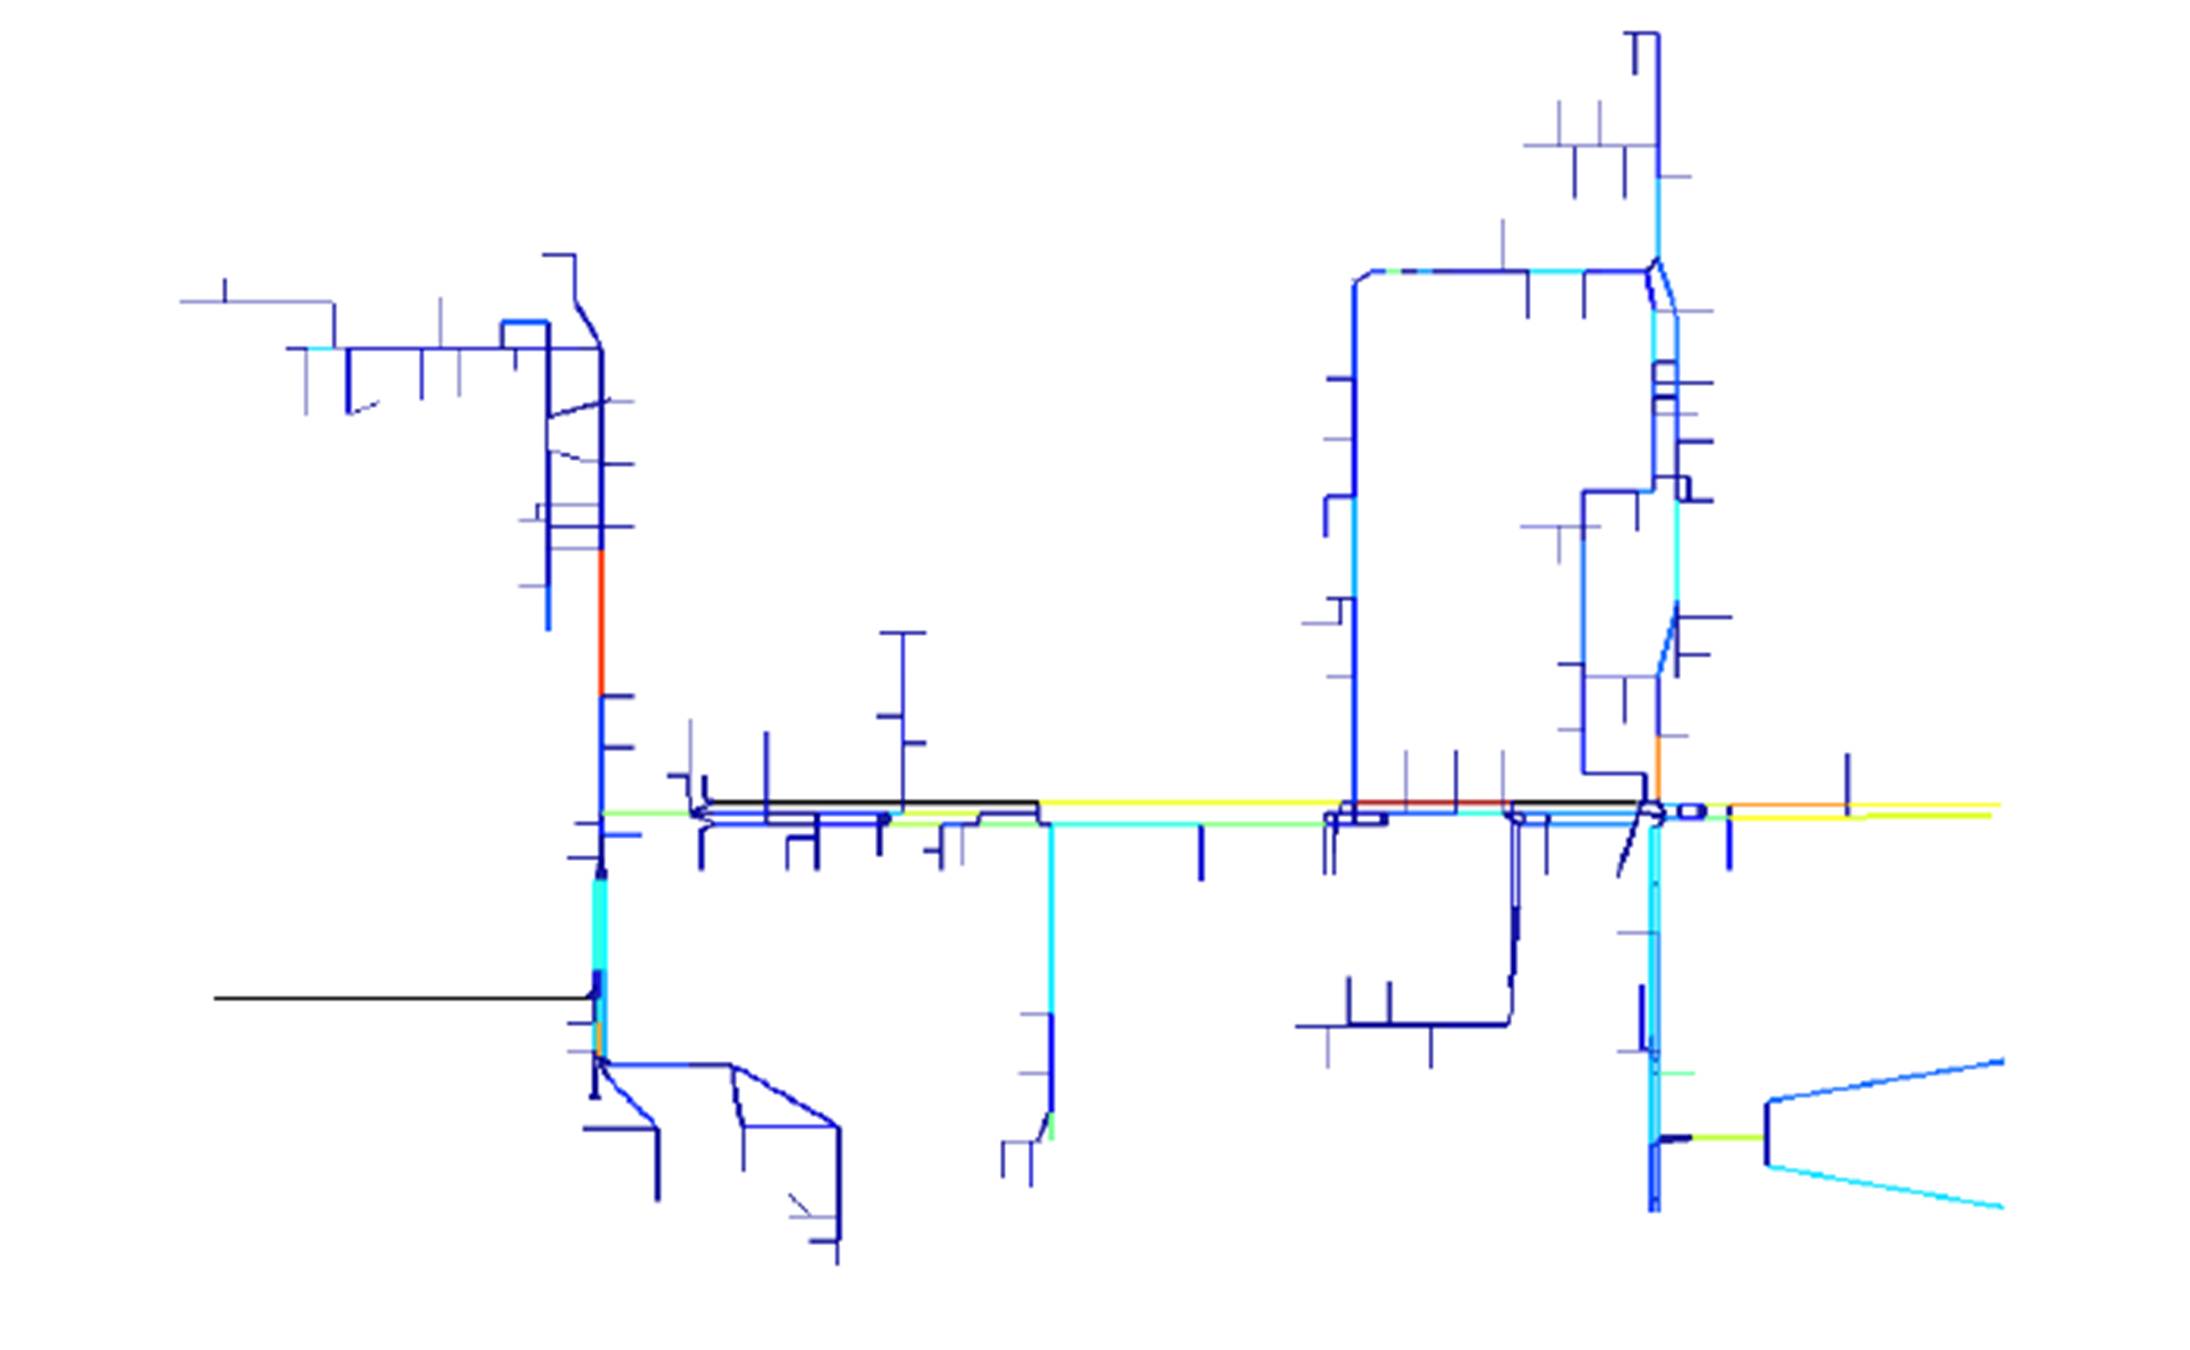
Figure 1 shows the result of a specific simulation performed on the gas transportation system. The pressure fluctuation within the gas network is highlighted in this image by means of a colour code, as underlined by Neacșu and Eparu (2012).
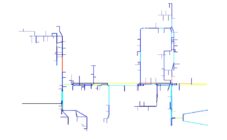
Fig 1: The result of a simulation within the transportation system
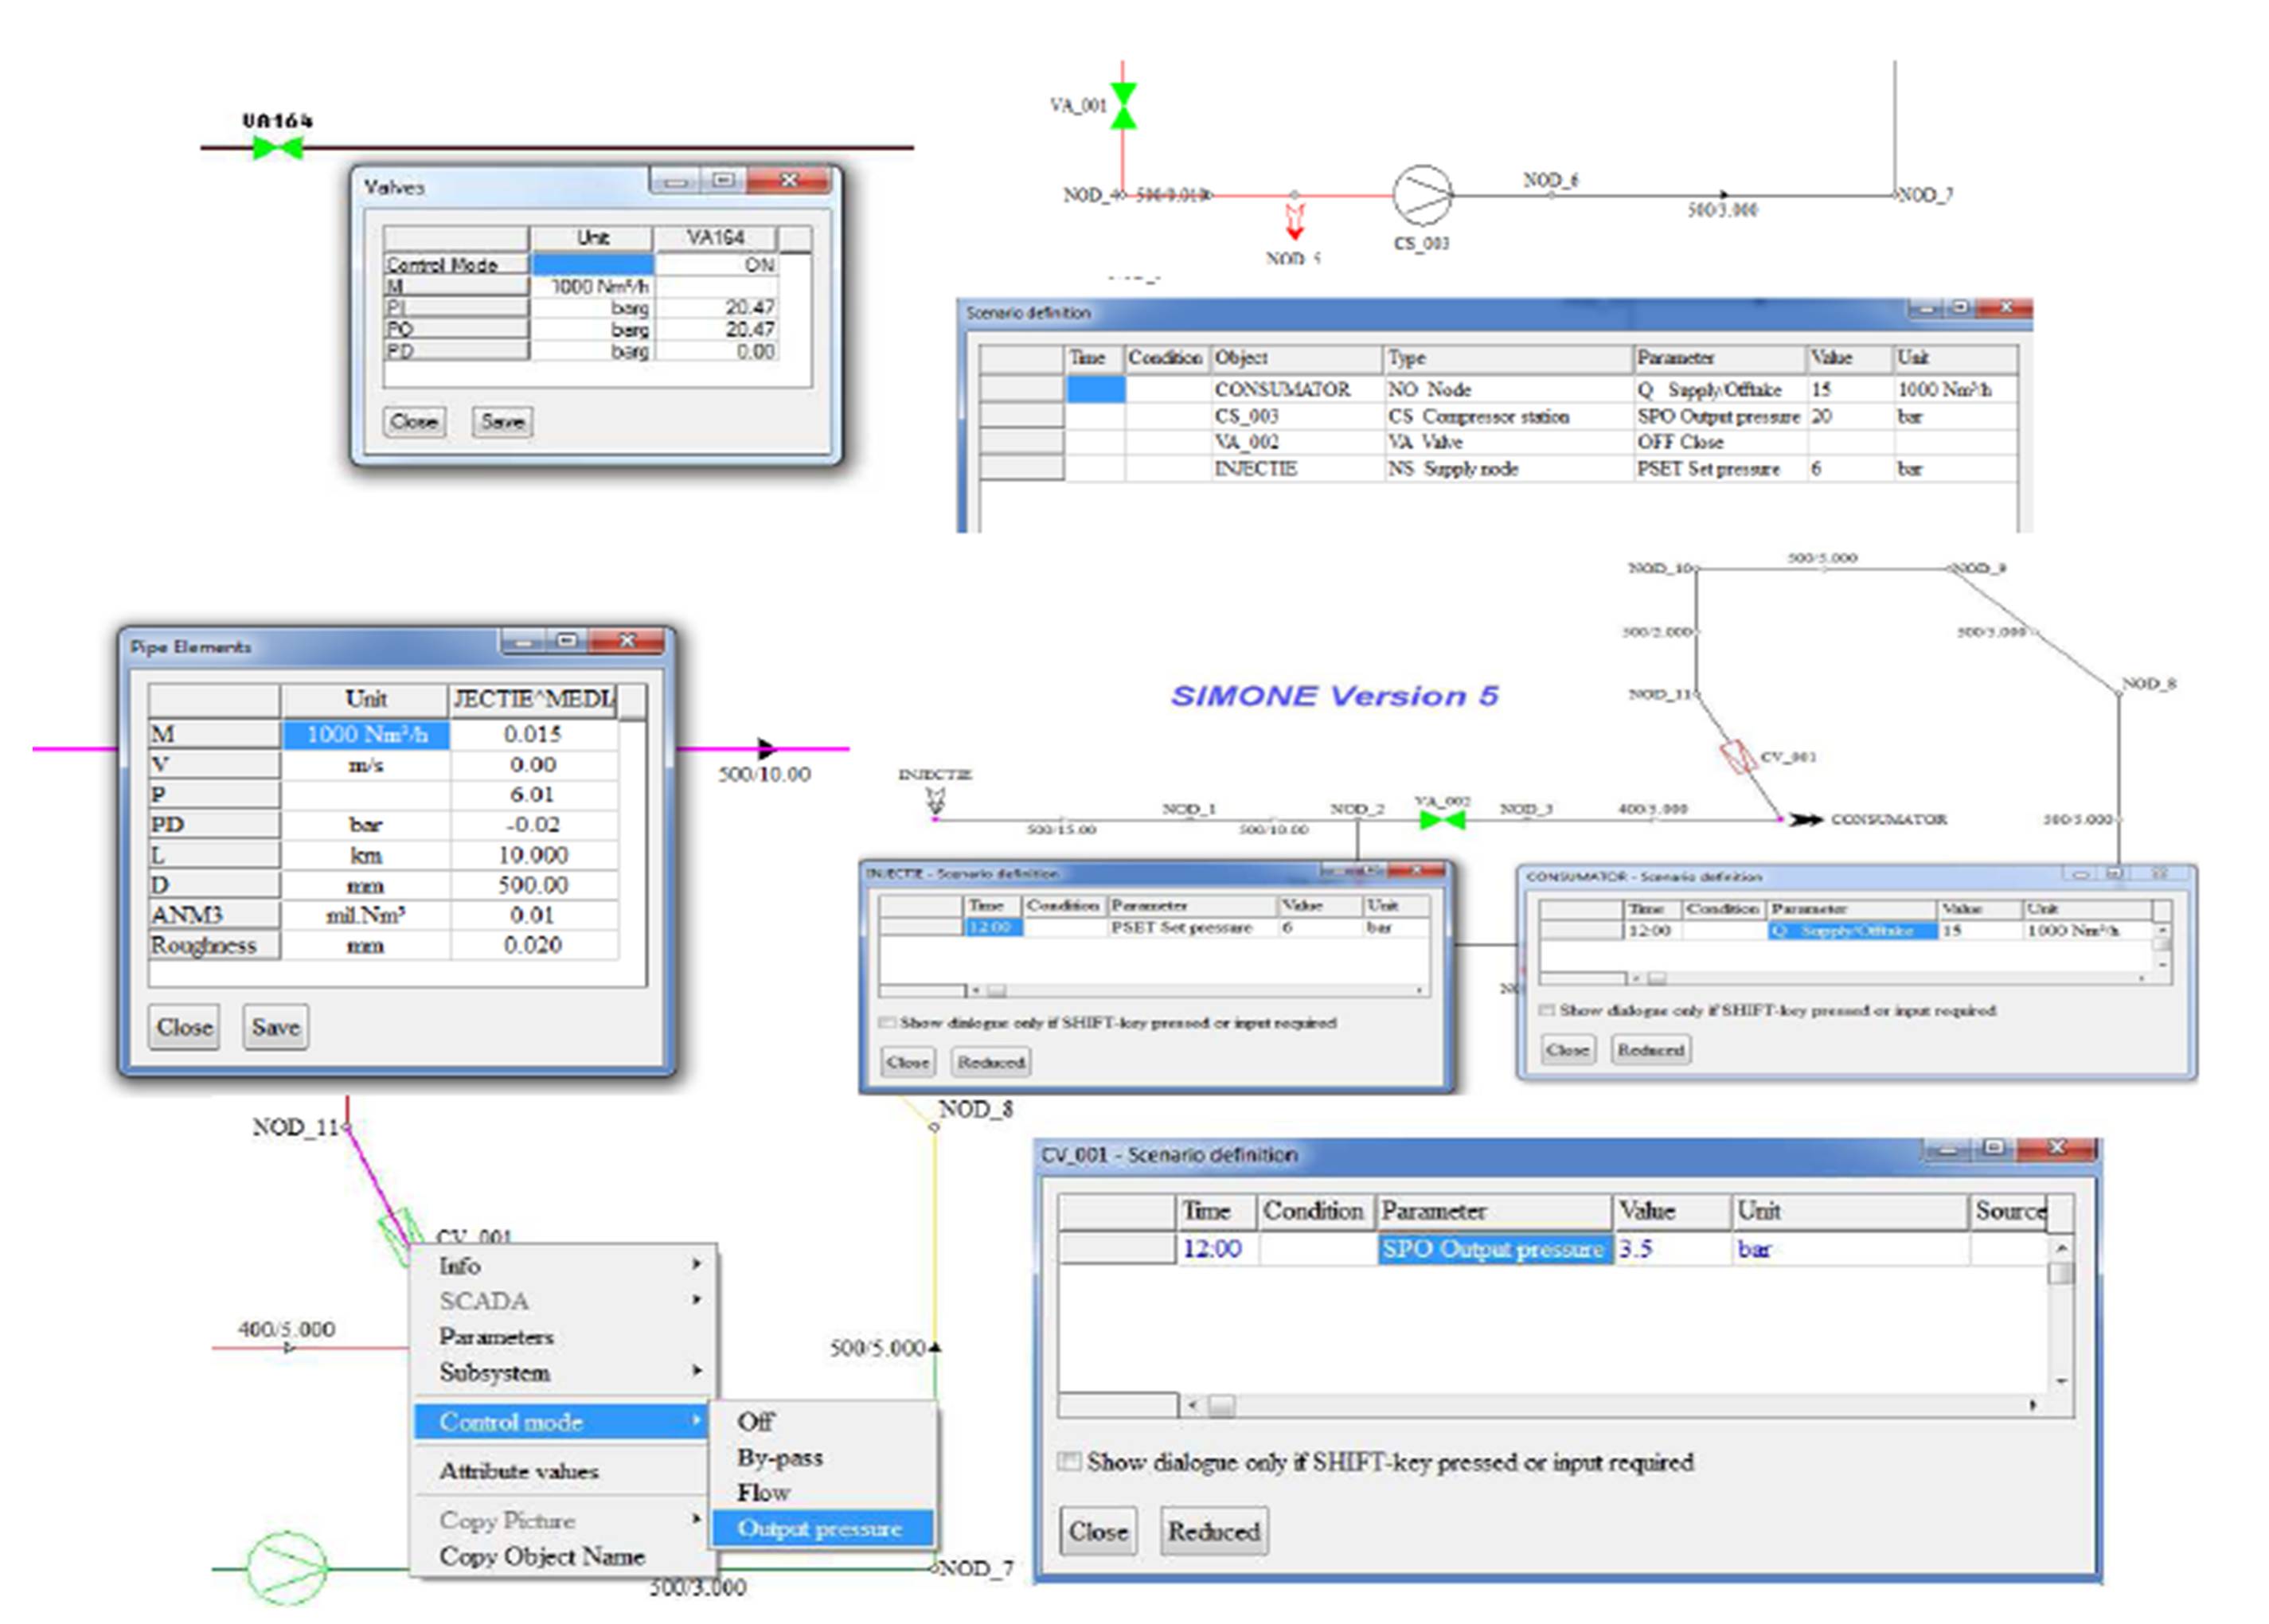
For such a simulation to be performed the transportation system must be loaded with the rates of the exit flows assessed within the Regulation and Measurement Stations, with entry pressure / flow rates, and in addition, there need to be introduced other operating manoeuvres such as closed, open or partially open valves, regulation values within the regulators, manoeuvres within the compression stations, etc. How to set these parameters in the simulator is shown in Figure 2.
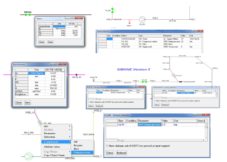
Fig 2: How to set parameters for elements within the network
The amount of data required for a simulation is proportional to the size of the transportation system; for large transportation systems, the period of time needed for the preparation of data is critical, therefore it has become necessary to design an IT platform meant to take over the preparation of the necessary data for the actual simulation, the dispatcher’s task being thus reduced to intervening only punctually with adjustments and settings in the areas of interest.
Checking the charging of the exit points based on consumer profiles
According to ANRE (2013), ENTSOG (2010), ERGEG (2010), exit flows within the transmission system shall be assessed on the basis of daily nominations of the gas volumes required by customers. These flows are checked by taking into consideration the consumer profiles for each exit point to see the degree of request. Without these checks, there is a risk for the customers to use the gas quantities taken in daily as a short term loan since payments are made on a monthly basis.
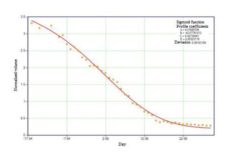
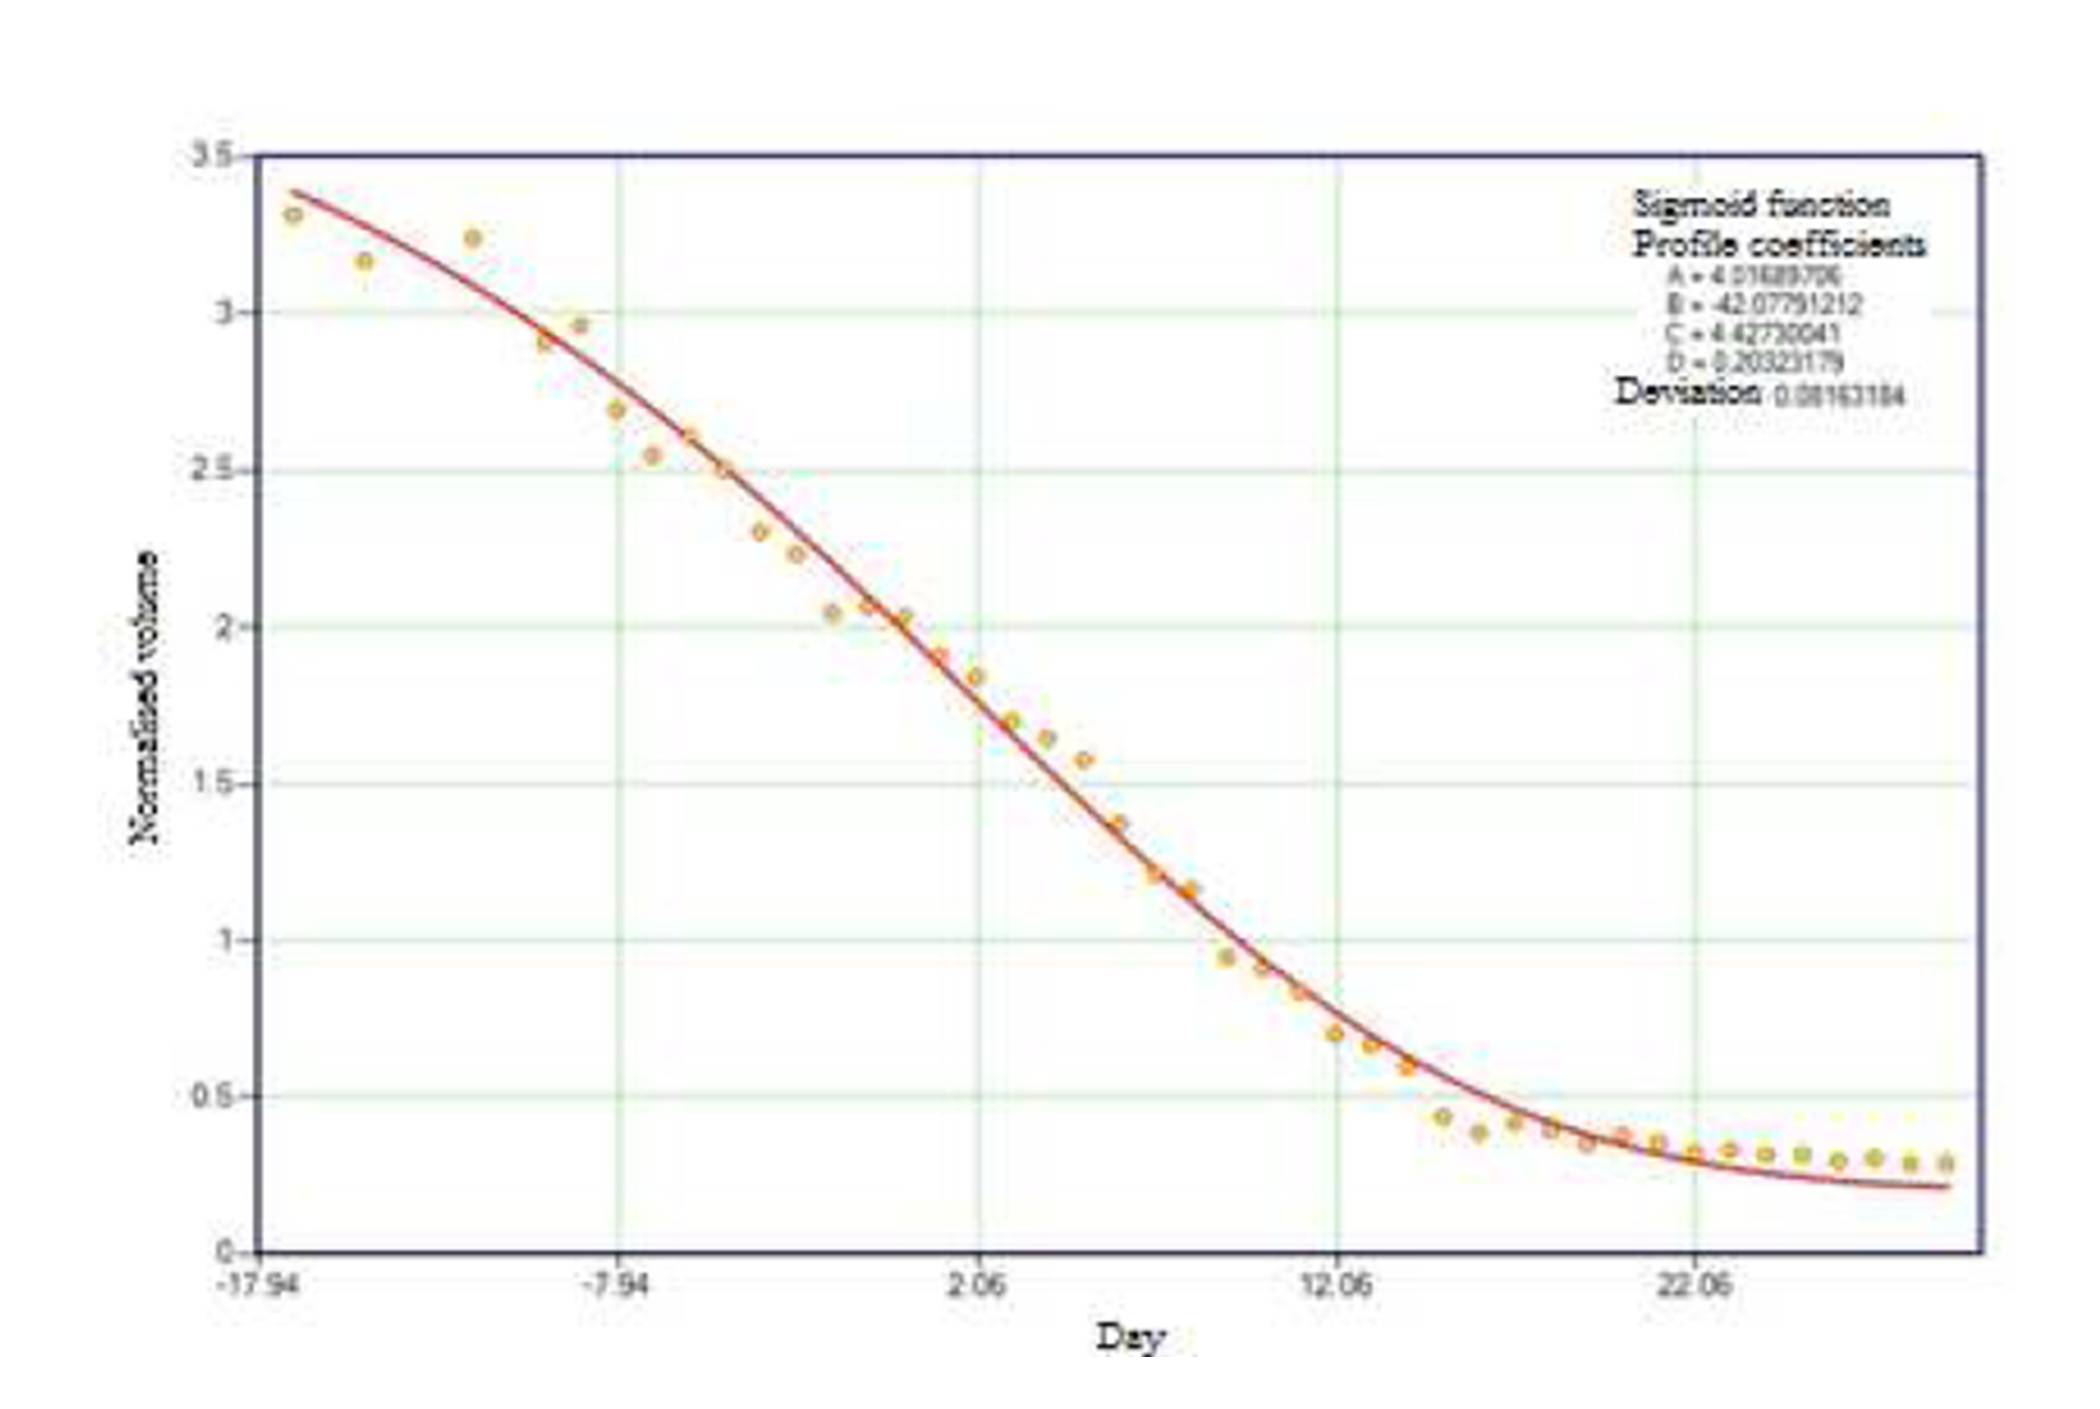
Fig 3: Consumption profile
Profiles for an exit point feature a variable component depending on temperature, as illustrated in Figure 3, a calibration depending on the day of the week and a daily variable consumption factor, forecasted on the basis of previous day’s consumption values that outline the consumer behaviour proper to each customer, as depicted in Figure 4.
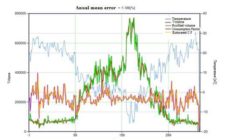
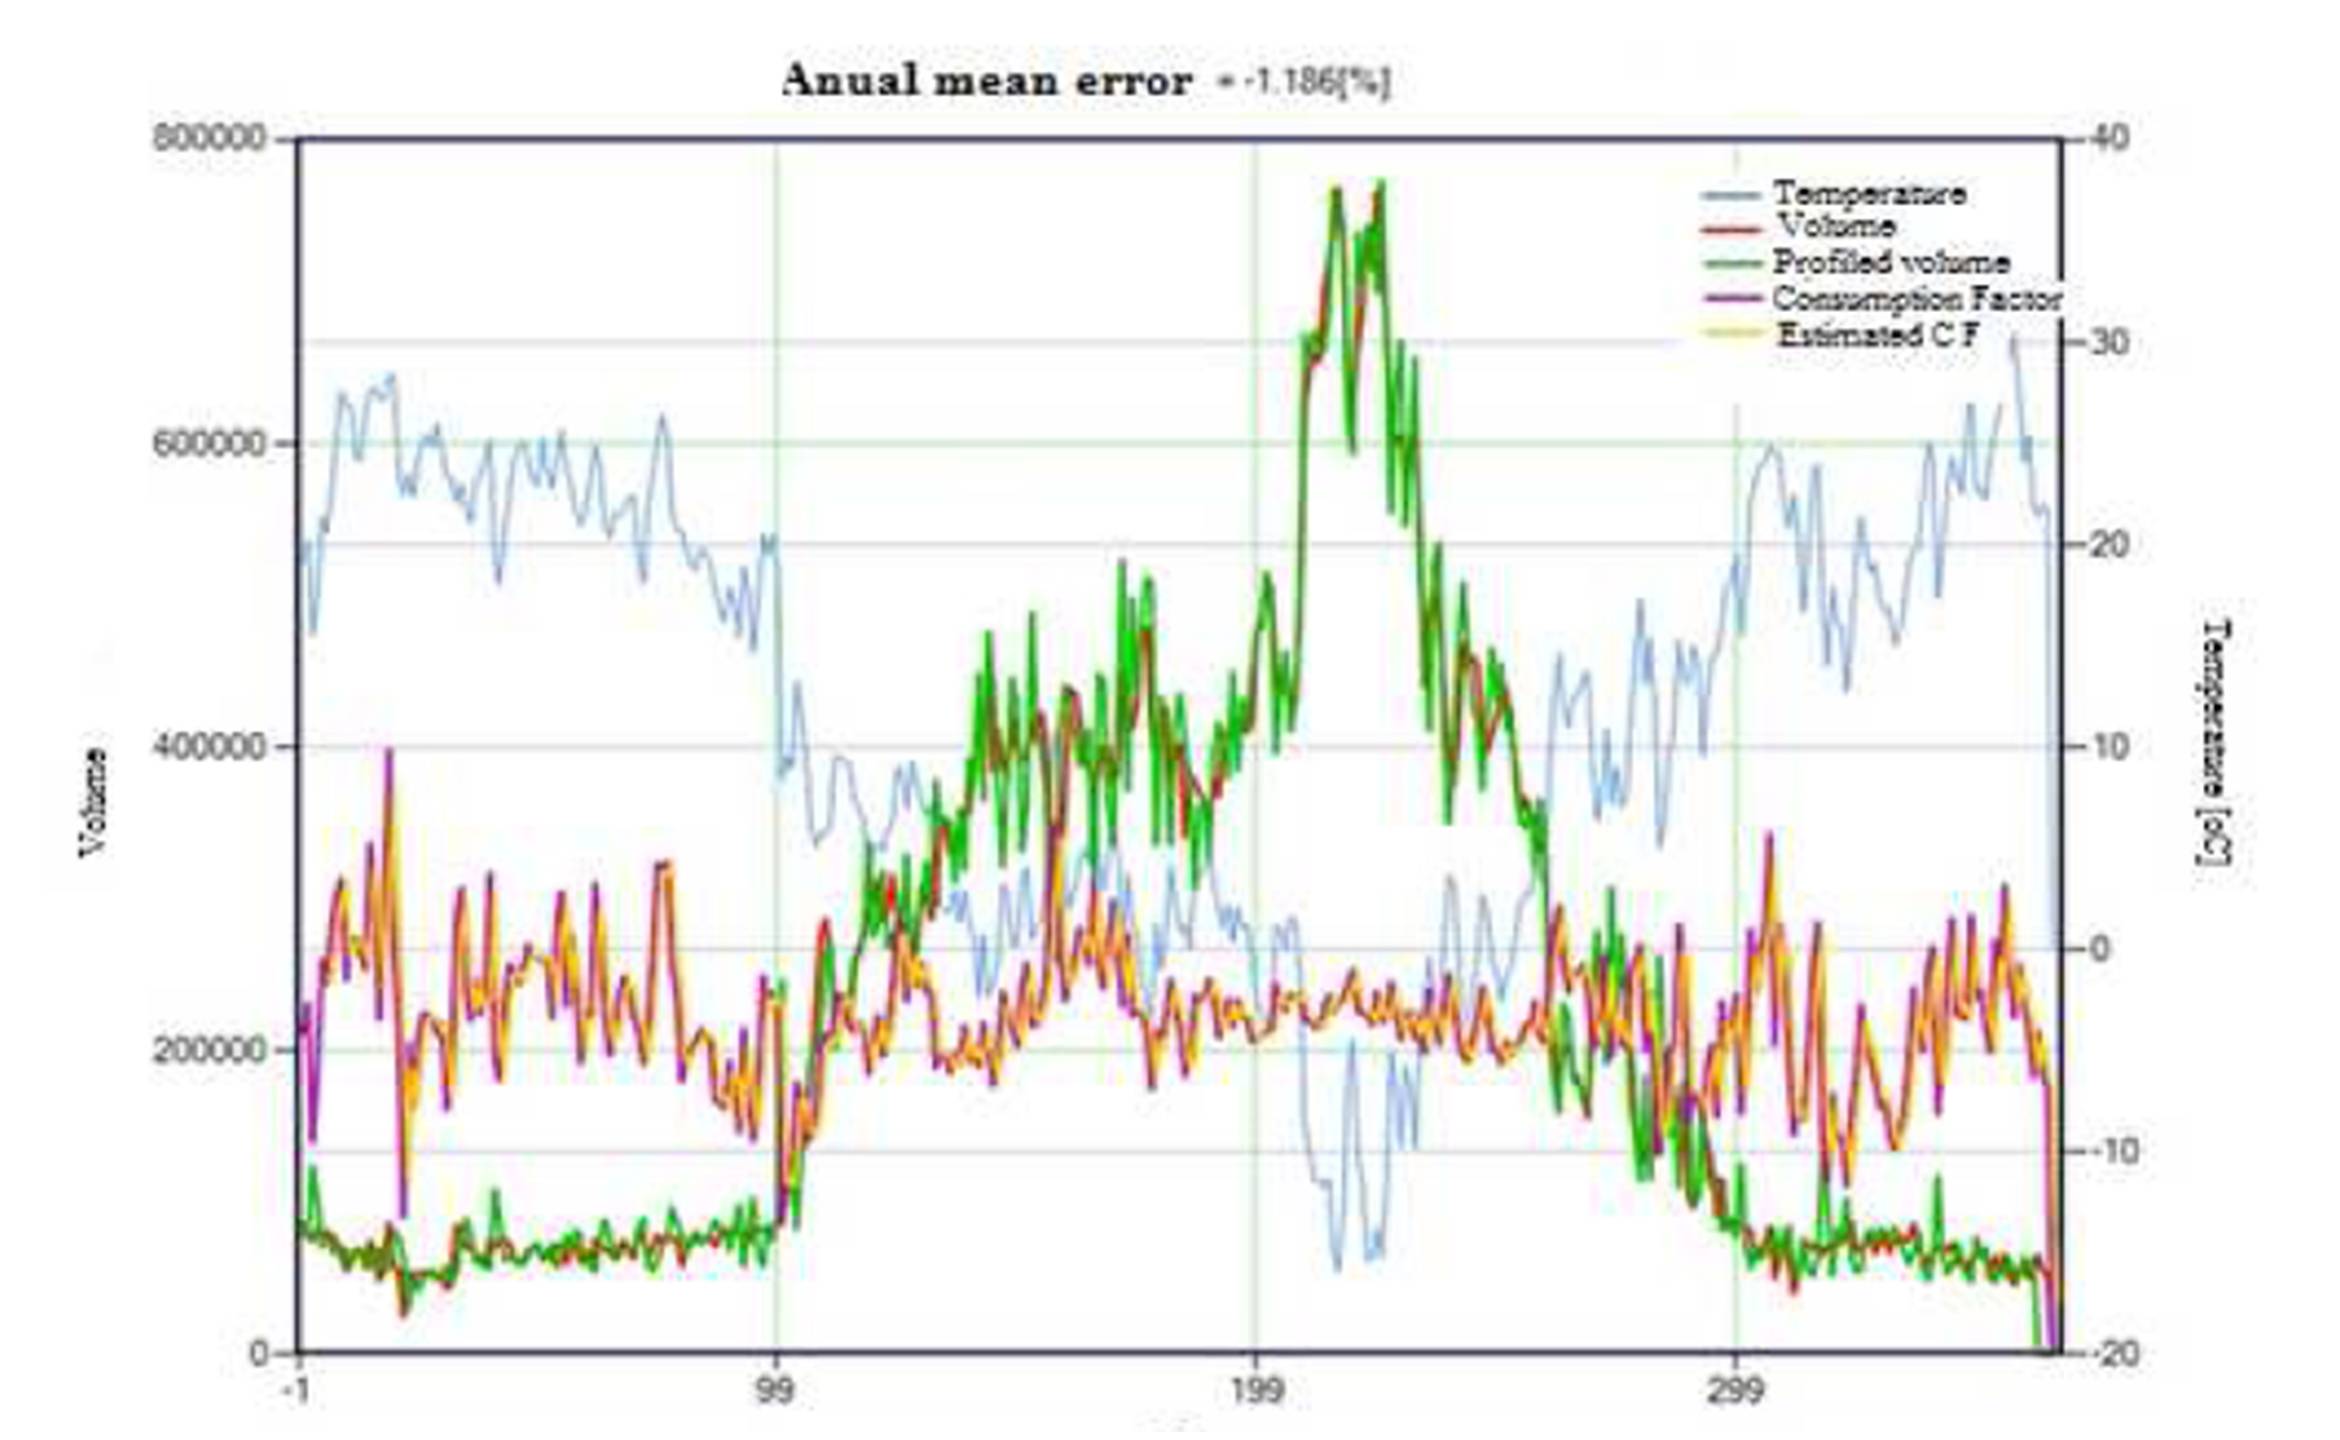
Fig 4: Comparison between actual consumption values and variably profiled consumption values
within a gas year
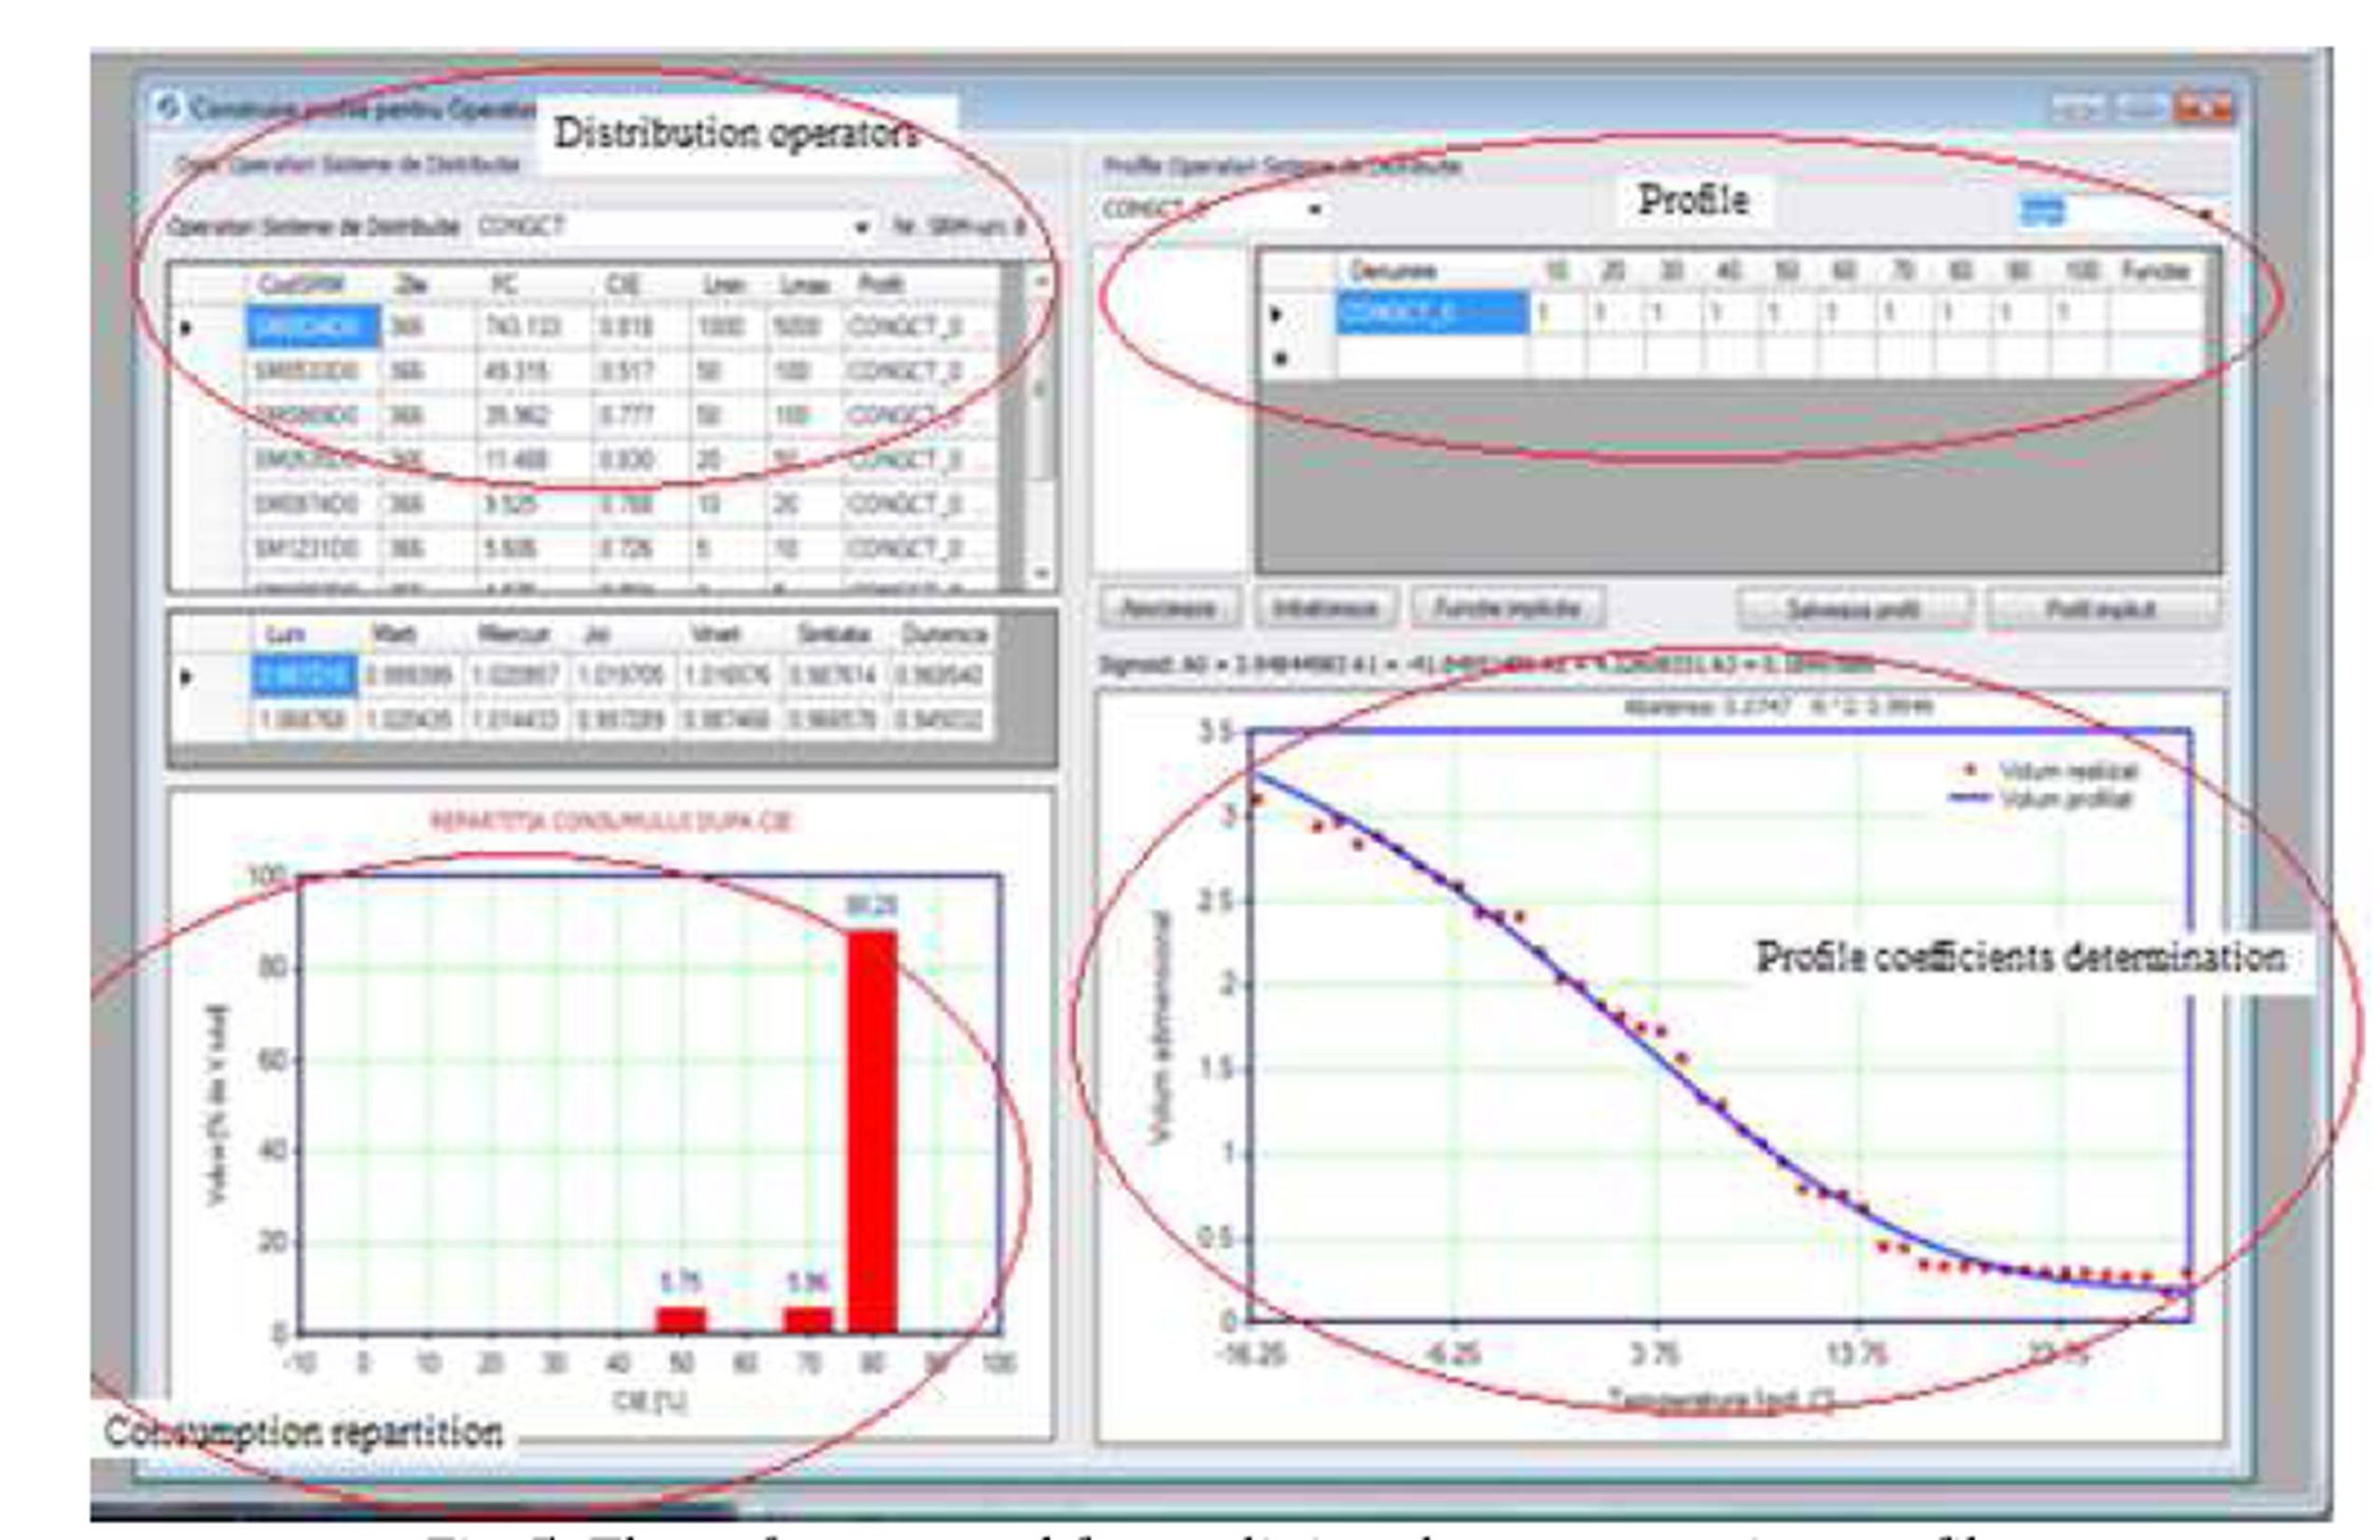
In order to outline consumption profiles and their operation, a software component is required, as pictured in Figure 5. This has already been achieved and it is working for Transgaz and it is to be integrated in the operating platform.
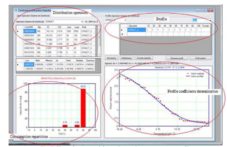
Fig 5 : The software used for outlining the consumption profiles
Presenting the Concept of the Operating Platform Within the Transportation System
Figure 6 depicts the structure of the operating platform and the information flow. The main aim of this platform is both to facilitate the work of the dispatchers when planning the forthcoming day’s schedule, and also to provide the dispatcher with a reliable and fast device that enables the simulation of commands in cases of emergency. Hence, the dispatcher can quickly overview the outcomes of the commands and is thus able to make the best decisions.
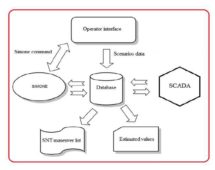
Fig 6: Diagram of the operating computing platform within the transportation system
The general concept of the platform is to fully automate the simulations made by the dispatcher. Thus, the scenario is always automatically generated from the database. The operator intervenes only where he/she wishes to change the settings of certain devices.
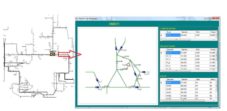
Fig 7: Representation of the operator’s proceedings
Figure 7 illustrates the operator’s means of intervention. He/she selects the technological node (or the object he/she wants to access) from the diagram of the transportation system. As a result of this action, a window opens and the current values of the accessed devices are displayed. The operator may prescribe new values.
After prescribing new values, the operator can command a simulation and can overview the resulting values. He/she will repeat this procedure until the desired results are achieved. By this time the platform has completed the list of operating manoeuvres required for the forthcoming day. These can be programmed within SCADA the following day. A sample list is shown in Figure 8.
Fig 8: List of manoeuvres
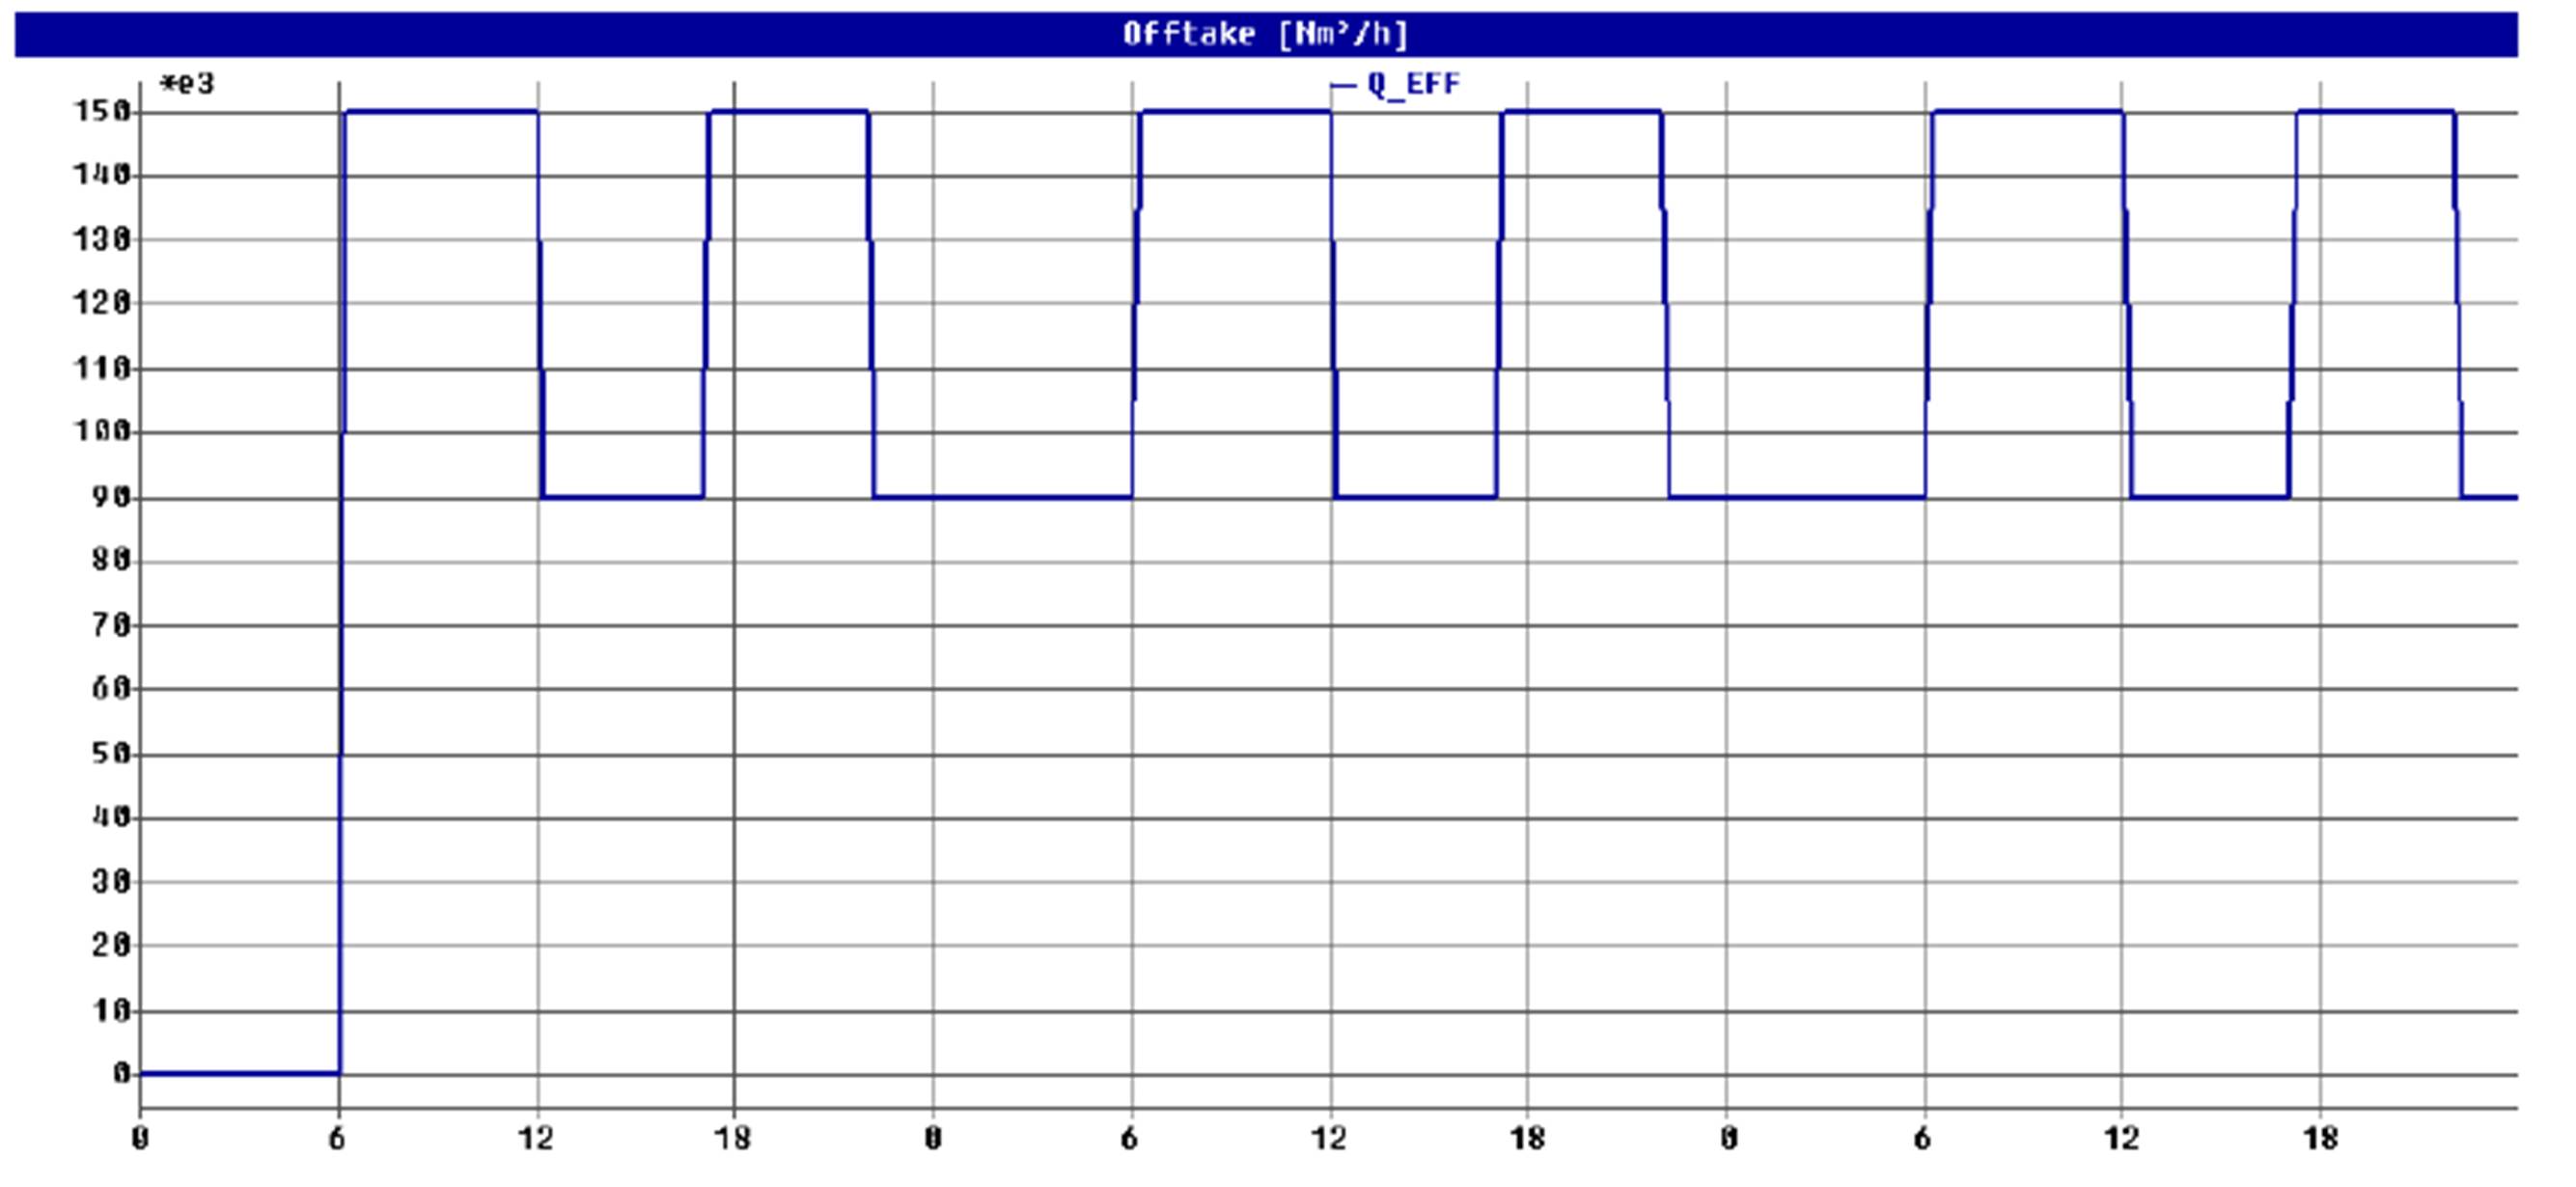
Since each customer consumes gas according to his/her needs, transported gas flows are not steady within one day; according to ENTSOG (2010) they will be influenced by consumption dynamics. An example of a parameter change in the case of an industrial consumer is illustrated in Figures 9 and 10.
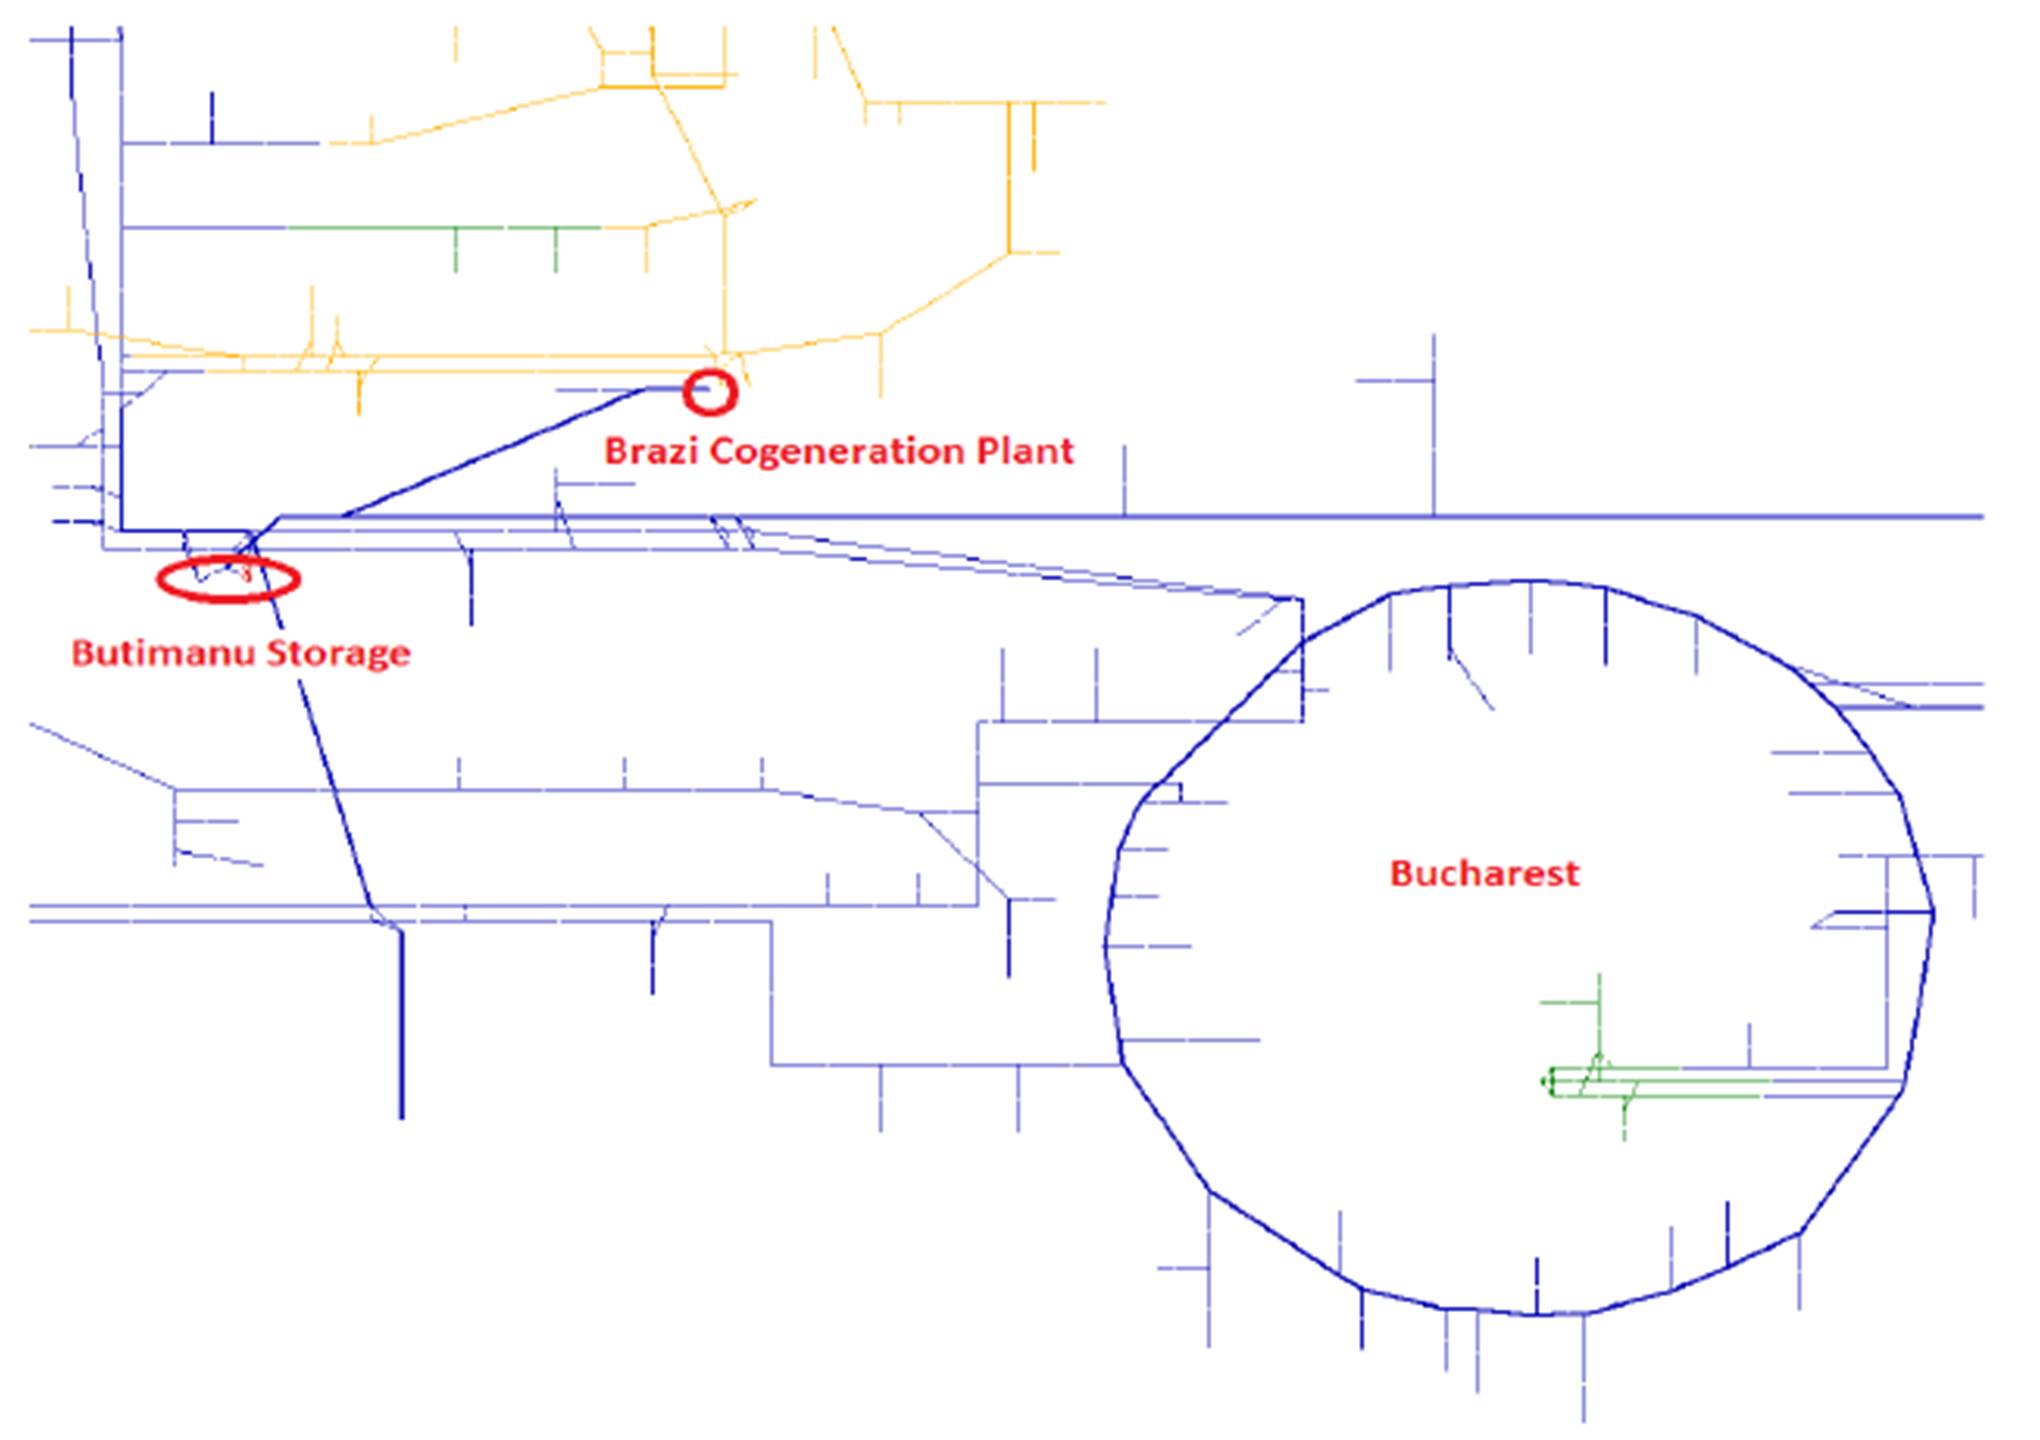
Fig 9: The layout of consumers’ positioning in the network for the presented simulation
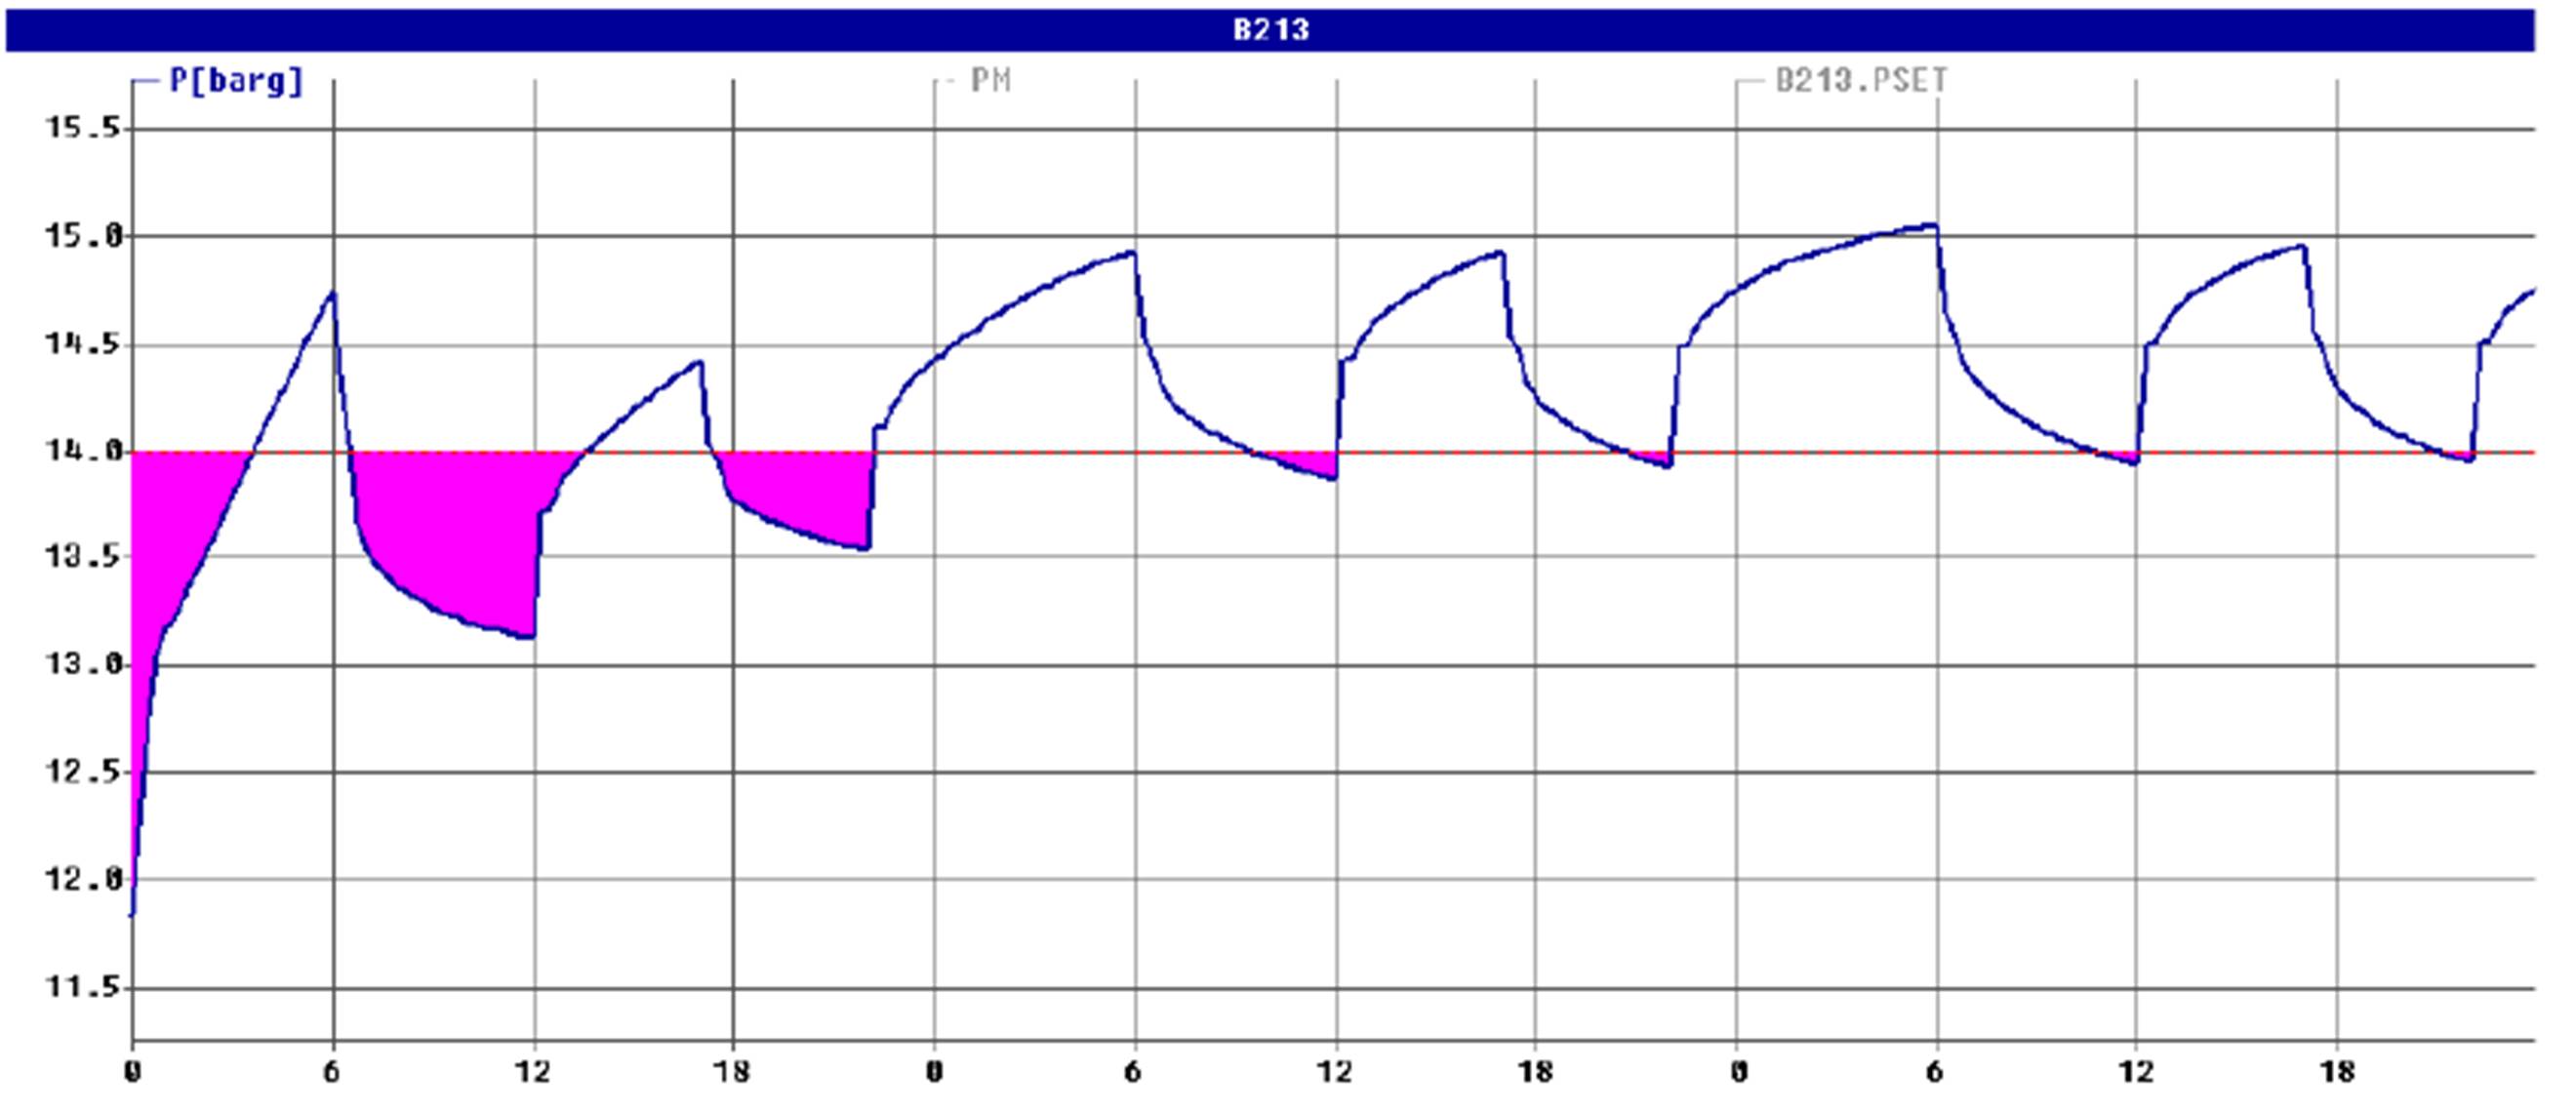
Because of the modulated flow, ranging between 90.000 and 150.000 Nm3/h (Figure 11), the pressure is variable. Areas where pressure falls below 14 bar (in red) are areas where the consumer has manufacturing problems.
Fig 10: Pressure fluctuations in the case of an industrial consumer
Fig 11: Changes in flow in the case of an industrial consumer
All these aspects considered, we can reason out that the simulations performed in order to plan the upcoming day’s schedule are dynamic simulations. Thus, to obtain the gas flow dynamics along with the daily consumption profiles, hourly consumption profiles specific to each exit point are used.
Besides facilitating the work of the dispatcher, the platform will be equipped with learning software designed to perform operating procedures and solve critical situations.
Conclusions
The informatics platform is designed to facilitate the work of dispatchers who operate the gas transport system in Romania. It is a powerful tool that enables the efficient preparation of the transport program for the following day, allowing rapid simulation of any manoeuvres that are performed in the system and it also solves situations of crisis.
Based on this informatics platform, standard operating procedures for handling emergency situations can be performed. The dispatcher will always receive competent care for each manoeuvre.
The computing platform presented in this paper, along with the SCADA system, is being currently implemented at Transgaz SA, the company that manages the natural gas transportation system in Romania.
In order for this platform to be completed, it was necessary to design the basic elements. Thus, several applications have been developed: a computer model for the transportation network designed for the Simone simulator, a software module designed for calculating the capacity specific to all exit points along the National Transportation System and a software module designed for calculating the consumption profiles at the National Transportation System’s exit points, and also the generating of gas-flow forecasts observed in different directions.
An integration module for SCADA, as well as a module designed to automatically perform simulations are currently in progress. Eventually, all these modules will be integrated in the computing platform. Due to the particularities of the data used for the simulations we opted for a specific database.
References
ANRE, (2013), ‘Codul Retelei pentru sistemul naţional de transport al gazelor naturale,’ http://www.anre.ro/ documente.php?id=739
ENTSOG, (2010), ‘ENTSOG Web Survey on Capacity Products and Allocation Methods Analysis Report,’ CAP010-10,http://www.gie.eu.com/memberarea/purtext_entsog_congestion.asp?wa=plus_congestion
ERGEG, (2010), ‘Capacity Allocation on European Gas Transmission Networks. Pilot Framework Guideline,’ Ref: E10-GWG-66-03, http://www.energy-regulators.eu/portal/page/portal/EER_HOME/EER_ACTIVITIES/ Input_to_Framework_Guidelines/Gas/Capacity%20Allocation%20Management/Overview/E10-GWG-66-03.pdf
Eparu, C., Neacşu, S., Albulescu, M. and Rădulescu, R. (2011), ‘Considerații privind simularea dinamicii fluxurilor de gaze naturale în sistemele de transport,’ Termotehnica Revue, XV (1), 17-24
Neacșu, S. and Eparu, C. (2012), ‘Presentation of some aspects related to the use of SIMONE in modelling the gas transport network in Romania,’ 11th SIMONE Congress, 13–15 June 2012, Bratislava, Slovakia, 05
Simone 5.7, http://www.simone.eu/simone-company-about.asp