Introduction
Wealth and poverty have been the main objects of interest of many economists in times when economy was born and currently as well. It is natural because poverty is a negative phenomenon which accompanies mankind all the time. That is the reason why economists search for possibilities of how to remove or reduce it. In other words, we search for ways of achieving wealth. In order to achieve this aim, poverty and wealth must be properly defined, and it must be properly understood which factors influence poverty and wealth. Subsequently, it can be measured and analyzed. The, current economic theory contains various conceptions but nothing is ideal and it suffers from various limitations. Therefore, it is still necessary to search for ways of improving the welfare theory which is unexceptionably one of the most important theories in social science.
Theoretical Approaches to Social Welfare
The contemporary economic theory takes into account low inflation rate, low unemployment rate, high economic growth and stable balance of payments as a standard aim of economic policy.
These indicators are usually depicted in a famous magical quadrangle. In fact, it is a base for the main aim of the economic policy – social welfare. The economic theory developed three basic approaches to define a concept of social welfare.
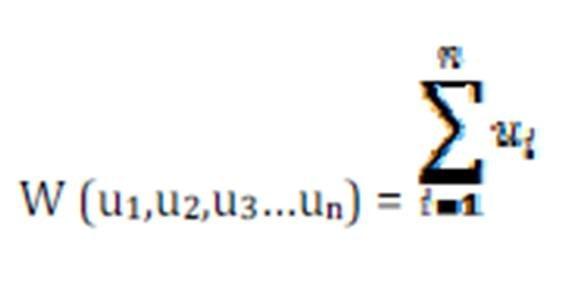
Utilitarism-utility is a key category in viewing at human behavior. The first author who dealt with this problem in detail was J. Bentham. According to Bentham (2000), we can define the social welfare as a sum of welfare of individuals. It is in vain to talk of the interest of the community, without understanding what the interest of the individual is. We can express this by formula:
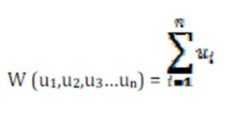
Where W represents a social welfare function and ui represents the welfare of the individual.
The ideal acting of an individual is considered if every member of society increases social welfare by increasing their own individual welfare. S. Ch. Kolm (1994) adds that social welfare defined by J. Bentham (2000) cannot be found as the main aim due to the fact that social justice and rationality are even more important. Generally speaking about welfare, we therefore cannot prefer the social welfare function only.
Neoclassical Economy – the most important ideas concerning social welfare were published by A.C. Pigou. From his point of view, it is useful to deal with economical welfare instead of social welfare. It is essential that the economical welfare can be measured. There are also some suggested indicators e.g. gross national income or household’s consumption. Underlying the problem of theoretical construction of economical welfare is that when individual’s income increases, marginal utility of money decreases. Simultaneously, the marginal utility of a rich person should be smaller than the marginal utility of one monetary unit of a poorer man adds Vondráček (2007).
New Welfare Economics disagrees with cardinalist approach and develops ordinalist criterions. It is assumed that measuring utility is impossible. In connection to this, the economic theory contains a compensation principle which means a more effective case in which a Pareto optimum is achieved after compensation from those who are in a better situation to those that are in a worse situation. New Welfare Economics treats the-inter personal comparison of utility as an unscientific method of measuring economic welfare, and introduces the Compensation Principle as an objective test of economic efficiency (Sinha, 2007). The compensation principle deals with the problem of diverse outcomes: while some may be affluent under new arrangements, others may be poorer. This idea can be used in various contexts – e.g. the differences between perfectly and imperfectly competitive systems, free and restricted trade, prewar and postwar economies etc.
All of the mentioned approaches are theoretical constructions which cannot be used in practical measuring. The social welfare in various countries cannot be compared in such a way due to the fact that data required are never possible to be collected.
Using GDP as a Social Wealth Measure
It is clear that social welfare and quality of life are connected with development. Clarke and Islam (2003) claim that there is a deficit in the specific literature which can be described as a lack of clarity in the application of the welfare concept. Authors point out that for the first time Hicks (1940) and Pigou (1962) used GDP as a social welfare indicator. Furthermore, Clarke and Islam suggest measuring the welfare of development in society by adjusted GDP as a social welfare function. The economic reasons for taking GDP as an indicator of social welfare are following:
GDP itself is a justified indicator of economic activities and outputs – welfare contains economic aspect which is a reason for considering GDP as a measure of economic social welfare.
Since social welfare is a function dealing with consumption and providing production of goods, GDP seems to be a measure of social welfare suitable enough.
It offers seeing GDP as welfare indicator because it is obvious that when the economy grows, our welfare grows as well.
Measuring social welfare based on adjusted GDP takes into account expenditure on health, corruption, water and air pollution, non-renewable resources, commuting, etc. Adjustments include environmental changes, freedom, and the accomplishment of other basic needs.
Other empirical works focus on housing wealth instead of social welfare. In these studies, there are examined correlations between housing wealth and e.g. consumer behavior.
The consumption behavior can be strongly influenced by wealth. According to Bostic et al (2009), there are several options of how to explain this phenomenon. Firstly, individuals may take some kinds of wealth as transitory or unsure. Secondly, some kinds of wealth may be transformed into liquid money only with difficulties. Thirdly, when being in debt, different types of wealth can have different impacts on the individuals.
The households’ wealth is connected with the social welfare. It can be said that if households’ wealth is growing, so must social welfare. It is due to the fact that in macroeconomic theory there are several types of economic subjects and one of them are households. Except households there are some firms, foreign subjects and the state. Households get wages and other incomes by hiring their factors – the wages are paid by the other subjects in economy (namely by firms or by the state institutions). Firms make a profit. It is due to the fact that their product is demanded by households, foreign subjects or by the state. Revenues of the state are mainly various types of taxes. The state does not get wages and if there were no state firms based on profit making, there are no profits. Foreign subjects can be foreign households, foreign firms and a foreign state as well. This is quite complicated, but it is obvious. Foreign subjects make a demand which is in statistical records called export while import represents domestic demand of foreign goods and services. By the view of budget structure, it is important that the revenue of one subject is exactly the expenditure of other subjects. In other words, the expenditure of one is exactly the revenue of another. In fact, this is also known as a macroeconomic cycle.
As we can see society is a complex of many interactions and within systems. The systems contain the social, economic, political, environmental interactions. All the interactions can be summarized as social ecological and economic system – the SEE system. But GDP measures and aggregates only one part within the SEE which means that GDP changes do not reflect changes in the whole SEE system. GDP growth is only a partial contribution to the social welfare.
Using GDP as a social wealth measure is connected with the following problems:
* Welfare is a situation in a particular moment in time and comparing consumption et cetera in two periods is not an ideal solution (GDP data are annual).
* Individuals also have no choice when it comes to experiencing the welfare at present and in addition to this, preferences change over time.
* Income distribution changes lead to a problematic usage of price indexes.
* GDP does not take into account household production e.g. upbringing, housekeeping, food production in a small range although it is meaningful especially in developing countries.
* GDP considers economic activities irrespective of its negativity (e.g. pollution).
* Human freedom is without doubt a concept vital to welfare but it is difficult to express it in monetary terms.
* Consumer’s loans increase GDP in the short-run while in the long-run mean decreasing welfare due to the fact that the resources must be repaid.
Stiglitz et al (2009) remind that today there is assertion that better metrics are needed, and we have to be aware of limitations which are connected with metrics which are used nowadays.
Measuring development, it is suggested to consider the social choice theory. Authors raise the question of the individual’s well-being which is influenced by material goods and also by many other factors. Some of the factors can be measured objectively, whereas some other factors are burdened by a subjective approach (e.g. feeling of safety). And it is also important to note the concept of quality of life. According to Stiglitz et al (2009), there are 3 approaches in the measurement of quality of life:
a) quality of life depends on a subjective perception;
b) quality of life depends on the perception of own capabilities
c) quality of life depends on individual preference
Construction of the HDI and its Pros and Cons
GDP can be adjusted in various ways. Such adjustments may be related to freedom, education, health etc. Actually, these categories are included in the HDI (Human Development Index) in order to overcome GDP cons. The original HDI construction was based on GDP, but contained also life expectancy at birth and level of adult literacy plus length of school attendance. Assuming all the components are equally important, there are used equal weights:
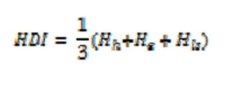
where Hi is a sub-index for dimension I, with i={h-health, e-education, ls-living standards}
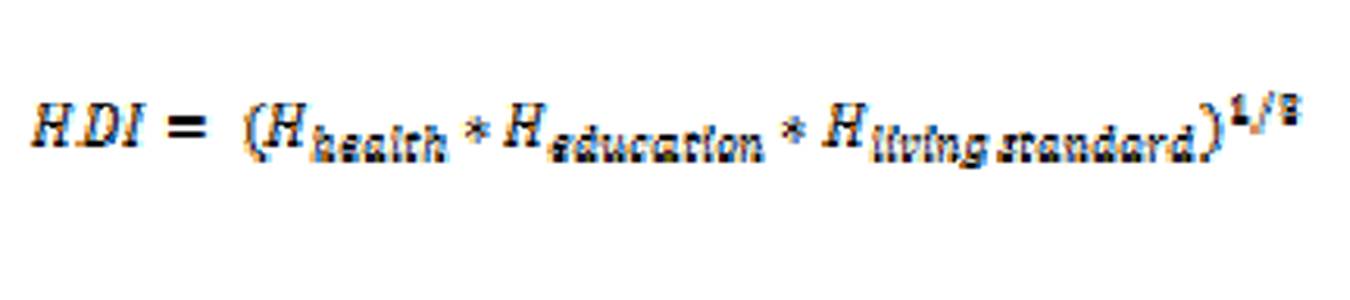
Construction of the HDI little changed since 2010. Currently the HDI is calculated as follows:
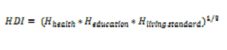
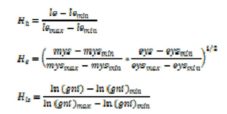
where Hi represent normalized indicators. For example Hhealth is a part of HDI indicator which measures life expectancy, whereas in case of e.g. living standard dimension Gross National Income (gni) is used instead of GDP. The education dimension is formed by mean years of schooling (mys) and expected years of schooling (eys). Under these circumstances:
The new form of HDI has the same structure composed of three dimensions with equal weights, but there are some changes concerning income and education area. In addition to this, the geometric average instead of arithmetic average is used as the method of aggregation.
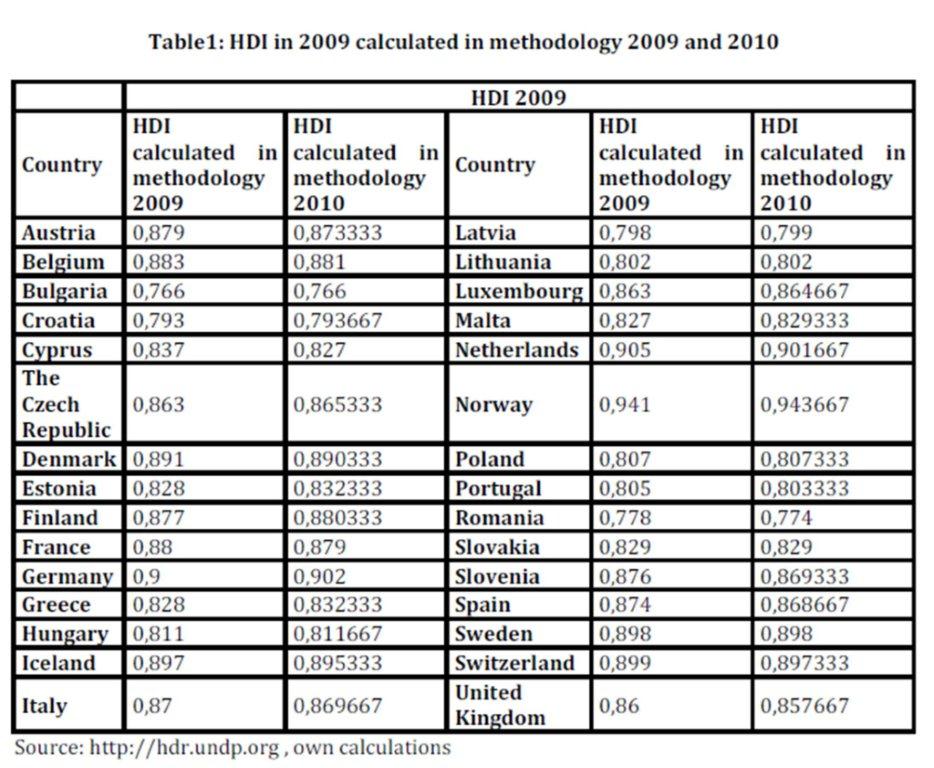
We analyzed how the change in methodology influences the HDI value. When we apply the new methodology to data from 2009 and compare the HDI measured by original method and by the new one, we obtain the following results:
We analyzed 170 countries overall but the table above contains only 30 European countries, which is a sufficient example due to the results of analysis, because there are no significant differences between results obtained by original and current methodology which concerns not only the 30 European countries but all the 170 countries. So, it can be concluded that the changes in methodology did not cause any considerable difficulties in evaluating social welfare in particular countries.
On the contrary, using the HDI as a social wealth measure is still connected with the following problems:
* the HDI does not take into account any freedom considerations
* the HDI is highly focused on national ranking
* the HDI does not associate the development with global issues
As mentioned above, the HDI gives equal weights to the three dimensions – GDP per capita, life expectancy and education. But according to Caplan (2009), it is more complicated than that. In fact, the HDI does not include many other important factors which are connected with social welfare. Wolff (2010) cautions and suggests not taking HDI based on the tree dimensions as a tool for international negotiations, decision making when realizing foreign direct investments, pricing, or the allocation of foreign aid. But still, it can be presumed that HDI has some explanatory power. Therefore, we consider that it could be useful to analyze relations between the HDI and poverty. The hypothesis is that higher HDI value means lower poverty. The construction of the HDI was introduced above and now remains to explain measuring poverty. Eurostat uses an indicator named “People at risk of poverty or social exclusion (AROPE).” The AROPE indicator is defined by Antuofermo and Meglo (2012) as the share of the population in at least one of the following three conditions: at risk of poverty, meaning below the poverty threshold, in a situation of severe material deprivation, living in a household with very low work intensity. As we can see, the construction of the HDI and AROPE is entirely different while each indicator focuses on different aspects of social welfare. But, the main idea of both indicators is the same – to measure social welfare.
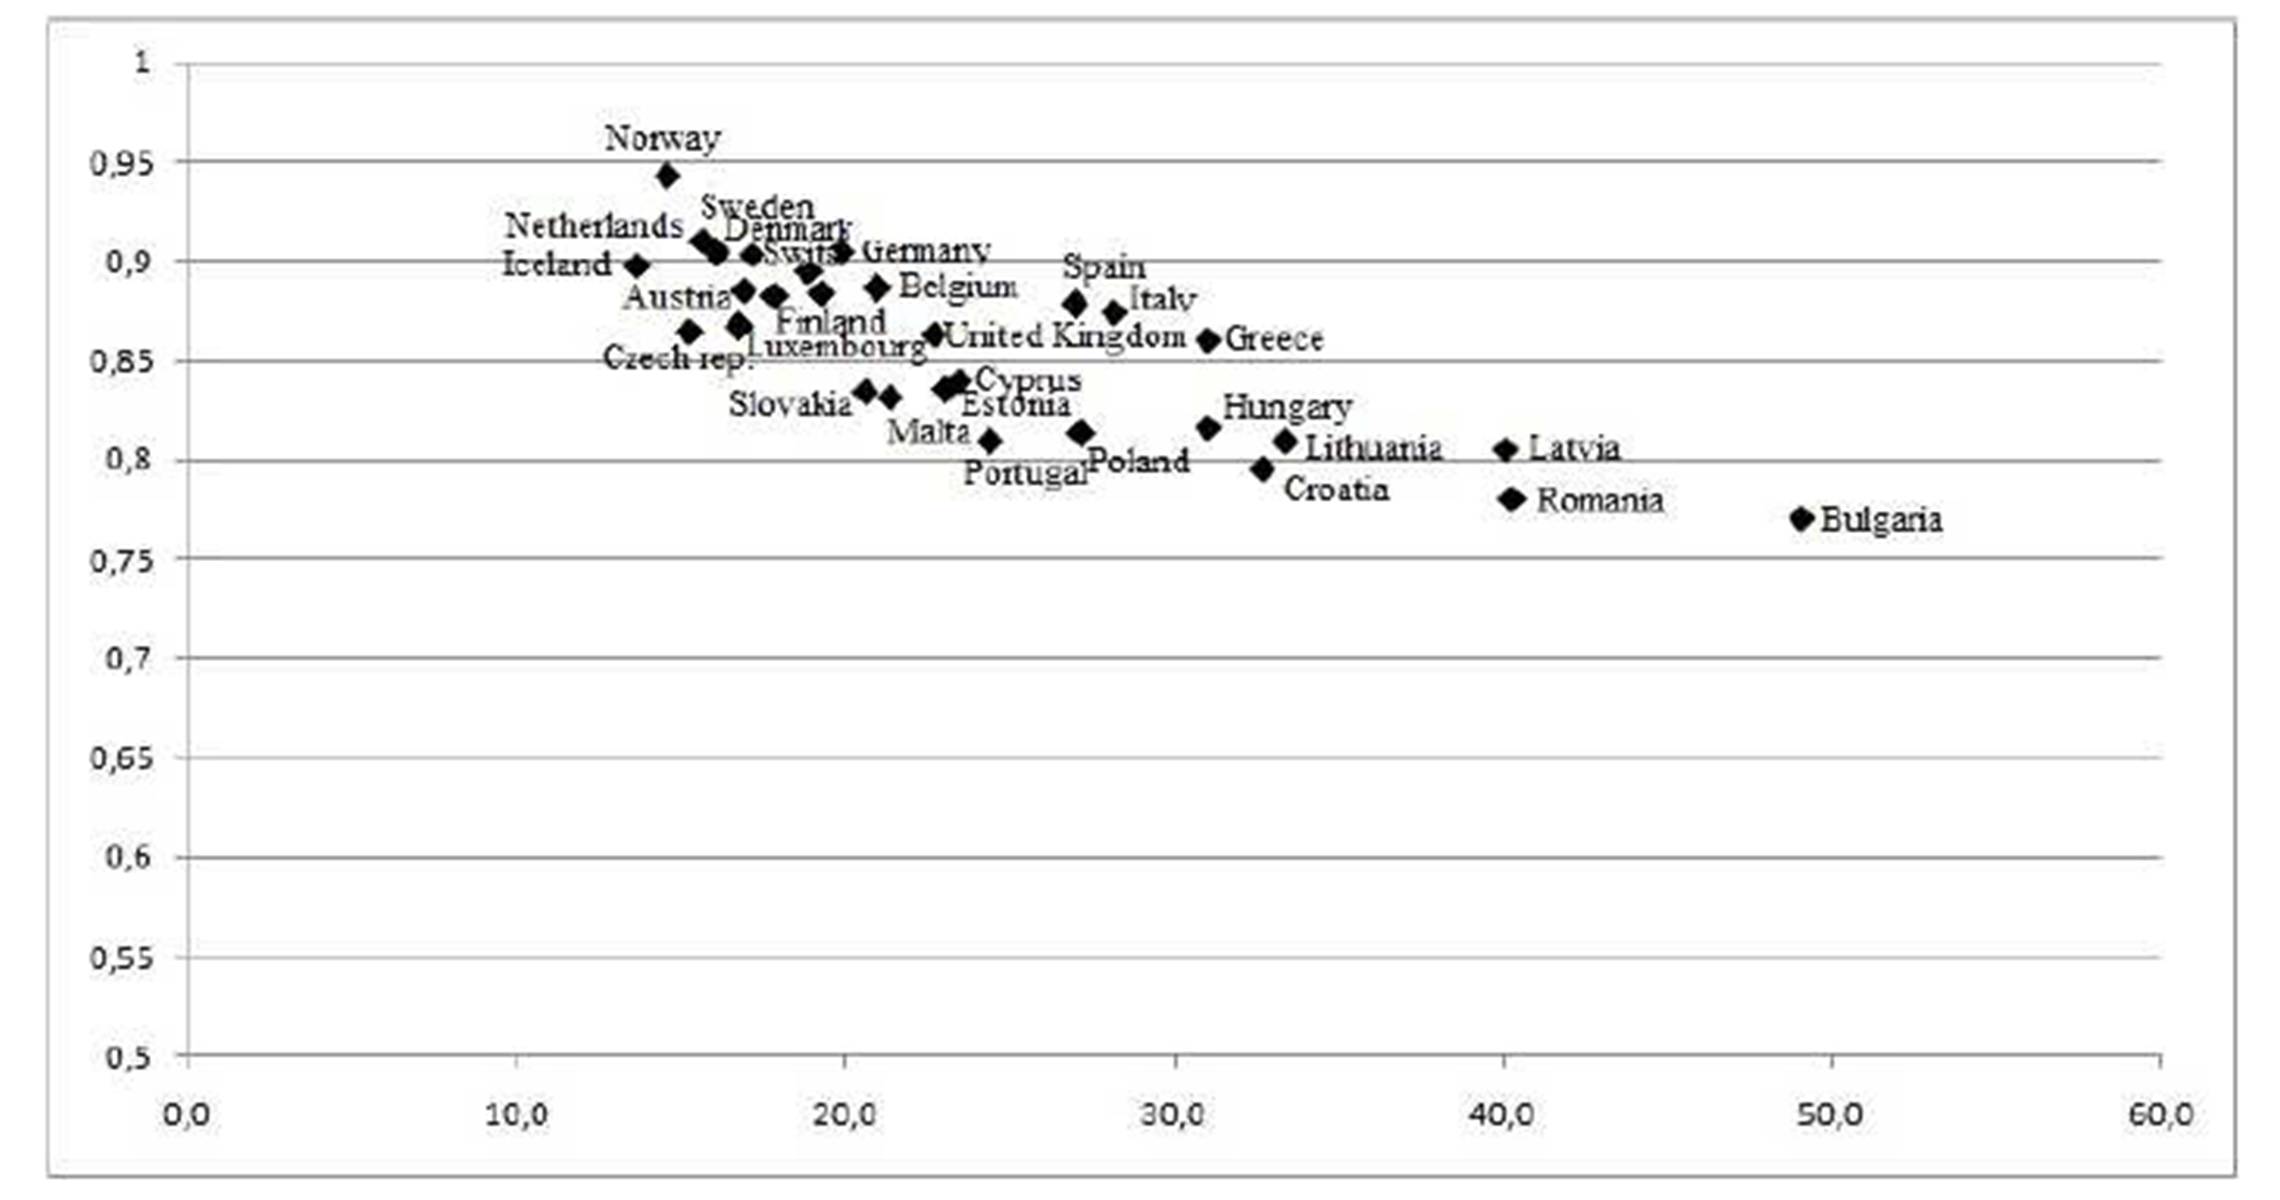
The relation between the HDI and AROPE can be examined by least square method, which is commonly used in situations; we need to find and describe relations between variables. After doing this we obtain the following:
In the graph above, Y axis (vertical) represents HDI value and, X axis (horizontal) represents the value of AROPE. Each point in the graph represents one European county. In the graph, the relationship between the HDI and the AROPE can be clearly seen, which is essential. This can serve us as a confirmation of our hypothesis that higher HDI value means lower poverty, and therefore the HDI seems to be suitable enough for measuring social welfare despite its limitations mentioned above.
The HDI Modification
It would be rather difficult and maybe even impossible to improve the HDI not to focus on national ranking and pay more attention to the development from a global perspective. Sen (1999) states development should be evaluated by the degree of freedom in a country. The logic is simple – where there is no freedom, people have no choice. Without possibility and options it is difficult to develop. Sen (1999) defines freedom as the integration of:
1. political freedom and civil rights;
2. economic freedom;
3. social opportunities;
4. transparency guarantees;
5. protective security.
In order to remove the deficiency concerning the fact that the HDI does not include any freedom considerations, it can be slightly modified. The index of economic freedom constructed by The Wall Street Journal and The Heritage Foundation can be used. The Index of Economic Freedom is constructed through the analysis of 10 specific components which are grouped into four key pillars:
-Rule of law
-Limited government
-Regulatory efficiency
-Open markets
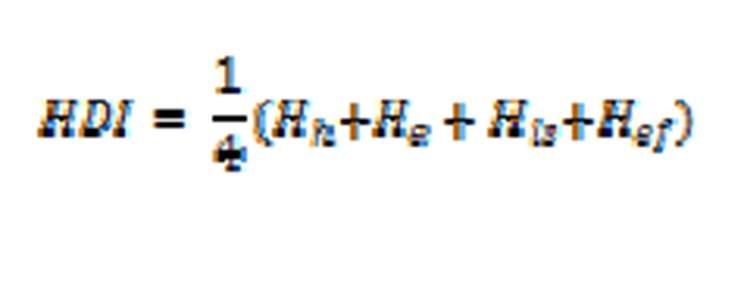
In order to include economic freedom to the human development index, we modify the HDI formula as follows:
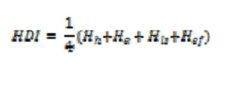
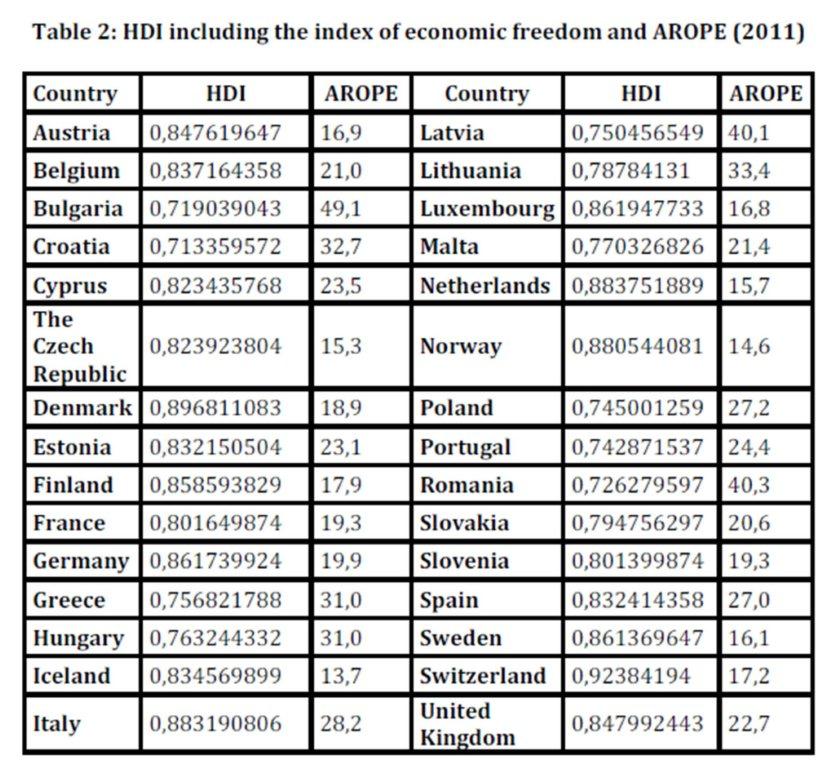
where Hef denotes the sub index of economic freedom. The values of economic freedom index must be normalized, as well as other H indexes included in the HDI. Therefore, it is necessary to use given upper and lower bounds. The index of economic freedom is available since 1995 for 185 countries. Based on these data, the upper value is set to observe maxima over the time series between 1995 and 2011 and the lower bound is set to observe minima over the same time period.
{efmin; efmax}={42,9; 82,6}
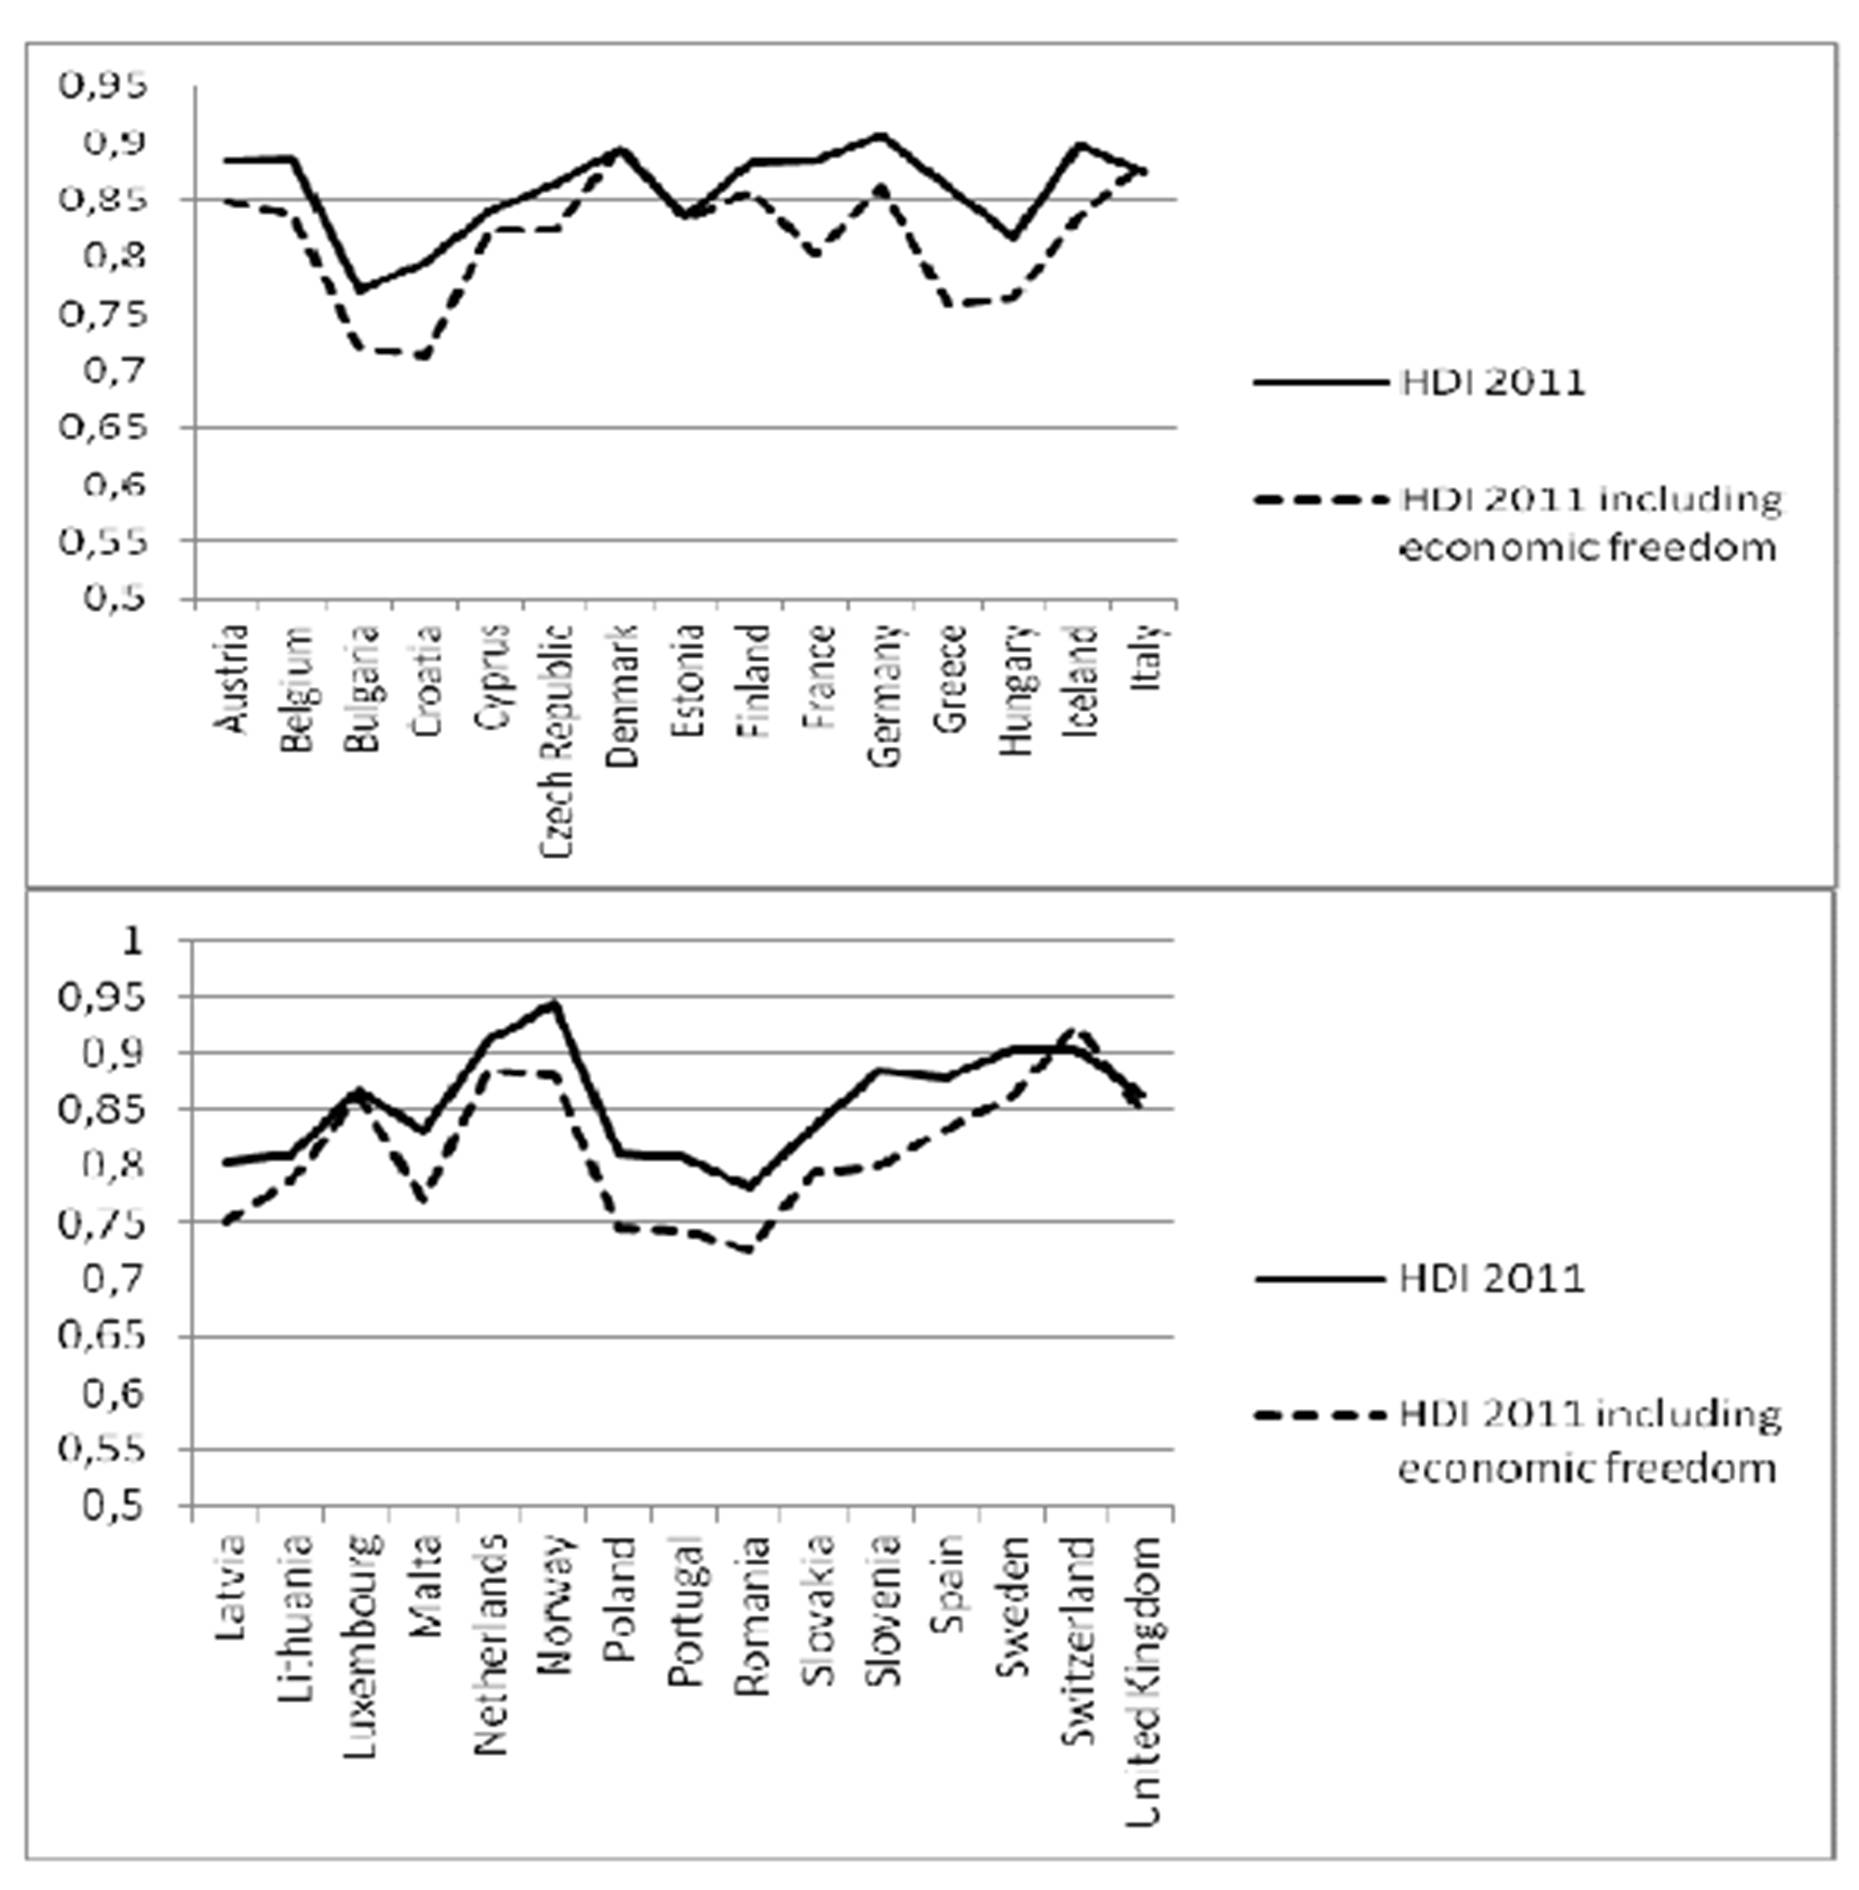
This procedure leads to the following results:
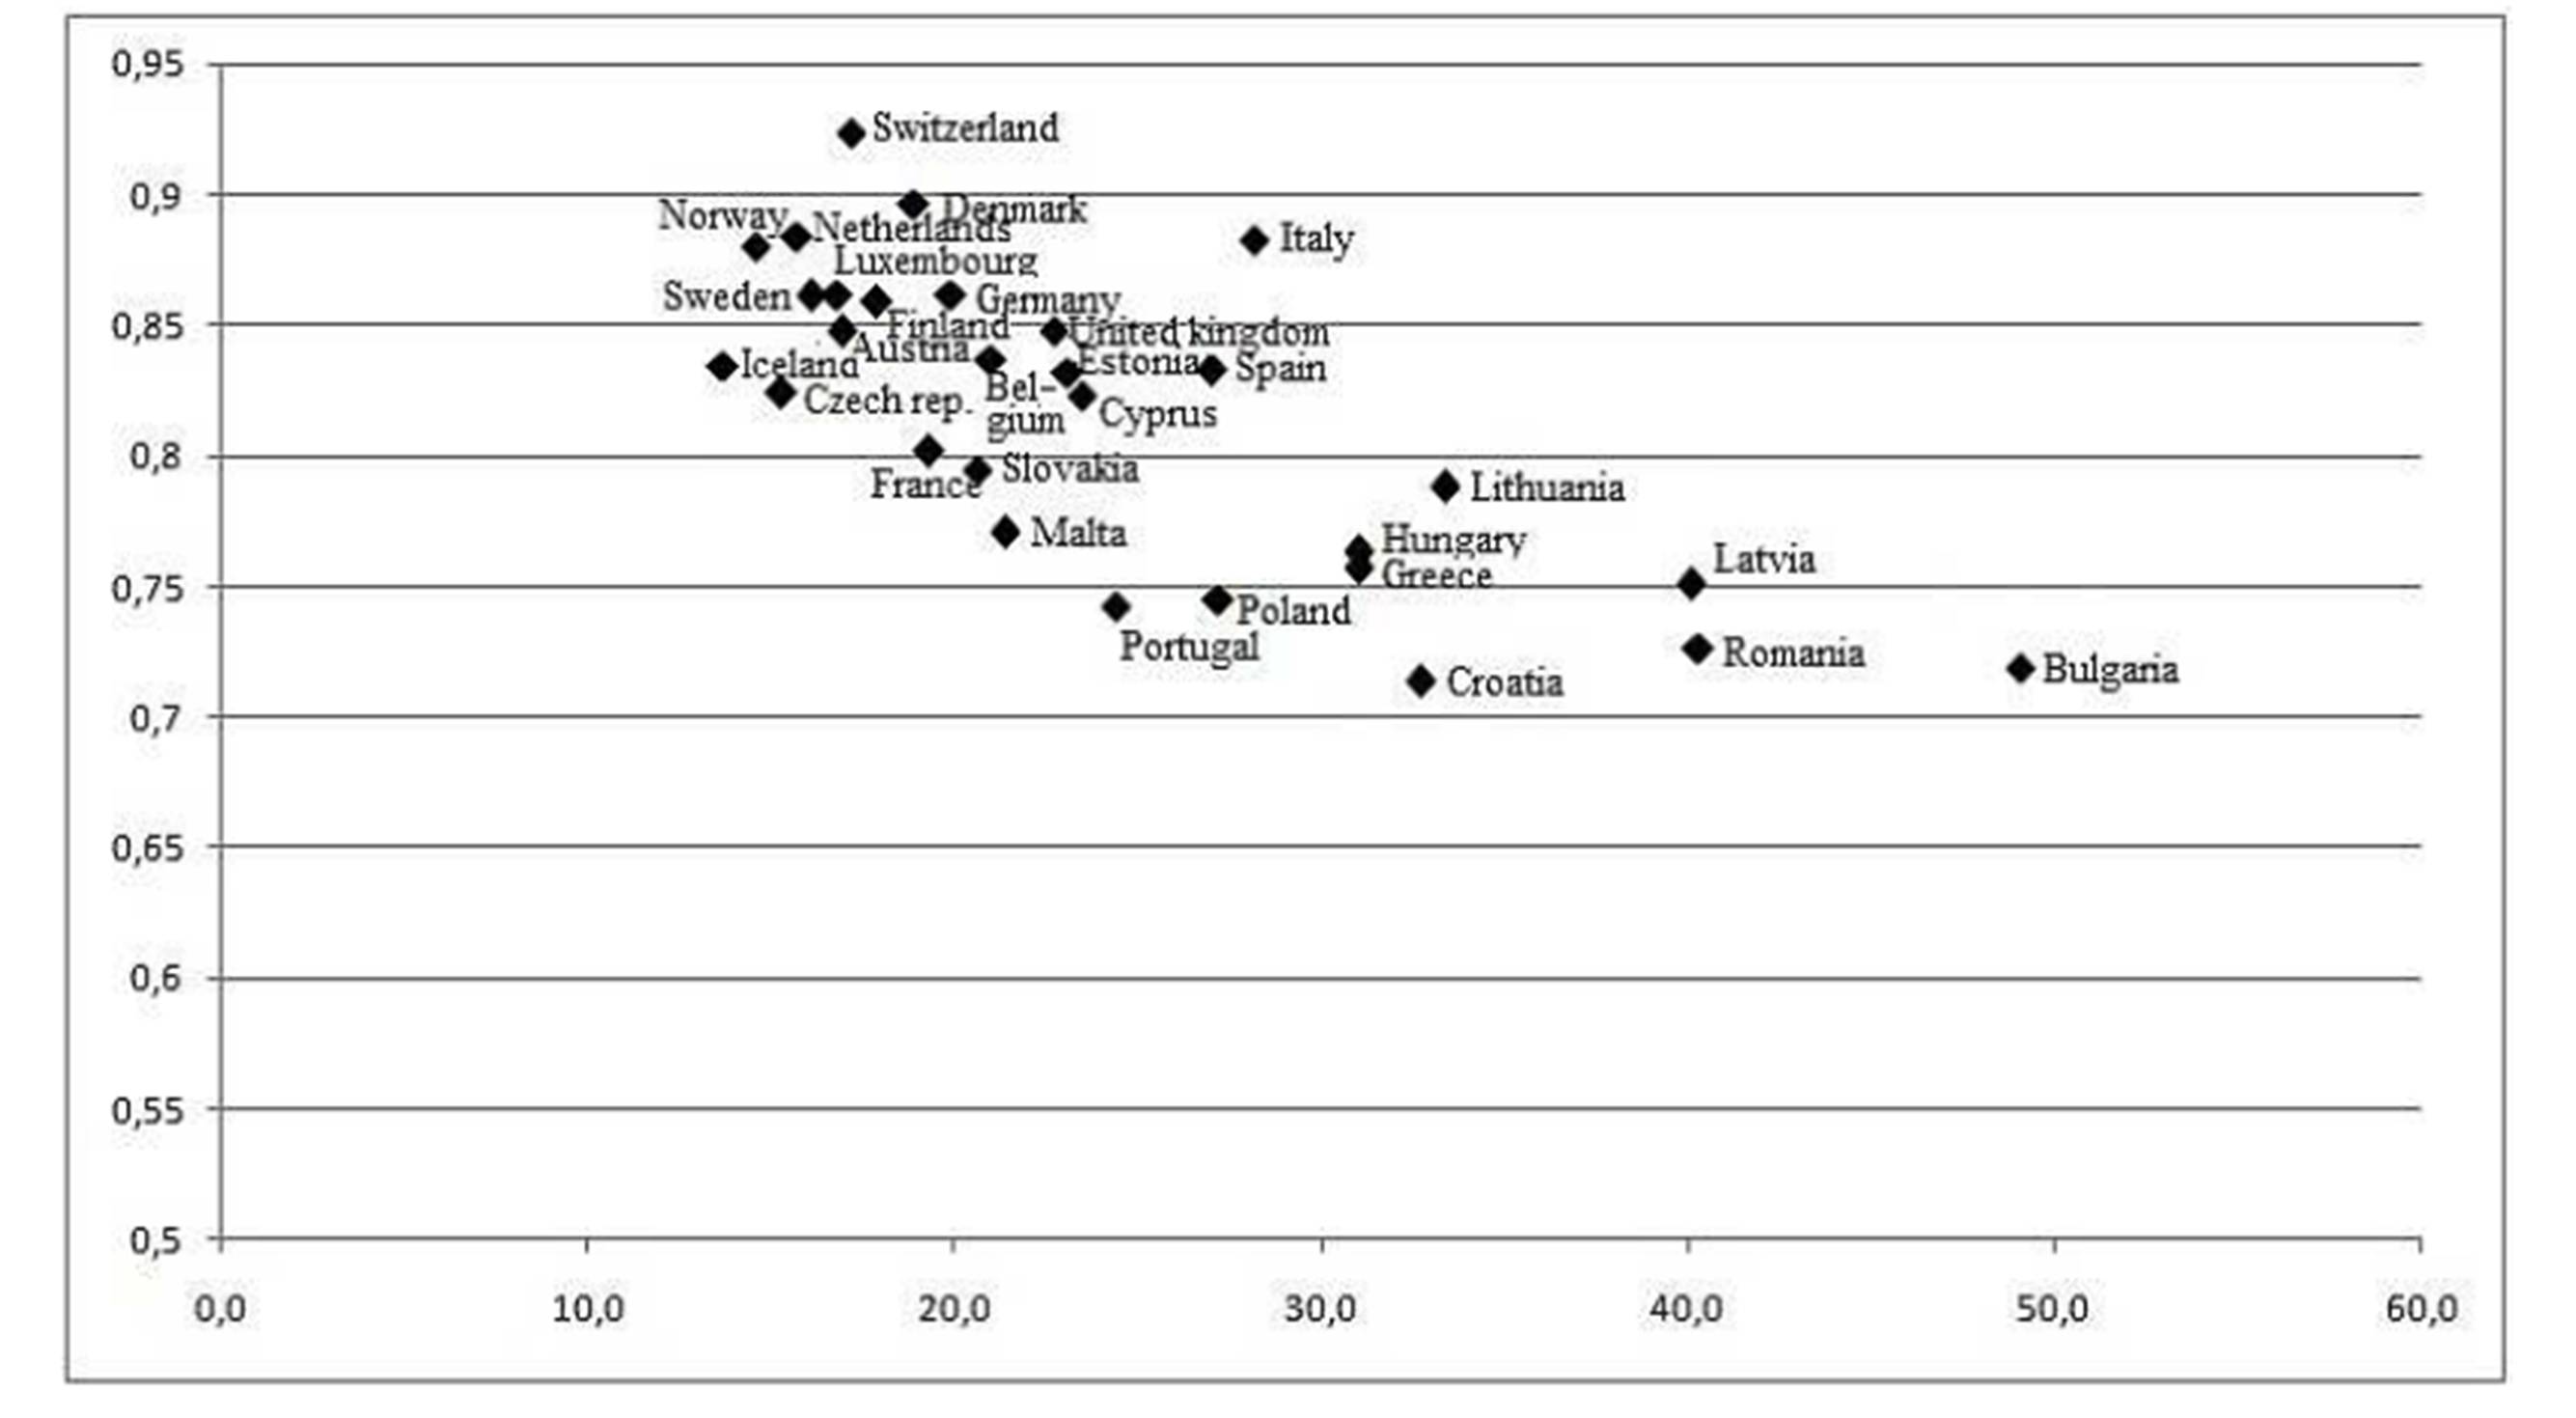
Figure3: HDI including the index of economic freedom and AROPE in 2011
In the graph above, Y axis represents the modified HDI including the index of economic freedom, and X axis represents the value of AROPE. Each point in the graph represents one European country. Still, we can observe the negative relationship between variables. Therefore, we can conclude that trying to add other indicators to the HDI led us to two main findings: using additional indicators requires relevant and actual database, and the obtained results can be surprising. Adding the index of economic freedom leads to the deterioration of assessment of human development in all of the European countries except Switzerland. But, does this phenomenon concern developed countries only? Does it mean that in the least developed country would the HDI value including economic freedom be higher? These are questions for possible further research. Other possible further research could be focused on examining other kinds of freedom such as political freedom, business freedom, etc. It is obvious that e.g. the phenomenon of internet which overran all the world changed our life and human freedom as well.
Conclusion
Wealth and poverty have been the main objects of interest of many economists. Still, this essential area is examined by research. It is due to the fact that poverty is unexceptionably one of the most important problems which mankind suffers from. The indicator of measuring poverty or wealth is a useful tool of how to analyze the situation. The economic theory contains such tools but using these tools is connected with various problems. Therefore, we should search for ways of improving these tools in order to make our measurements more accurate and our actions more effective. Social welfare is a concept which was developed by three different approaches – Utilitarism, Neoclassical Economy and New Welfare Economics. These theoretical constructions cannot be used in practical measuring due to the fact that data required are never possible to be collected. This is a result of methodological approach itself. That is why we use macroeconomic aggregates and other indicators in spite of the fact that they have their disadvantages. These disadvantages are difficult to reduce but on the other hand they are a big challenge for a further research. In the article, we confirmed that higher HDI value means lower poverty, and therefore the HDI seems to be suitable enough for measuring social welfare. In order to reduce the disadvantages of the HDI, we modified this indicator by adding the aspect of economic freedom. This led to negligible deterioration of HDI values in almost all European countries, but the relation between the modified HDI and poverty was kept. Actually, this result is not much surprising but indicates that the aspect of economic freedom should not be omitted while it negatively influences social welfare. But in fact, economic freedom is only part of human freedom. Generally, freedom is a situation in which there are no obstacles which could intercept to make any decision. From this point of view, freedom can be categorized and we can speak about several various freedoms – economic freedom, political freedom, business freedom, intellectual and moral freedom, etc. However, it is difficult to measure all the freedoms.
References
1. Antuofermo, A. and Meglo, E., (2012). ‘Population and social conditions’.Statistics in focus 9/2012. [online], [retrieved February 7, 2013], http://epp.eurostat.ec.europa.eu/cache/ITY_OFFPUB/KS-SF-12-009/EN/KS-SF-12-009-EN.PDF
2. Bentham, J., (2000)‘An Introduction to the Principles of Morals and Legislation’. Batoche Books.[Online], [Retrieved Jauary 28, 2013], http://socserv2.socsci.mcmaster.ca/econ/ugcm/3ll3/bentham/morals.pdf
3. Bostic, R. et al. (2009), ‘Housing wealth, financial wealth, and consumption: New evidence from micro data’, Regional Science and Urban Economics, 39 (1), 79-89.
Publisher – Google Scholar
4. Caplan, B., (2009). ‘Against the Human Development Index’. [Online], [Retrieved February 4, 2013], http://econlog.econlib.org/archives/2009/05/against_the_hum.html
5. Clarke, M. and Islam S. (2003), ‘Measuring social welfare: application of social choice theory’,Journal of Socio-Economics, 32 (1), 1-15.
Publisher – Google Scholar
6. Cypher, J.M. and Dietz, J. L. (2004) The Process of Economic Development, Routledge, London.Index of economic freedom [Online], [Retrieved February 11, 2013], http://www.heritage.org/index/explore
7. Kolm, S.CH. (1994). ‘Rational normative economics vs social welfare and ‘social choice,’European Economic Review, 38 (3-4), 721-730.
Publisher – Google Scholar
8. Sen, A. (1999) Development as freedom, Anchor books, New York.
Google Scholar
9. Sinha, P.U. (2007) Economics of Social Sector and Environment. Kumar Mittal, New Delhi.
10. Stiglitz et al (2009) Report by the Commission on the Measurement of Economic Performance and Social Progress. [Online], [Retrieved October 1, 2013], http://www.stiglitz-sen-fitoussi.fr/documents/rapport_anglais.pdf
Google Scholar
11.UNDP–Humandevelopment. [Online], [Retrieved February 11, 2013], http://hdrstats.undp.org/en/indicators/103106.html
12.Vondráček, O. (2007). Ekonomie blahobytu. [Online]. [Retrieved January 28, 2013], http://nf.vse.cz/download/veda/workshops/blahobyty.pdf
13. Wolff, D. (2010). Classification, detection and consequences of data error: evidence from the human development index. [Online], [Retrieved February 4, 2013], http://www.nber.org/papers/w16572.pdf?new_window=1