Introduction
Referring to issues related to international trade in agro-food products requires a realistic anchorage in the causes of these trade relations. This statement was also mentioned by Kuppusamy (2012), who said that „Exporting is the most common and widely used mode to enter into business since the export performance is crucial to identify the performance level of the organizations”. In this regard, Moses et al. (2013) stated that “Trade can be a powerful engine for economic growth, poverty reduction, and development”. In our paper, for an analysis on trade of flowers, it may takes into consideration more elements. However, it should not be forgotten that, as mention Grossman (1989), „Trade has both intra-industry and inter-industry components and the different incentives that face agents in different countries for investment and savings decisions give rise to inter-temporal trade” At its turn, Winters (2004) has stressed “… the importance of other factors in achieving growth is, such as other policies, investment and institutions, of which many of these respond positively to trade liberalisation”. Speaking about the agriculture, Chipman (1965) argued that “…differences in resource endowments between countries and regions result in each country having unique advantages for producing a particular set of products. The agricultural industry and agricultural products have many characteristics that distinguish them from other industries”. The flower market is an area with particular features; the flowers are not an ordinary product, are not indispensable for the daily life but these are, most likely, very influenced by the income level of the population. Still, Love (2010) remembered that “Trade liberalization affects growth in a number of ways. It gives producers access to bigger markets and allows them to increase the scale of their production” and also “trade liberalization and good policy require a number of other conditions to be met to have the greatest impact, such as good infrastructures and a skilled labor force”. A special mention must be made here to the European Commission survey “Trade as a driver of prosperity” (2010), in which it said that there are three benefits from the opening of trade, namely: economic growth, consumer benefits and employment”.
In his paper, Viorica (2012) aims to identify significant influence factors on bilateral trade flows between Romania and its trade partner countries, in order to estimate the degree of the external trade efficiency, identifying the most effective and most ineffective foreign trade partnership for Romania”. Moreover, Selmi (2012), stated that “An examination of international trade theories and new growth theories reveal how the economic development, the successful integration and growth are more closely related to the mastery of technology and the ability to adaptation from one country to the technological innovations”. Another special approach was presented by Muhammad A., D’Souza A. and Amponsah W. (2013). In their paper, they have examined “the implications of the violence and instability following the 2007 Kenyan elections and how it affected cut flowers trade between Kenya and the EU. Results show that even a short period of violence can have an effect on trade since instability in an exporting country causes importers to source from other countries perceived as less risky”.
With a different regard, Riisgaard L. (2009) “examines the opportunities and challenges that private social standards pose for labor organizations. It explores different labor responses to private social standards in East African cut flower industries. The analysis incorporates the concept of labor agency in global value chain analysis and reveals how retailer-driven chains offer more room for labor organizations to exercise their agency than the traditional cut flower value chains”. On the other hand, regarding actors who might be also interested in a study on trade in flowers there are the operators of the online environment. Online flower shops in Romania have a significant increase and in fact, they play an important role in the segment flowers for bouquets and decorations. At the same time, we can mention here the tradition of Romania to give flowers as a gift for different events. Studies relating to flowers trade are not numerous, but the method of calculation and analysis can be the same as for other sectors of commerce.
Materials and Methods
The data analysed in this paper was collected from the Ministry of Agriculture and Rural Development and from the National Institute for Statistics, Romania, and have been statistically processed and interpreted. There were also some data from the Eurostat database. The study proposes an integrated analysis on the data stretched out over a period of 12 years, from 2002 to 2013. Some data for the last two years were not available, especially data classified on countries or by type of flower parts; thus, when possible, these data were forecasted, based on a linear simulation model. The study has been also focused on the dynamics of the trade flows and the seasonality in the sector of trade of flowers.
The type of traded flower products is published and is classified according to the Commission Regulation (EC) No 1214/2007 into four categories: (1) Bulbs, tubers, tuberous roots, corms, crowns and rhizomes (Hyacinths, Narcissi, Tulips and other), (2) Other live plants cuttings and slips; mushroom spawn (unrooted cutting and slips vines, trees and roses grafted or not, mushroom spawn, forest trees and other), (3) Cut flowers and flower buds of a kind suitable for bouquets (Roses, Carnations, Orchids, Gladioli and other) and (4) Foliage, branches and other parts of plants, without flowers or flower buds (Mosses and lichens, fresh Christmas trees, conifer branches and other). Concerning the first category, this covers only live trees and goods of a kind commonly supplied by nursery gardeners or florists for planting or for ornamental use. The third and the fourth categories include flowers and plants for bouquets, floral baskets, wreaths and similar articles.
Results and Discussions
In the first part of this section, it was presented an overview on the Romania’s trade with flowers and flowers products in the European area. The table below resumes the dynamics of the volume of E.U. (European Union) trade on fixe basis, 2002=100%. Regarding exports, the trends has been increased till 2006, after the volume decreased constantly arriving at 44.6% from the 2002 volume. Imports of these products have been on the growing trend, reaching 727% compared to the basis year 2002. This pointed out that after 2007, the year of the Romania’s accession to the E.U., the flowers exports have been affected. Meanwhile, it seems that Romania has become an important sell point for these products.
Table 1: Dynamics of the volume of EU trade with Flowers and flower parts, on fixe basis (2002=100%), 2002-2013
Source: Ministry of agriculture and National Institute of Statistics, Bucharest, 2013
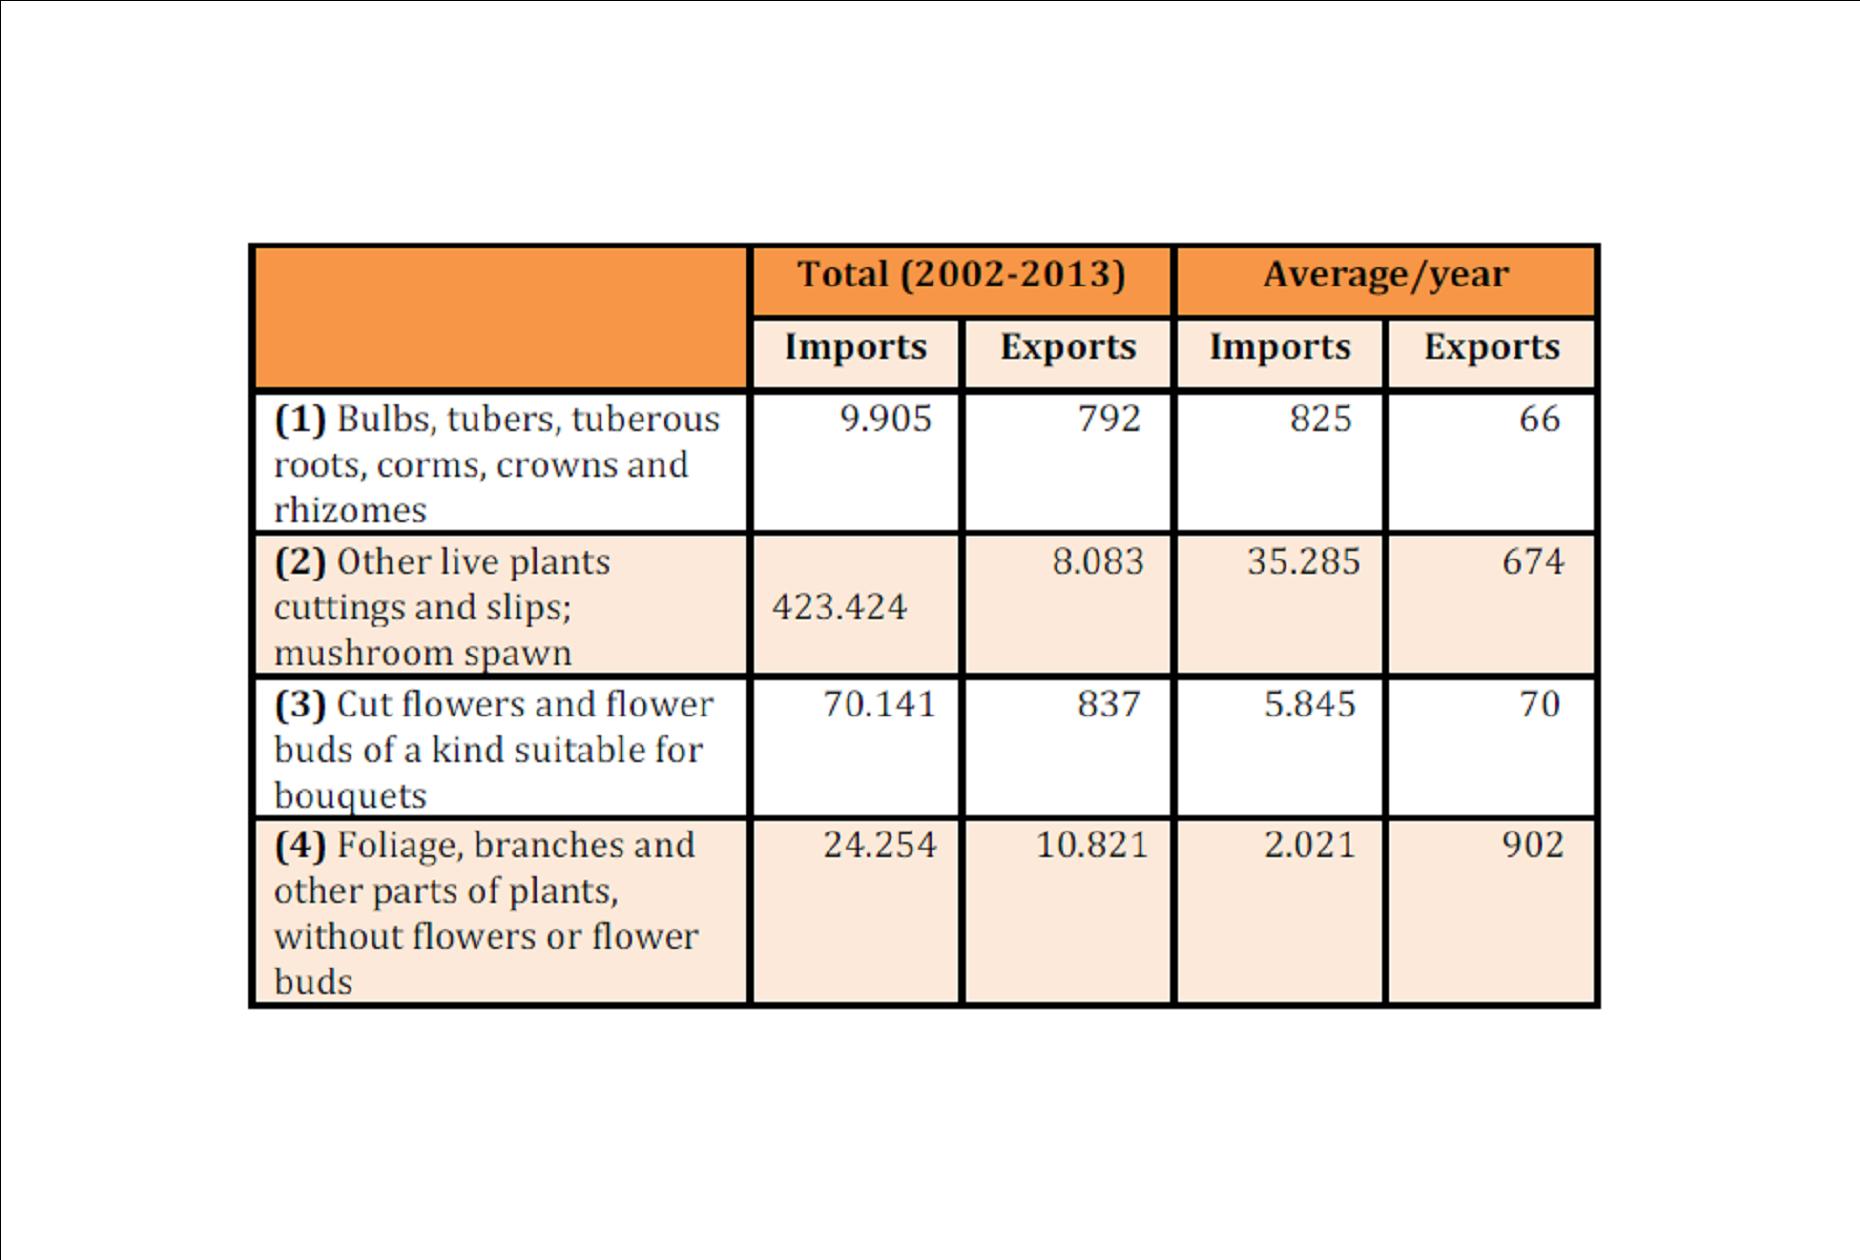
Taking into consideration the volume of the four categories of flower parts, we have presented in the table below (Table 2) the dynamics of exports and the imports during the 2002-2013 periods. The volume of the exports with flower parts, on the 12 years period, has been registered a decreasing trend with an average of 2.000 tons/year. The volume of imports, with an average of 38.000 tons/year, increased constantly, especially after 2007.
Table 2: Volume of imports and exports and the averages, 2002-2013, tons

From the table above, the second category imported, (2) other live plants, seems to be the most interested on the Romanian market. It is followed by the (3) Cut flowers and flower buds. Concerning the exports, the fourth category (4) Foliage, branches and other parts of plants are placed on top, followed by the (2) category.
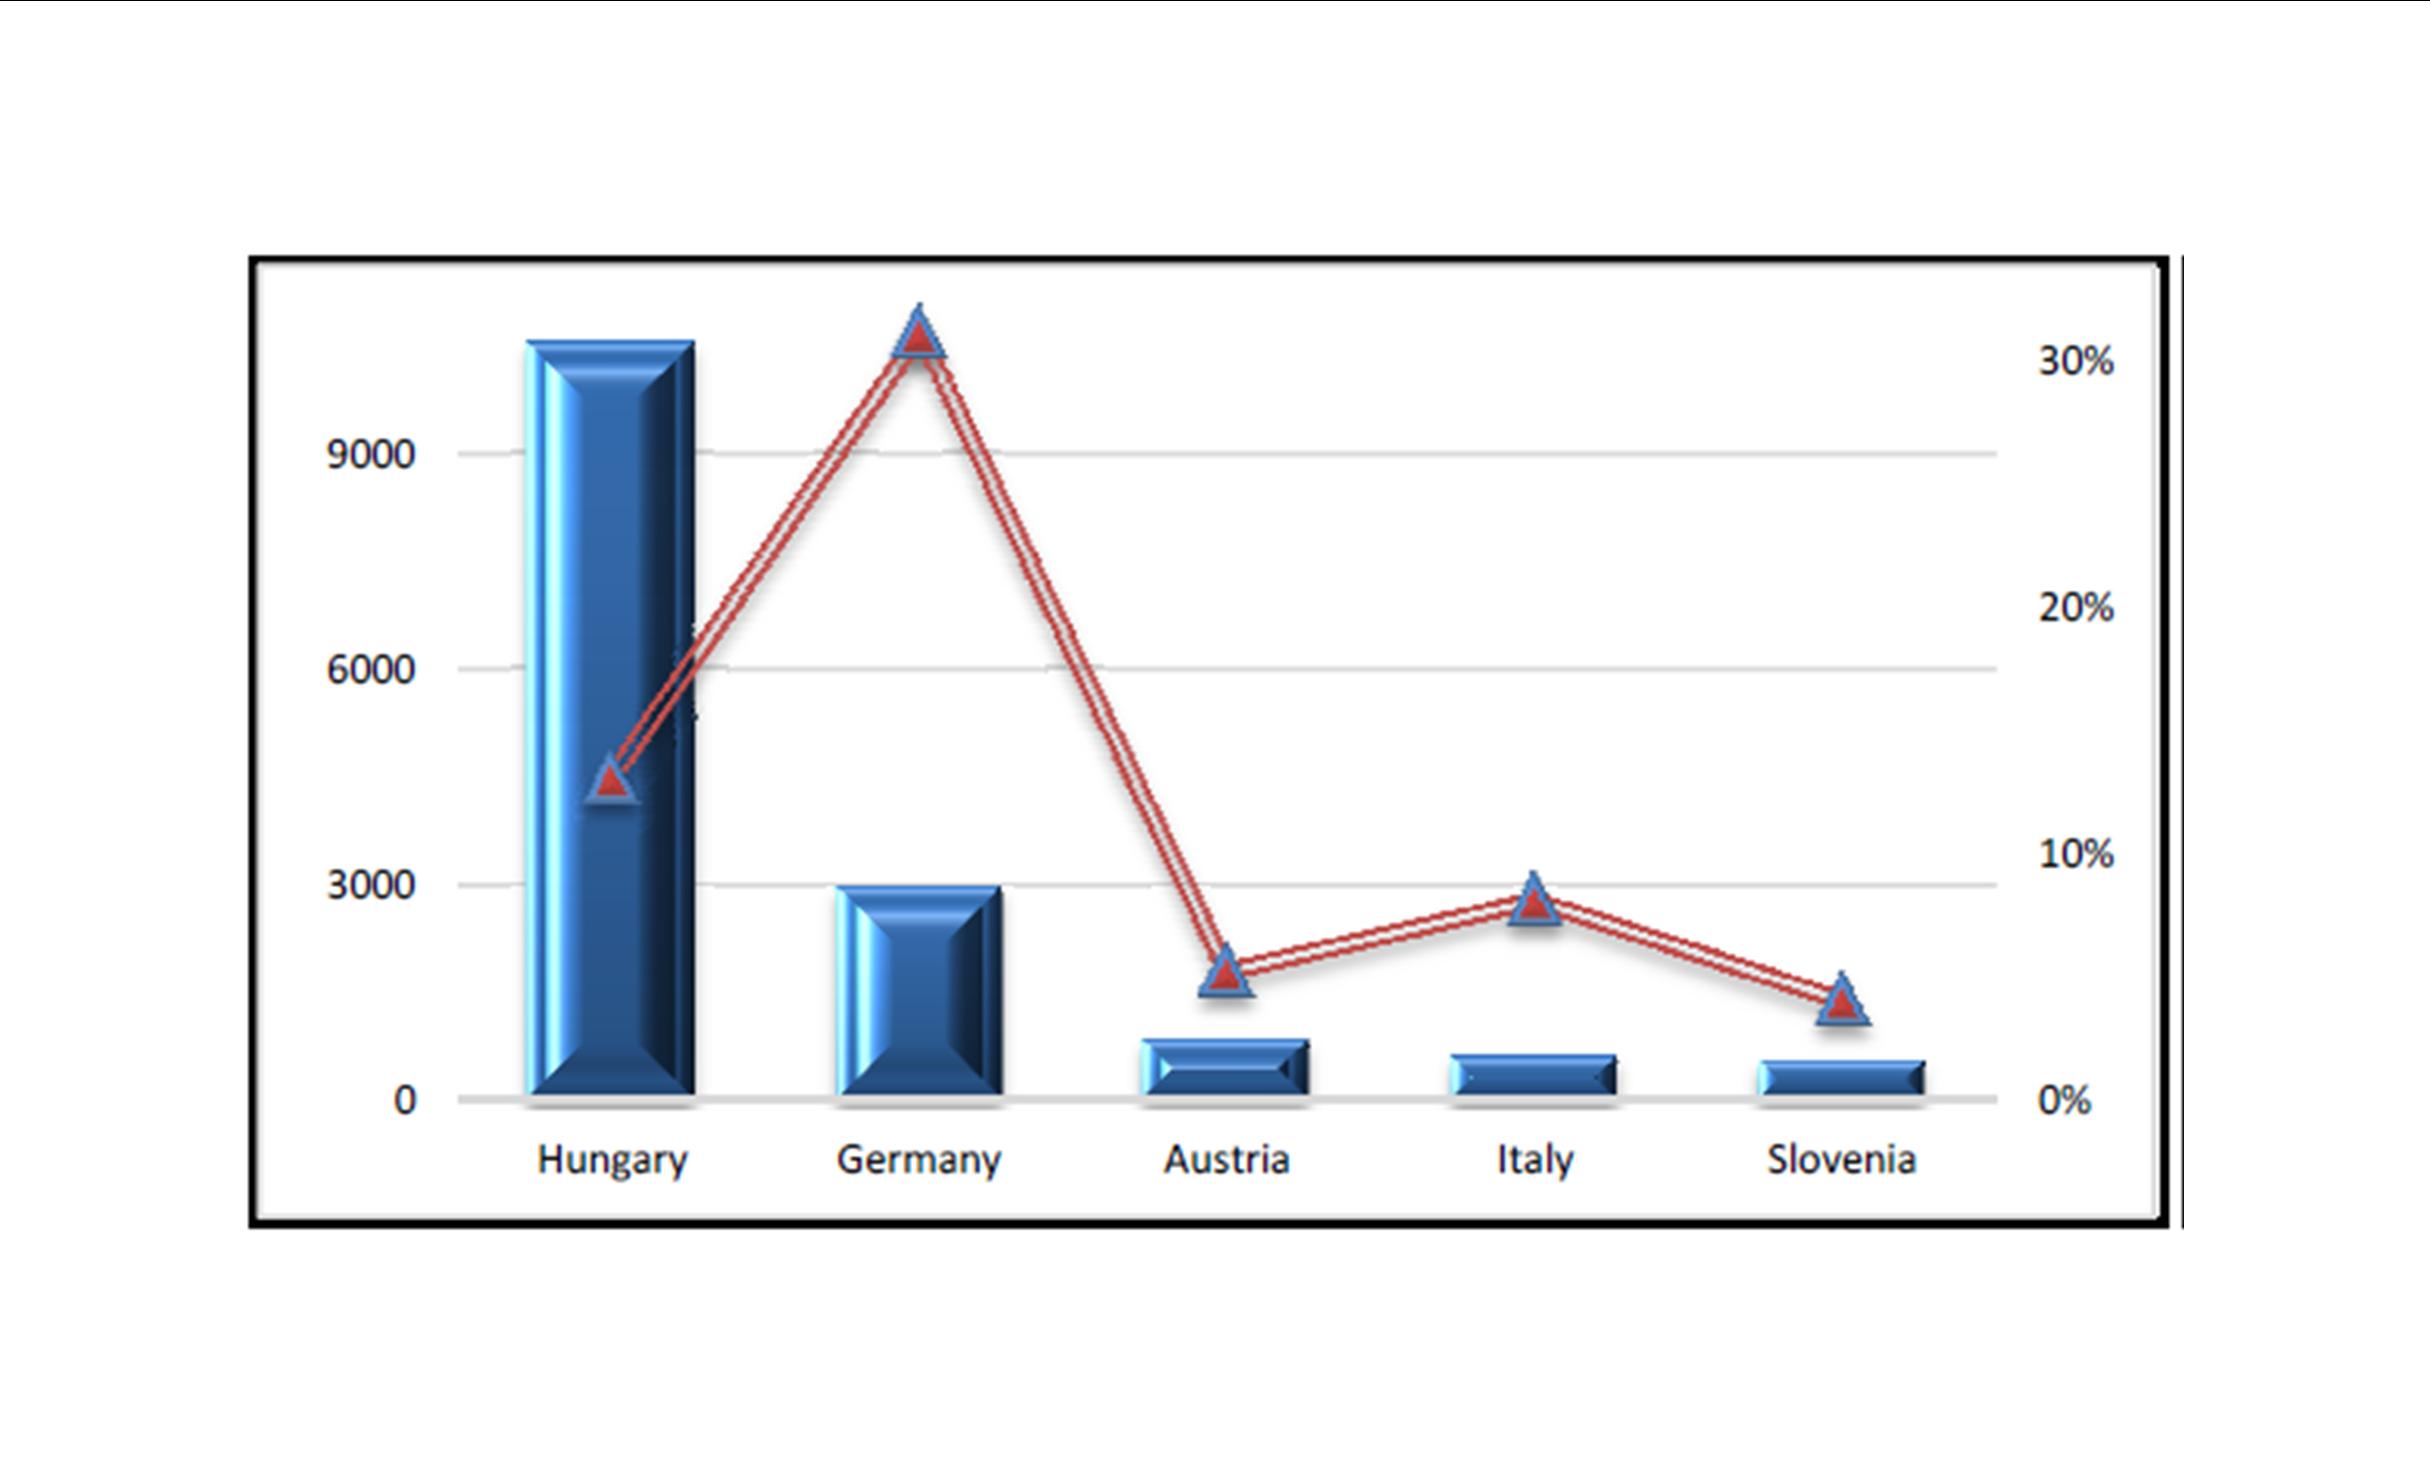
In the next part, we have focused on the commercial partners, the supplier countries and the destination countries for these traded products. In that sense, concerning the exports, we have mentioned here that, among the first 5 countries, Hungary had commercial relations with our country for 10 years with the highest level of the total quantities in 2005 and the lowest in 2010. The next three countries, Germany, Austria and Italy, had also a ten years trade with Romania. Germany and Austria reached the highest level before 2007, the year of the European accession, while the flowers trade with Italy became to growth after this year. The total volume of exports of flowers and flower products from Romania stood around 20500 tons and was worth for US$ 20000 thou. As share of the total value for the five countries mentioned above, the ranking has changed. The exports were less valuable for Hungary, while the most valuable exports went to Germany. In the figure below it was resumed the data computation.
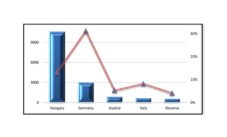
Figure 1: The total volume of Exports; Flowers and flower products, Romania, 2002-2011
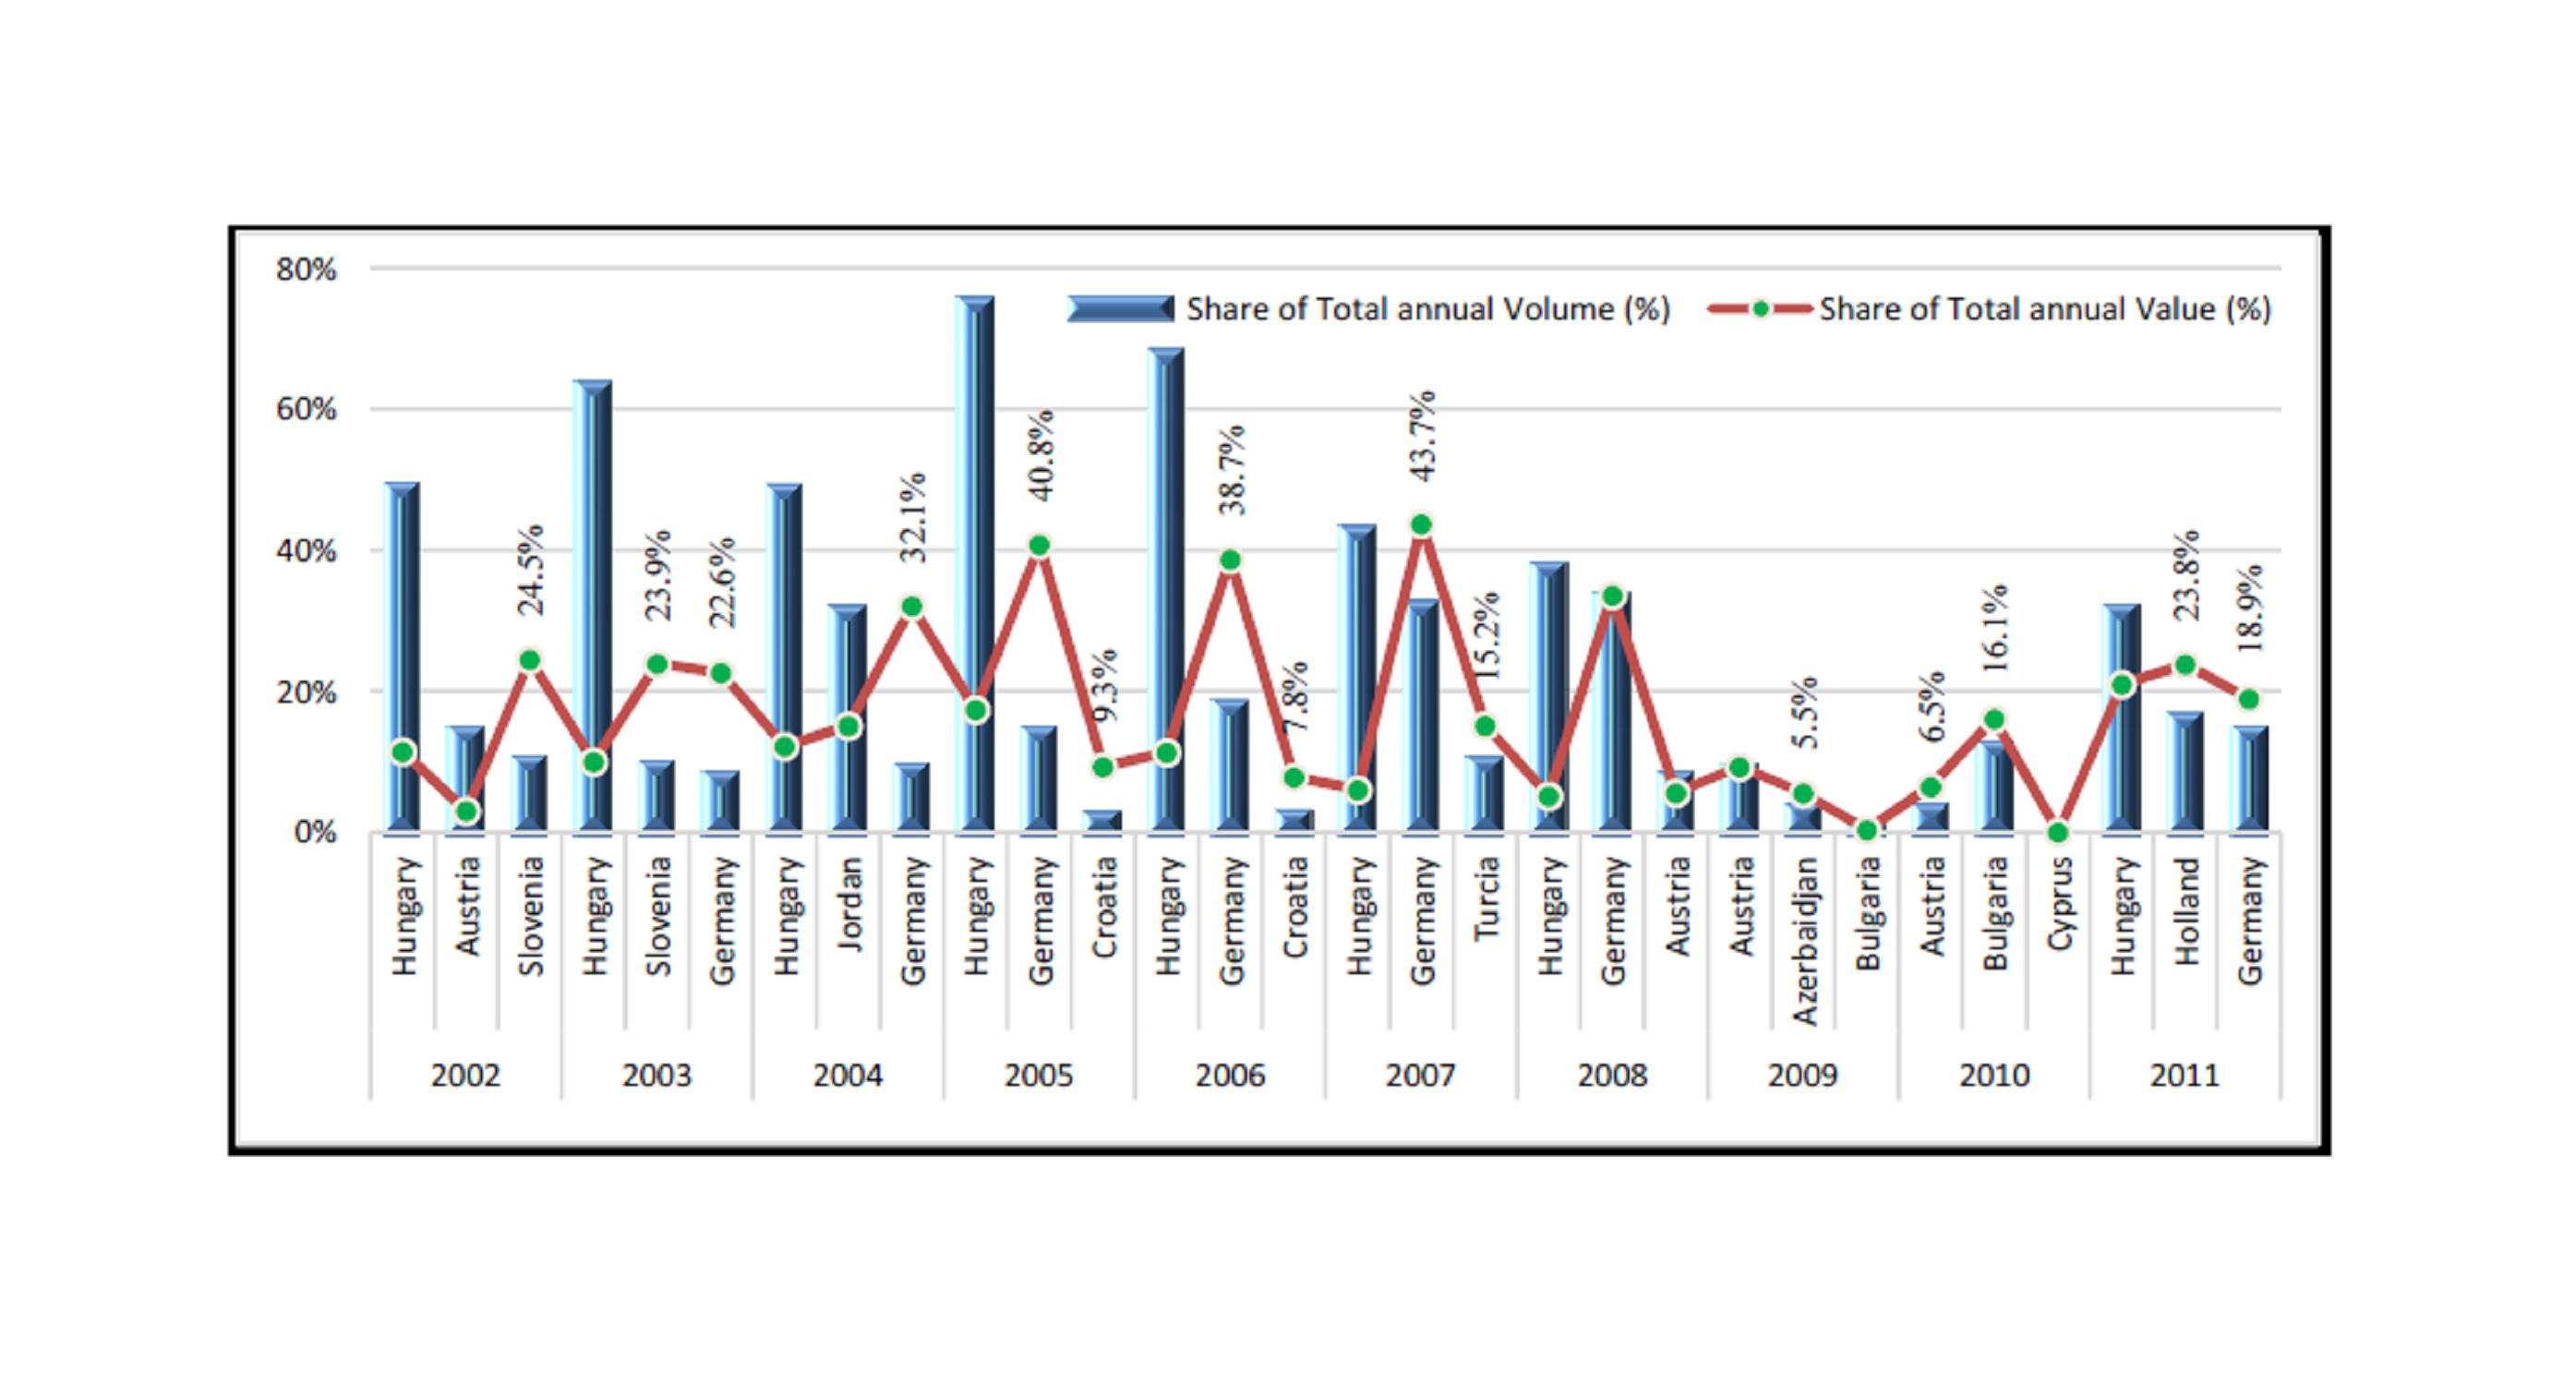
Further, in terms of yearly exports during the period 2002-2011, the chart below shows the first three countries, as percentage of the yearly volume. We have mentioned here the number of countries in which Romania exported the flower products; there were between 11 countries in 2007 and 18 countries in 2002.
Figure 2: The shares in the Total annual exports, Romania
On the chart above, there have been marked the countries where the exports were most valuable. In the first two years of the reference period, among the three countries represented there, Romania exported flower products with the greatest value in Slovenia. The following years until 2008, Germany was the country in which Romania exported flower products with the highest value. The exports for the next three years do not confirm a constant trend, but in 2011, Holland was on the first place (in term of volume, second in term of value) and Germany on the second place and confirmed the place among the countries where Romania sent valuable flowers products. Meanwhile, referring to the greatest volume for the exports, along the 10 years analysed period, Hungary was the country where Romania sent, for eight years, the biggest quantities of flowers and flower products.
Further, in order to have a picture on what it means the flower products, we have presented in the following figure the exports by flower products. According to the Commission Regulation (EC) No 1214/2007, amending Annex I to Council Regulation (EEC) No 2658/87 on the tariff and statistical nomenclature and on the Common Customs Tariff on the traded flower products there are, as we have mentioned at the beginning of this paper, four categories. In the next figure we have pointed out, according to the classification mentioned above, the ranking of the first three years, among the 12 years analysed, in which each flower products was the most exported during the 2002-2013 period (Fig. 3). Thus, the annual volume of exports for all the four types of flower parts, have been decreased. Still, the highest level of the exported volume was registered for the categories (4) and (2).
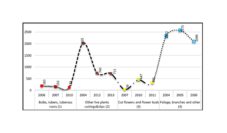
Figure 3: Annual volume of Exports by the 4 categories, Flowers and Flower parts (tons), Romania, 2011-2013. Source: M.A.R.D. data, Romania and own computation
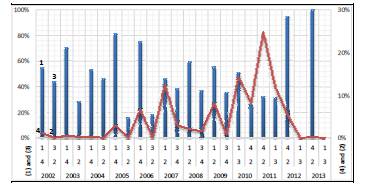
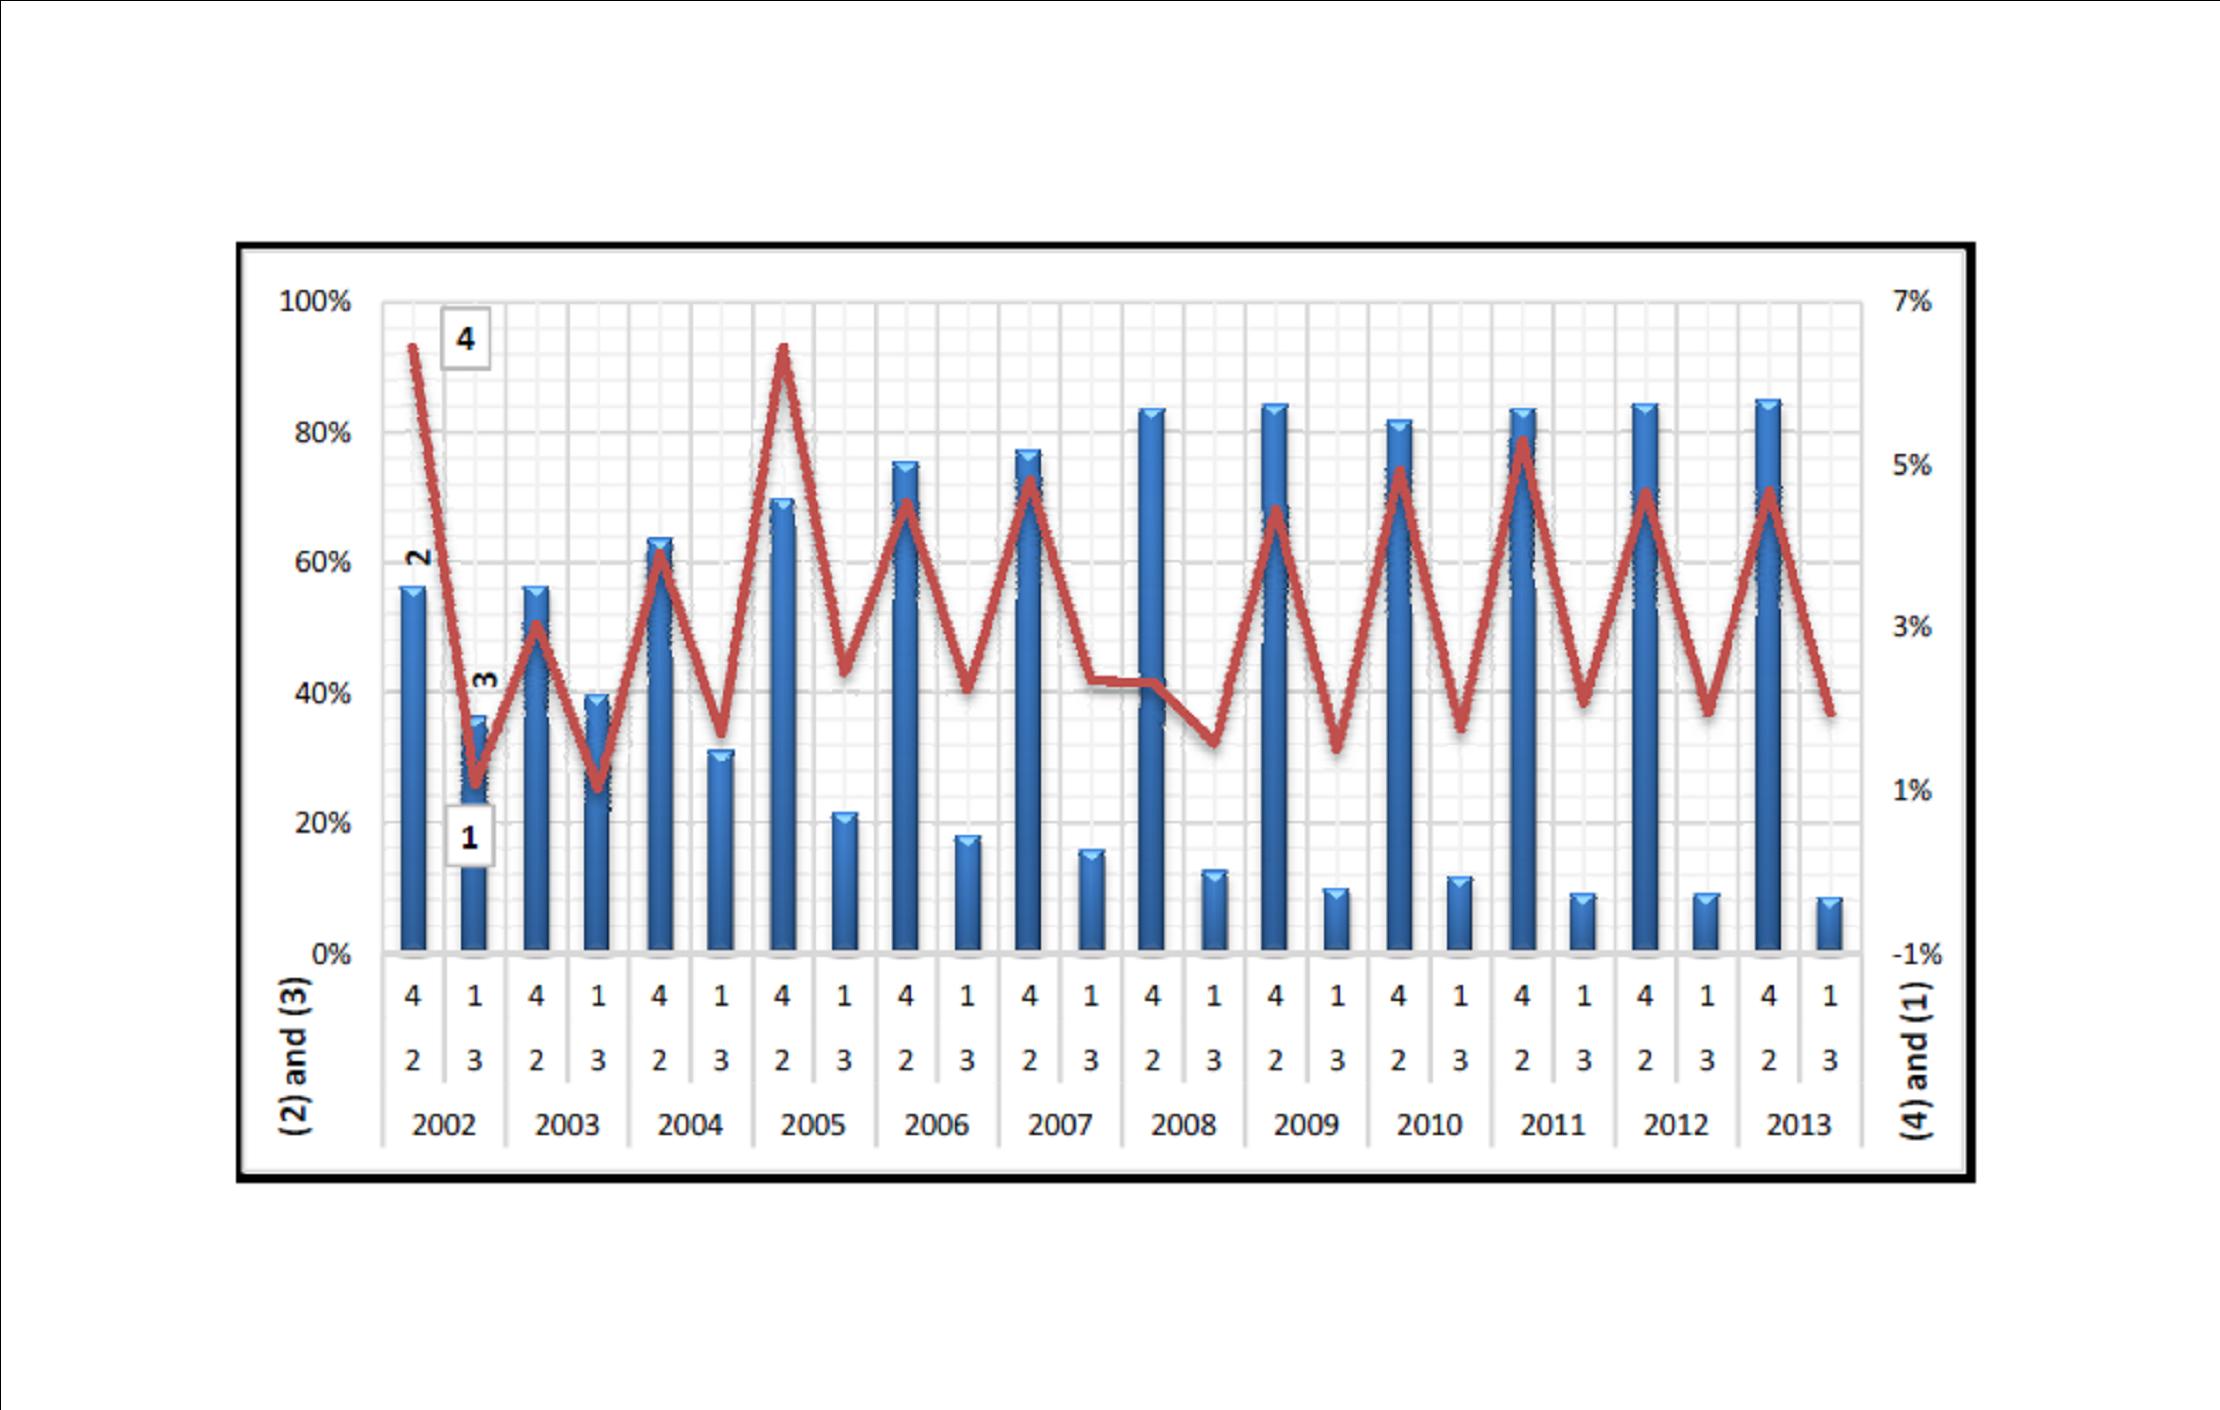
Further in this paper, we have focused on the exports for all four types of flowers products along the entire analysed period, 2002-2013. In that sense, we found interesting to emphasise the shares from the Total annual volume. In the figure below was taken information which summarise the facts that the major part of the exports consist in bulbs, tubers roots and rhizomes and foliage, branches and plants without flowers.
Figure 4: Exports — Share from the Total annual Volume (%), Flowers and Flower parts*. * data for Bulbs, tubers, tuberous roots, corms, crowns and rhizomes (1) and for Cut flowers and flower buds of a kind suitable for bouquets (3) have not been available for 2012 and 2013
(1) Bulbs, tubers, tuberous roots, corms, crowns and rhizomes; (2) Other live plants cuttings and slips; mushroom spawn;
(3) Cut flowers and flower buds of a kind suitable for bouquets; (4) Foliage, branches and other parts of plants, without flowers
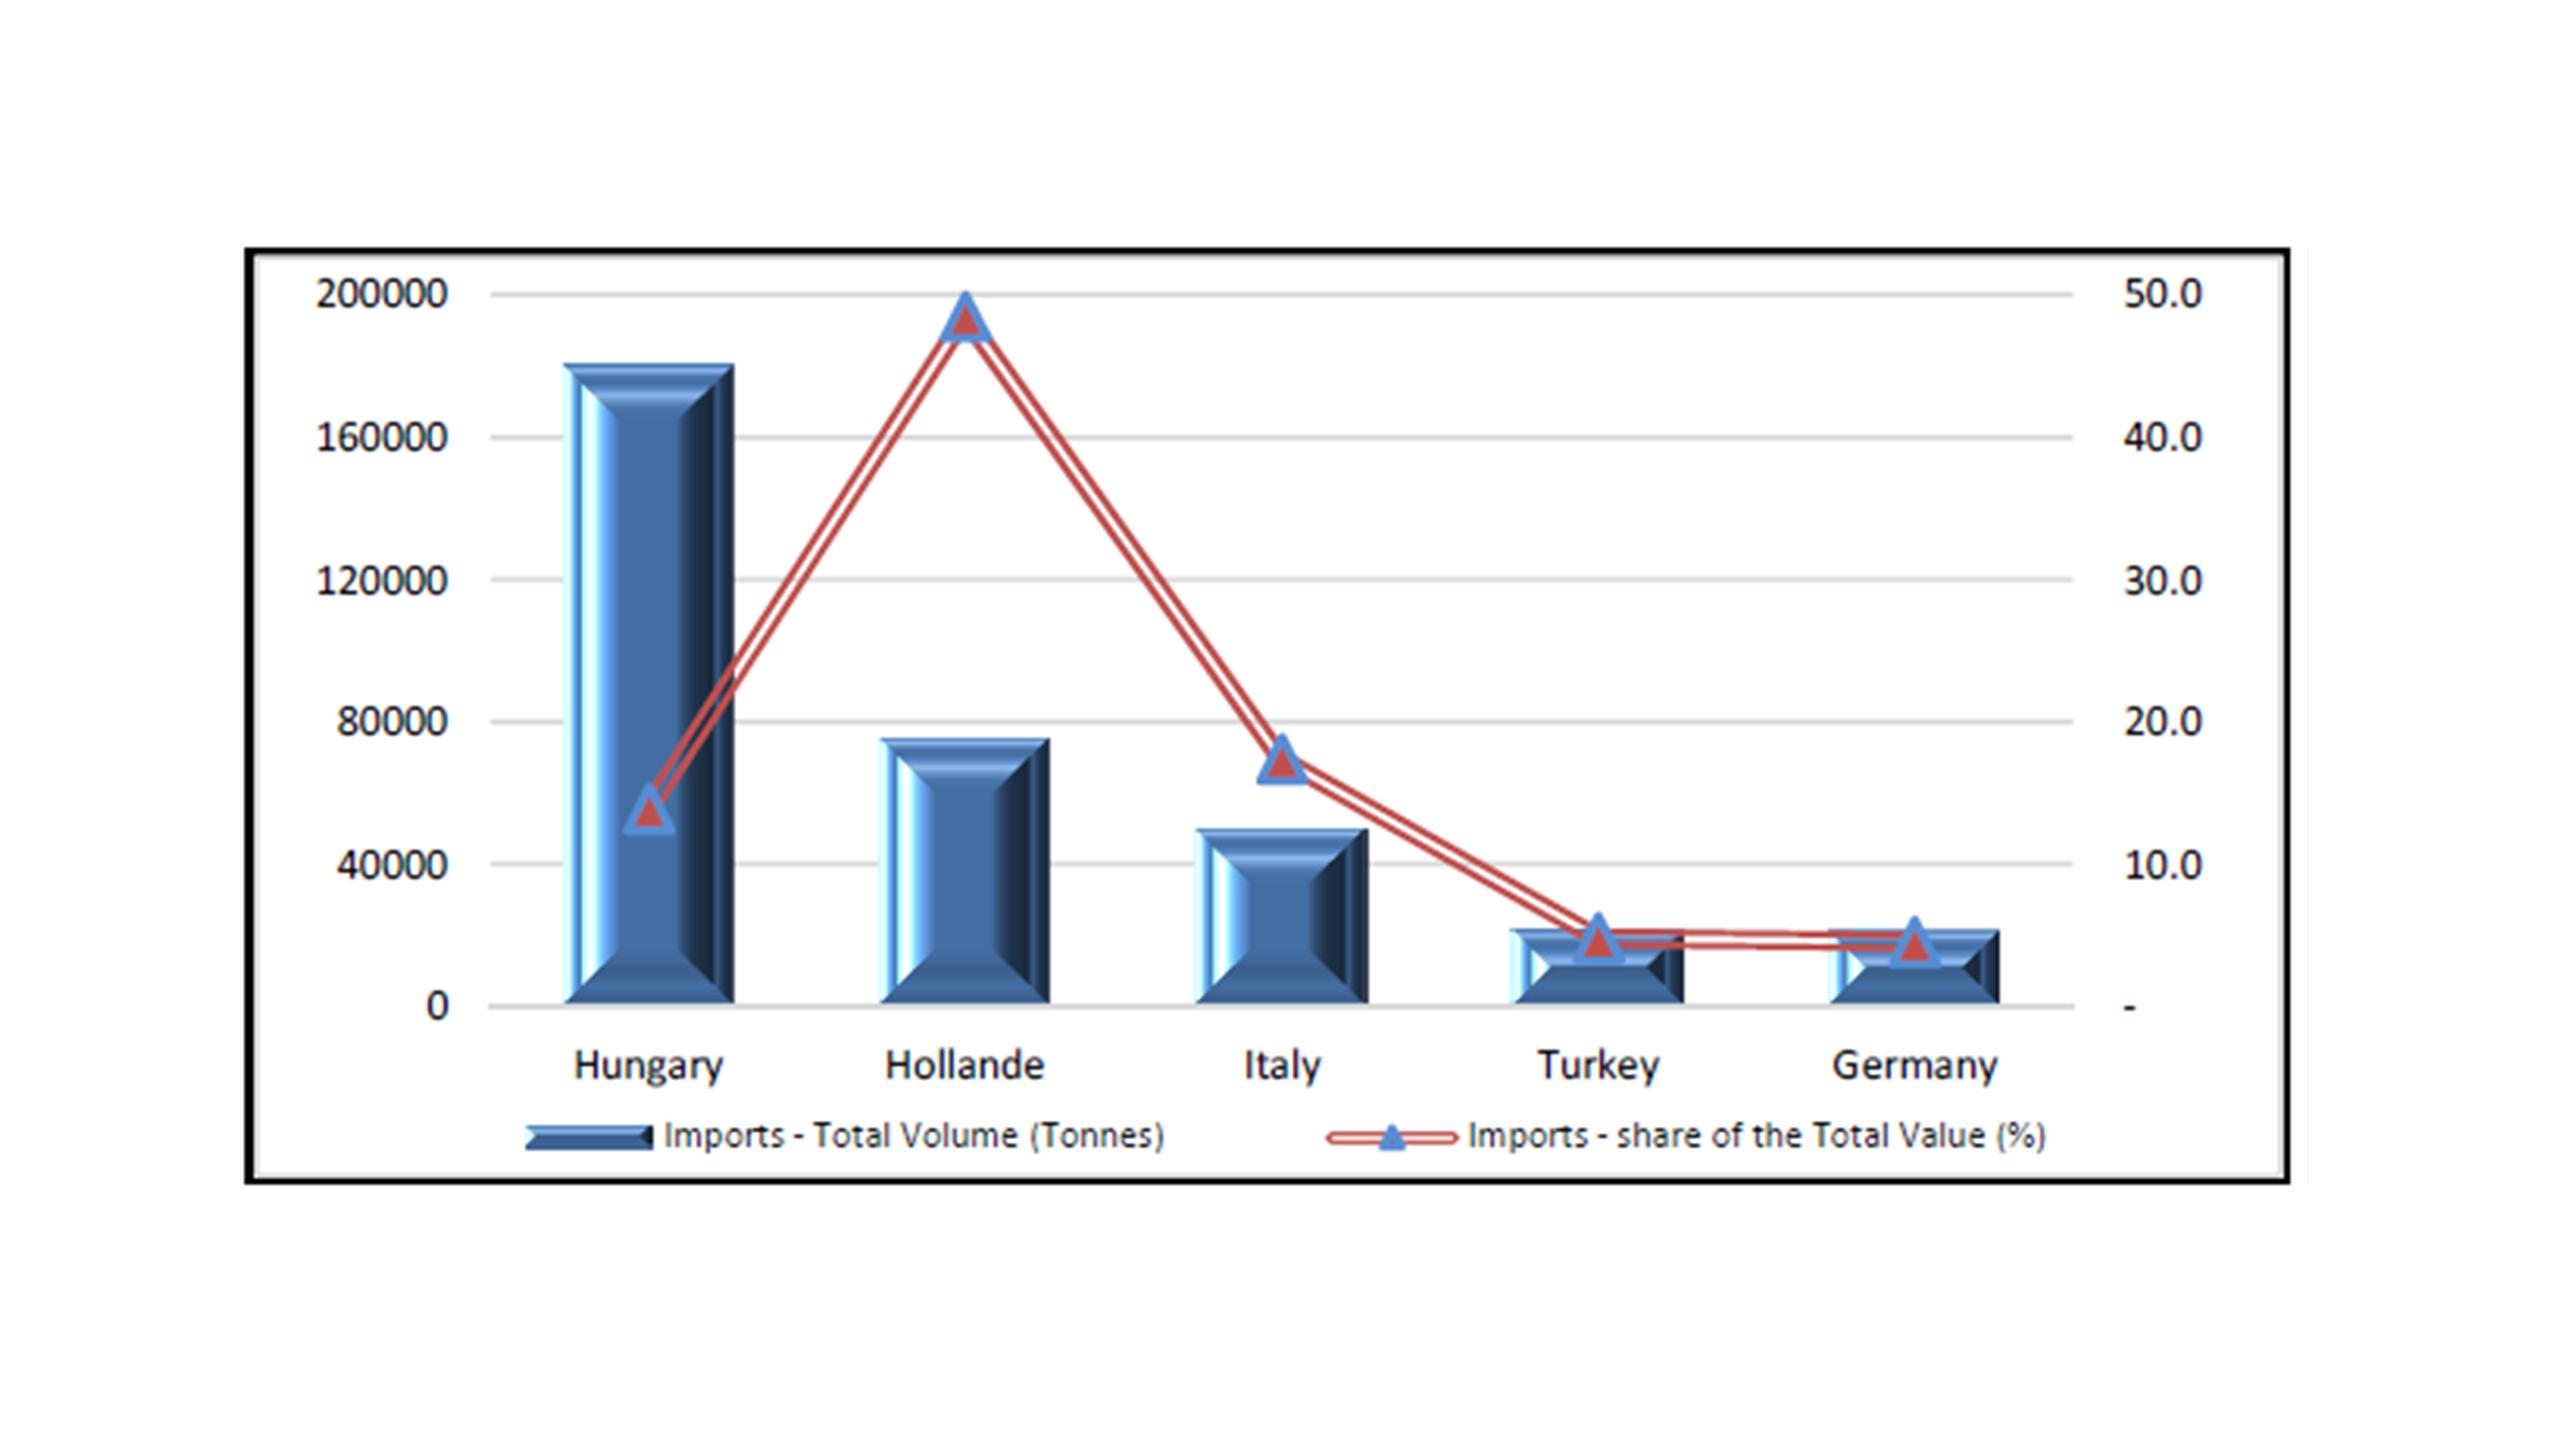
In the next part of the paper, we have focused on the imports of the flowers and flower parts. Concerning the imports, for Romania, the main fact to be mentioned here is the huge number of supplier countries. Among these ones, the first five countries (Hungary, Holland, Italy, Turkey and Germany) have been commercial partners for 10 years in the sector. All the above mentioned countries, except Turkey, reached the highest level of the volume after 2007. As for the value, Holland had the most valuable imports (48.51% from the total), followed by Italy (17.43%), then Hungary (13.93%).
Figure 5: Imports Total Volume and the share of the Total Value by the five first countries, Flowers and flower parts
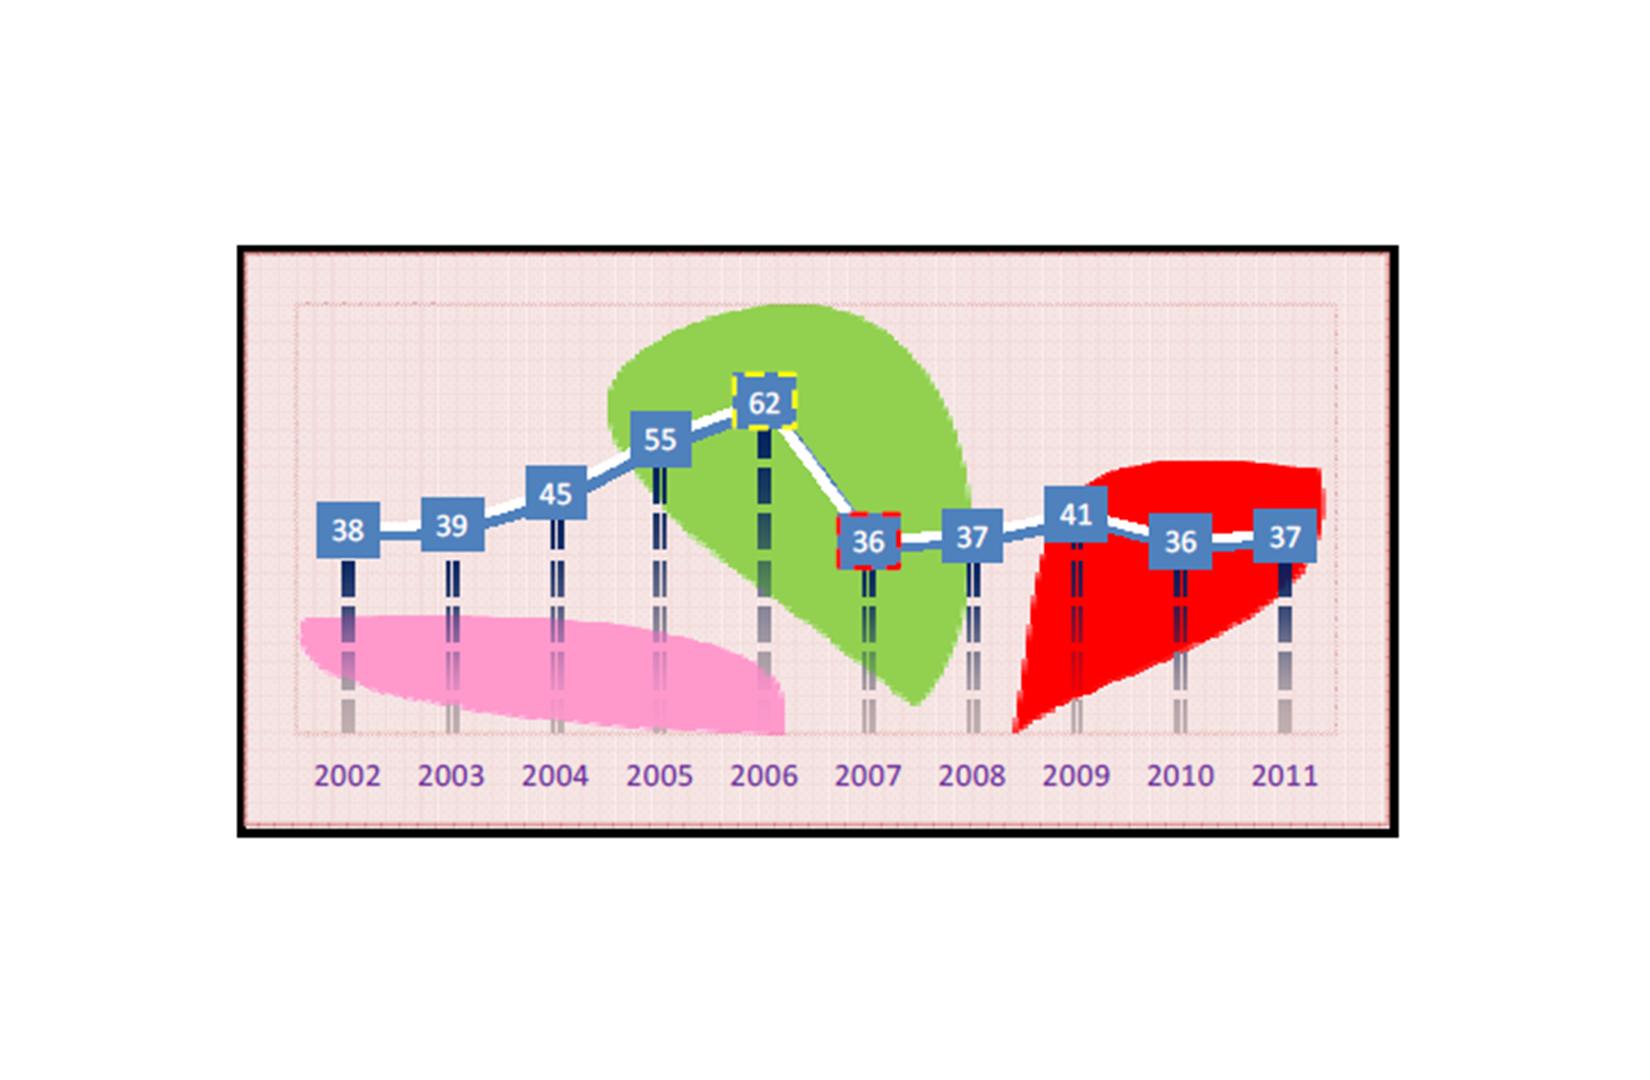
One of the most interesting figures for the imports was the dynamics of the number of suppliers of flowers and flowers products for Romania; it ranges from 36 in 2007 (and 2010) and up to the highest number of flower suppliers, 62, reached in 2006.
Figure 6: Number of flower’s suppliers, Romania
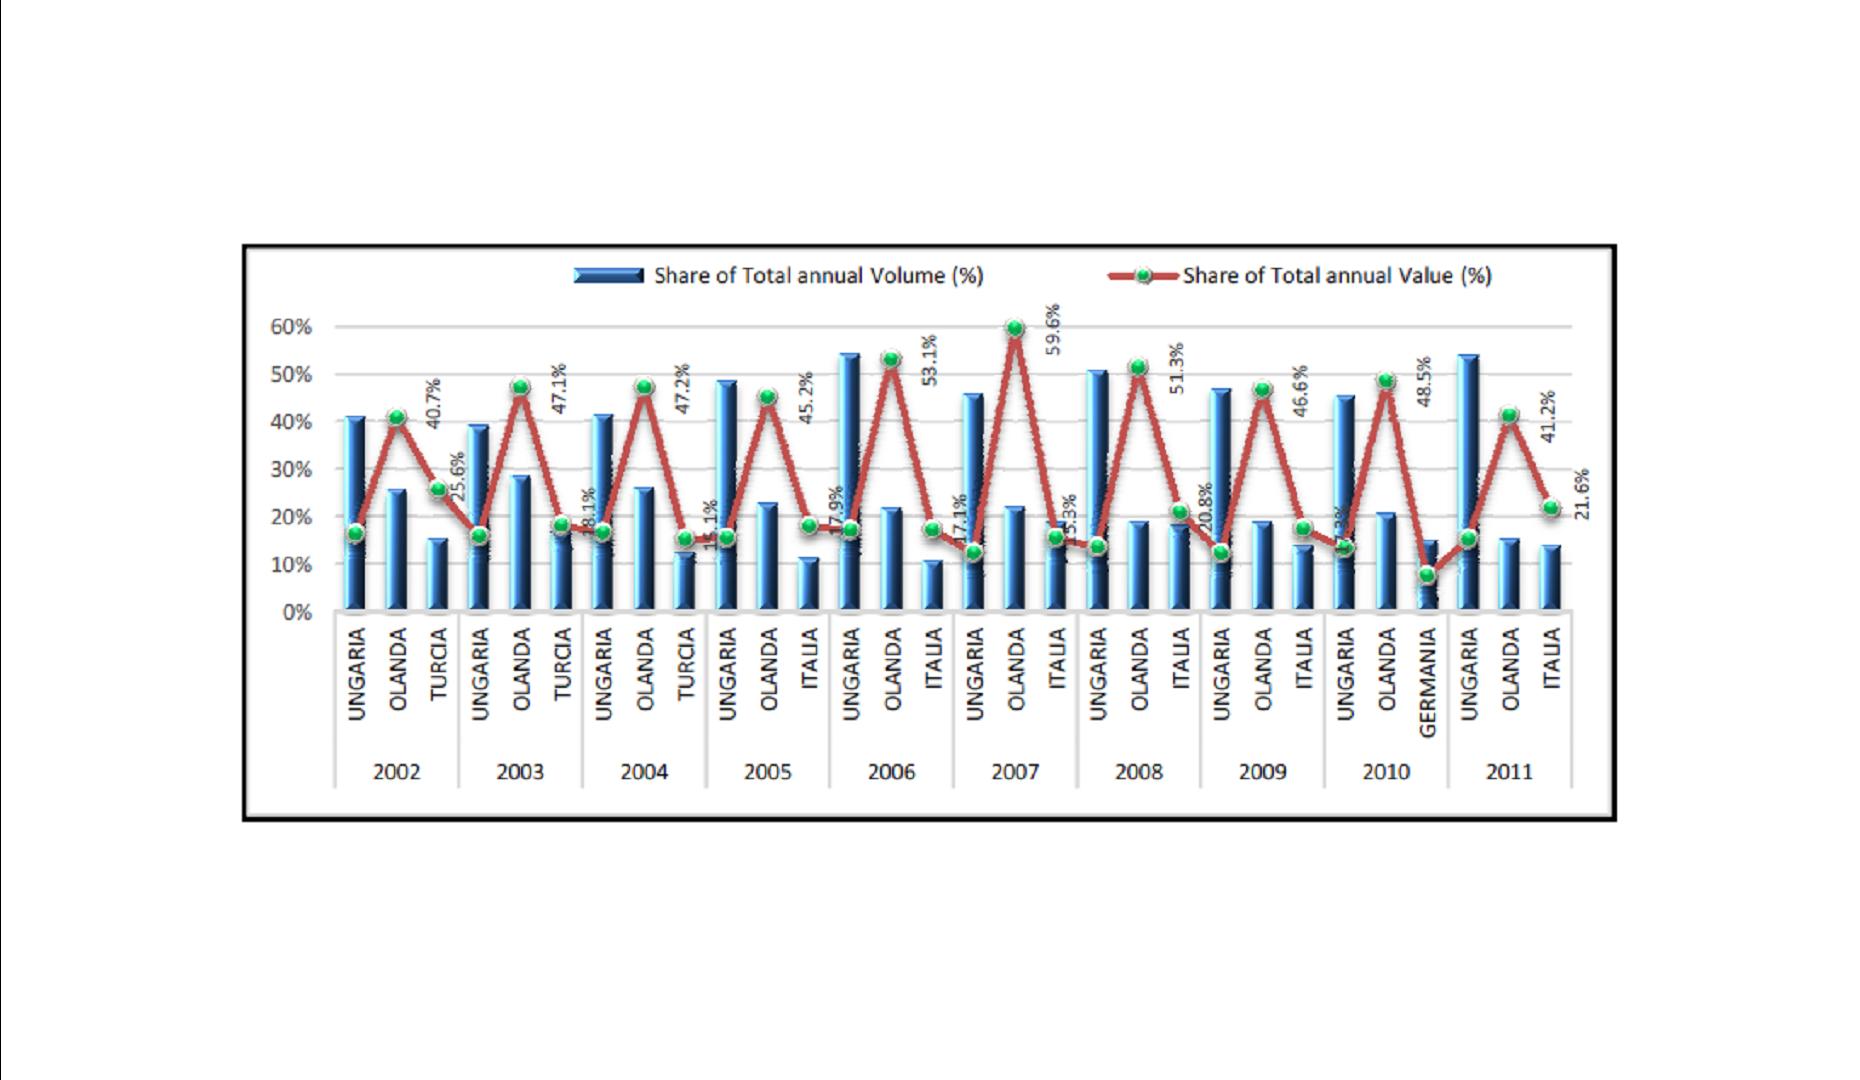
In the following figure, it has been presented the ranking of the first three countries, classified by the total annual volume and by the total annual value.
Figure 7: Imports — The share of Total annual volume and share of Total annual value, the first three countries, 2002-2011
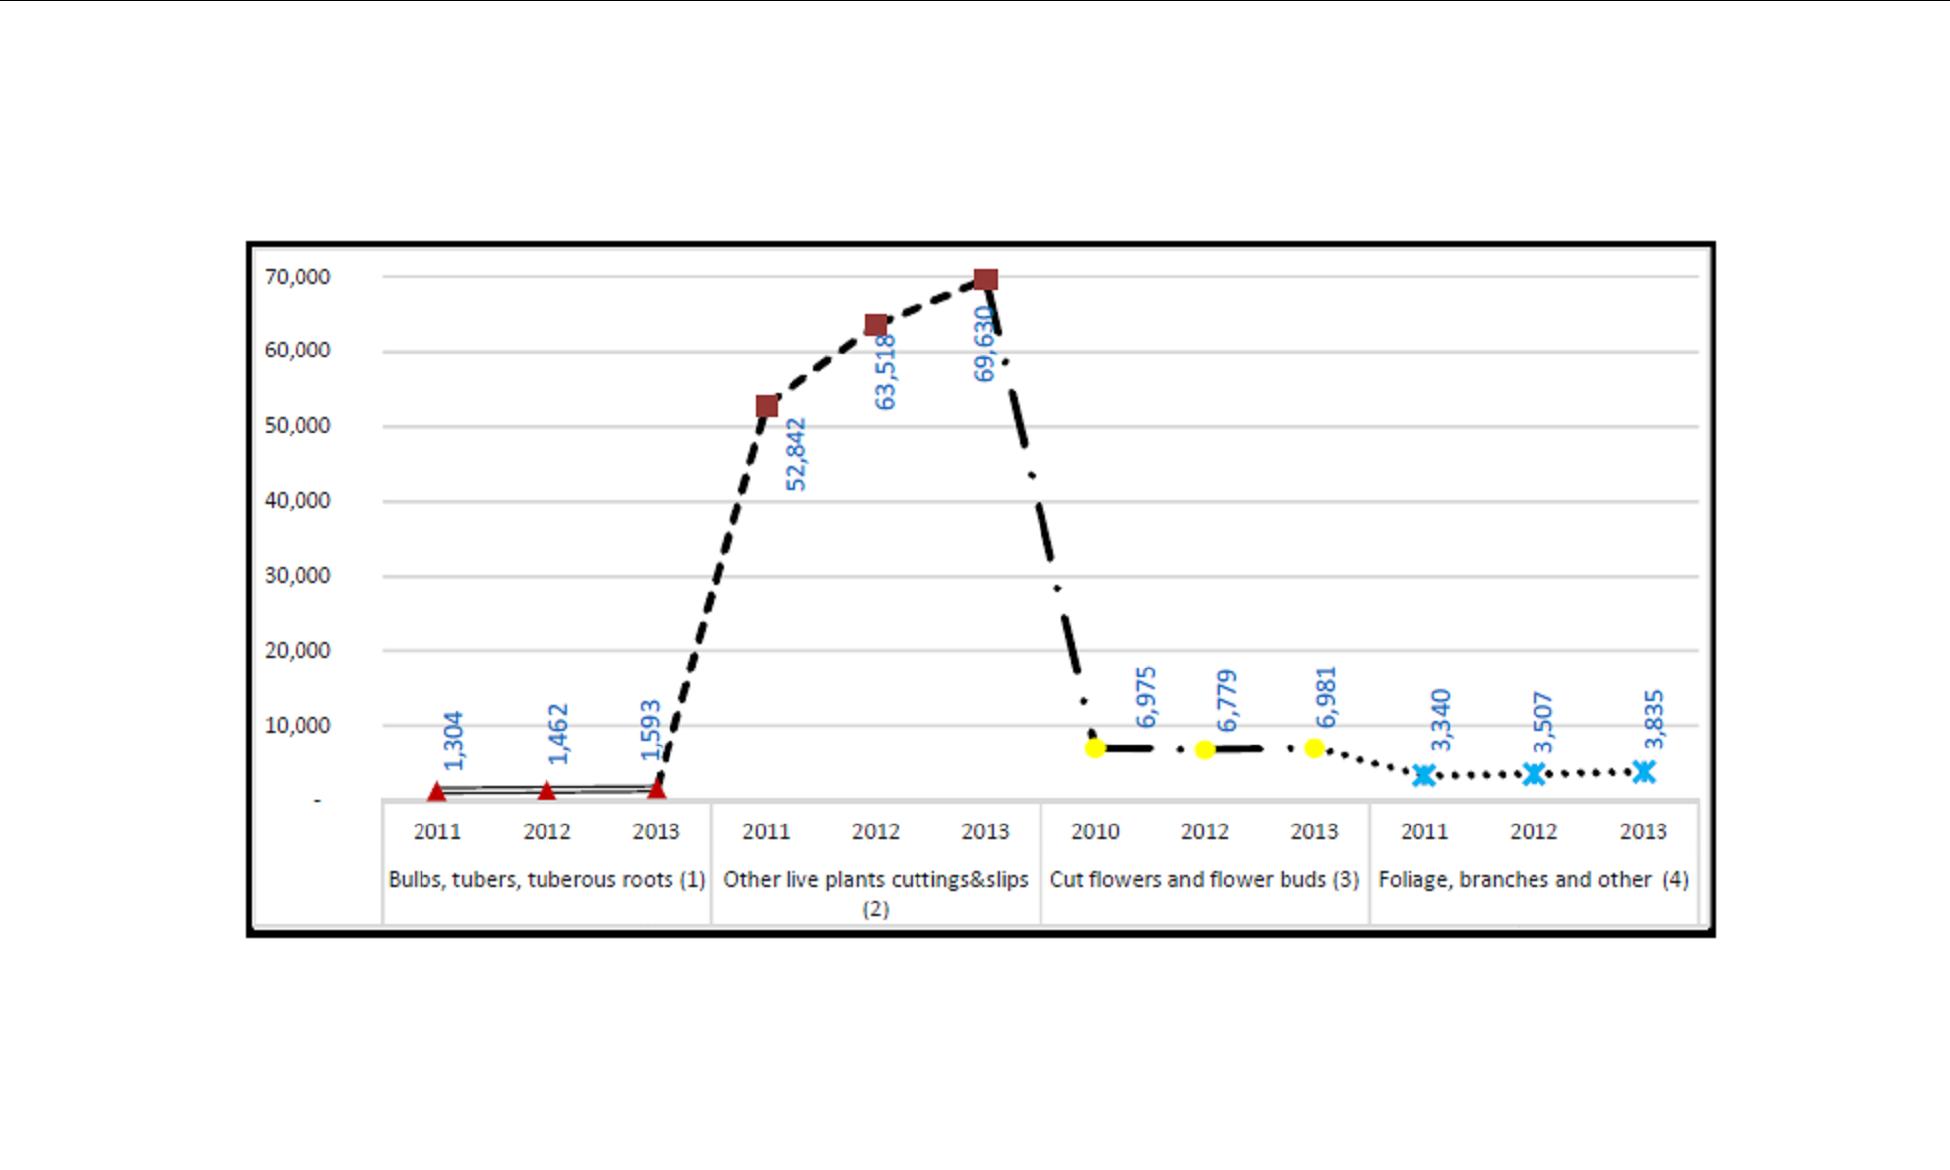
In the figure below, it is presented the ranking of the first three years along the 2002-2013 period when it has been reached the highest volume of the imports with flowers and flower products.
Figure 8: Imports by type of flower parts – ranking of the first three years (tons), 2002-2013
Compared to the exports of flowers, the volume of imports was much higher and the ranking point out the last years of the analysed period. Still, we have noted that among the fourth categories which are imported in Romania, there is (2) other live plants cuttings and slips that is placed from far on the top, and the lowest volume was imported for (1) Bulbs, tubers, tuberous roots. Taking into account this figure, it seems that in Romania are massively imported more trees, shrubs and bushes, roses (grafted or not), mushroom spawn, outdoors and indoors plants than bulbs, tubers, tuberous roots. The statements that we have noted above are confirmed in the graph here after. On the two different scales, during the 2002-2013 period, there are represented the shares in the total imported volume for the fourth categories of flower parts.
Figure 9: Imports of flowers and flower parts — Shares from the Total annual volume (%), Romania, 2002-2013
(1) Bulbs, tubers, tuberous roots, corms, crowns and rhizomes; (2) Other live plants cuttings and slips; mushroom spawn;
(3) Cut flowers and flower buds of a kind suitable for bouquets; (4) Foliage, branches and other parts of plants, without flowers
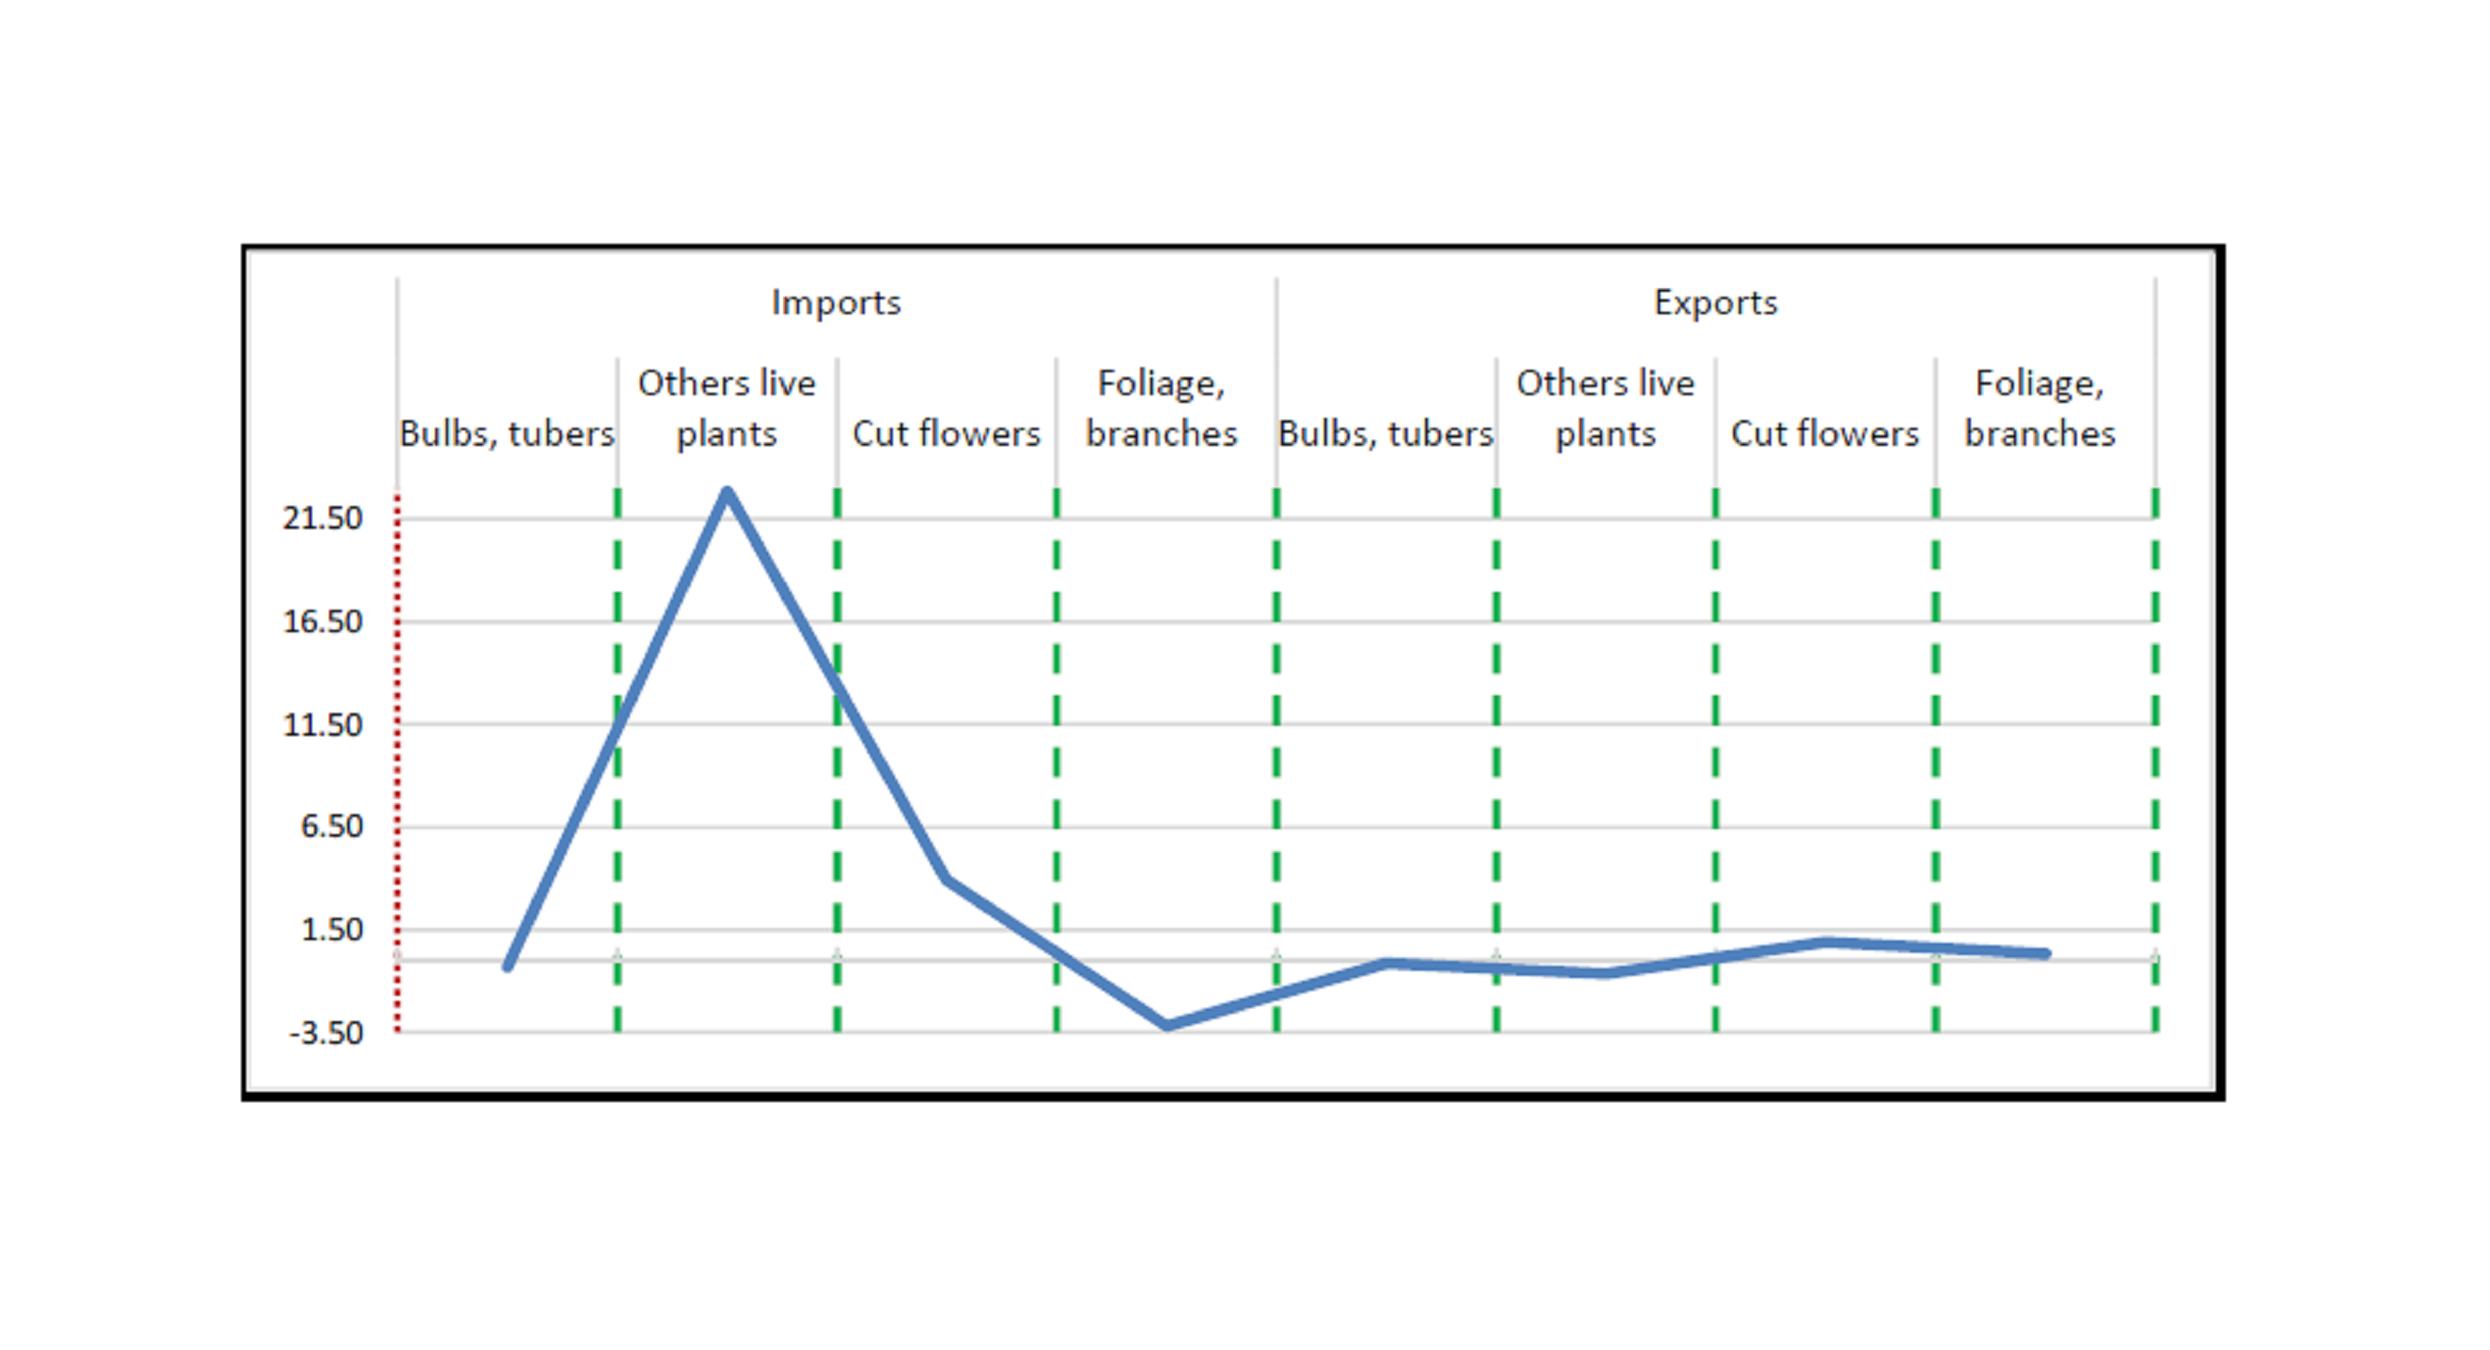
The last part of the paper concerns the analysis of the seasonality for the trade with flower products. In this sense, we have computed the seasonality index with the additive model. Taking the quarterly data for imports and exports, there have been displayed in the figure below the data for the average of the gross seasonal deviations; these time series have involved negative corrections; the corrections are more important for imports, especially for the category (2) Other live plants. Although modest in volume and decreasing on the period after 2007, exports were more stable than imports. The latter have suffered, according to the 4 categories, seasonal deviations quite large and even recorded negative values.
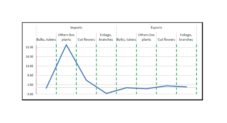
Figure 10: Averages of seasonal deviations, the four types of flowers products, additive model; own computation
The lowest level (on negative scale) of the seasonality corrections was registered for the category (4) Foliage and branches. Much more moderate as level of seasonal deviations, the exports have stood with the two first categories (Bulbs and tubers; other live plants) on the negative scale and with the two other (Cut flowers; Foliage and branches) on positive scale. In the figure below, quarterly designed, it has shown how each value contributes to the change over time.
Figure. 11: Corrected seasonal changes, Additive model, Romania’s flowers product trade; Source: own computation based on the data from the M.A.D.R. and NIS data, Bucharest, 2013
(1) Bulbs, tubers, tuberous roots, corms, crowns and rhizomes; (2) Other live plants cuttings and slips; mushroom spawn;
(3) Cut flowers and flower buds of a kind suitable for bouquets; (4) Foliage, branches and other parts of plants, without flowers
Conclusions
Globally speaking, from point of view of the total trade, Romania is a net importer for the agro-food products. Its domestic market is currently flooded with agricultural products coming from other countries and this because it does not have enough competitive processing capabilities. Specifically for the flowers market, Romania does not have the capabilities to cover its internal needs (domestic demand), so the imports are quite high. The conclusions of this study have pointed out that the volume of exports decreased in the last years, but it has been increased quickly for imports, especially for (2) other live plants and (3) Cut flowers and flower buds. Among the Romania’s foreign trade partners, Hungary had the highest level of the exported volume; it is followed by Germany, Austria and Italy. The most valuable exports went to Germany. Another major aspects of the imports are the high number of the trading partners and predominance of products more valuable after the year 2007. Still, during the analysed period of 12 years, the main trading partners are almost each year the same European countries. In terms of value and quantity, exports are much smaller than imports and have shown a lower stability of the trade partners. As for the analyse of the seasonality, there were recorded negative corrections in the first quarter for the flower categories (4)-imports and (2)-exports; in the second quarter there were negative values for the flower categories (1) and (4)-imports and for (4)-exports. The third quarter has registered negative seasonal corrections for all categories, imports and exports, except for flower category (1)-imports. The results for the last quarter have shown values under zero for the flower categories (1), (2) and (3)-imports and (3)-exports.
References
1. Chipman J.S., 1965. A Survey of the Theory of International Trade, Econometrica, Vol. 33, No. 3 (Jul., 1965), pp. 477-519, The Econometric Society, http://www.jstor.org/stable/1911748.
2. European Commission, Brussels, 2010. Trade as a driver of prosperity, “Trade, Growth and World affairs”. SEC(2010) 1269 Commission staff working document, {COM(2010) 612} {SEC(2010) 1268}.
3. Grossman G. and Helpman E., 1989. Product Development and International Trade, Journal of Political Economy, Vol. 97, No. 6, pp.1261-1283.
4. Kuppusamy J. and Anantharaman R.N., 2012. The Link between Export Performance and Export Development: Does Managements’ Motivation Play a Role?, IBIMA Publishing, Journal of Organizational Management Studies, http://www.ibimapublishing.com/journals/JOMS/joms.html, DOI: 10.5171/2012.645053.
Publisher – Google Scholar
5. Love P. and Lattimore R., 2010. International Trade: Free, Fair and Open?, OECD Insights, Paris, OECD, ISBN 9789264060241.
6. Moïsé, E., Delpeuch C., Sorescu S., Bottini N. and Foch A., 2013. Estimating the Constraints to Agricultural Trade of Developing Countries, OECD Trade Policy Papers, No. 142, OECD Publishing, Doi: 10.1787/5k4c9kwfdx8r-en.
Publisher – Google Scholar
7. Muhammad A., D’Souza A. and Amponsah W., 2013. Violence, Instability, and Trade: Evidence from Kenya’s Cut Flower Sector, World Development Vol. 51, pp. 20—31, Published by Elsevier Ltd., doi:10.1016/j.worlddev.2013.05.004.
Publisher – Google Scholar
8. Riisgaard L., 2009. Global Value Chains, Labor Organization and Private Social Standards: Lessons from East African Cut Flower Industries, World Development Vol. 37, No. 2, pp. 326—340, 2009, www.elsevier.com/locate/worlddev, doi:10.1016/j.worlddev.2008.03.003.
Publisher – Google Scholar
9. Selmi N., 2012. Technology Transfer and International Integration of Developing Countries : An Empirical Investigation of Tunisian’s Case, IBIMA Publishing, Journal of African Research in Business & Technology, Vol. 2012 (2012), Article ID 290785, 18 pages, http://www.ibimapublishing.com/journals/JARBT/jarbt.html, DOI: 10.5171/2012.290785.
Publisher – Google Scholar
10. Viorica E.D., 2012. Econometric Estimation of a Gravity Model for the External Trade of Romania, IBIMA Publishing, Journal of Eastern Europe Research in Business & Economics, http://www.ibimapublishing.com/journals/JEERBE/jeerbe.html, Vol. 2012 (2012), Article ID 854058, 9 pages, DOI: 10.5171/2012.854058.
Publisher – Google Scholar
11. Winters L.A., 2004. Trade liberalisation and economic performance: an overview, The Economic Journal, 114 (February), F4—F21, Royal Economic Society 2004, Blackwell Publishing.
Google Scholar
12. www.insse.ro On-line tempo series
13. www.madr.ro