Introduction
As cultural creators, who specialize in the project management, we keep encountering the same problem: misunderstanding the meaning of the project plan. Cultural managers believe that the project plan is identical with the schedule of tasks. But this view is not consistent with reality. We have decided to use less common methodologies and tools in order to convince managers in cultural and creative industries that it is necessary to change their approach to planning. We have used a scientific research method which may become the language of managerial decision makers, scientists and activists in the creative environment. This common language is the systems thinking, system dynamics and its simulation models. The space in which we will model problems related to projects is culture.
Literature Review
Culture is considered herein as a transmission medium by which people driven innovation occurs (Edgeman and Eskildsen, 2012). In our society, creativity is perceived as a synonym to success, modern trends and enthusiasm. The creativity is seen as a prerequisite for a society that strives for innovation and progress. And this is where Europe has its chance — in ideas, innovation and creativity, which should be close to artists (Cikánek, 2012). Arts and culture have always been the basic sources of creativity (Žáková, 2010). However, the whole lifecycle needs to be managed to conduct product management successfully (Bures, 2012).
According to Guntern (in Steiger and Lippmann, 2012) a creative product meets four criteria: it must be original and unique, it must be functionally adequate (the product must fulfil its functions properly), formally perfect (which means that the product is to be beautiful) and must be competent and considered as valuable by critically minded people. Radim Bačuvčík (2012) discusses in his monograph Culture Marketing the concept of a product of cultural organizations, which can be viewed from two perspectives: on one hand the product is what the organization wants to create and offer; on the other hand, the product means that by its purchase a customer gains benefits, for which he is willing to pay and consume.
According to Jitka Kloudová et al., (2010) a creative product is an output of human activity which involves a high proportion of creativity; it can take both tangible and intangible form, whereas the value of a creative product is primarily determined by its users and their interests rather than the amount of creativity contained in the product.
On the basis of that discourse we can now compile a definition for the new phrase: creative project management and creative project. Creative project management is a way of generating new value, which is based on a unique talented personality of its creator aimed at creating a high quality product within specified limits. A creative project is a temporary organization that has been created for the purpose of delivering original and formally perfect products containing intellectual property, delivered in accordance with pre-agreed objective and within specified limits (Å viráková, 2014).
Using the system dynamics model on the example of the case study concerning the Laboratory project, we can show cultural managers how a project may be implemented in practice. We can simulate problems the manager solves within the project; we can reveal hidden dependencies, highlight obvious problems and their impact on the project success. This is where the approach of the article is innovative; it brings a new view of the meaning and importance of planning at the management of a creative project. A similar issue is discussed by Vojtko and Hesková (2010), who proposed and defined a model of possible use of a simulator supporting this knowledge change management not only for educational purposes, but also for practical applications. Botek (2013) also confirms in his research the positive impact of including interactive elements in teaching.
Materials and Methods
The main method for achieving the objective of this article is system dynamics (Forrester, 1961), which is based on the concept of systemic thinking (Bertalanffy, 1976, Senge 2006). It is a scientific method of investigation, which is focused on solving real-world problems. Knowledge and tools of systems thinking play nowadays an important role in more effective organisation management. (Kolerova, Bures and Otcenaskova, 2014). The system dynamics is focused on the study of the behaviour of complex social systems. This scientific methodology helps to better understand quality systems, where there is a high degree of detailed and dynamic complexity. On the model we can test the accuracy of setting up the plan of the creative project and compare it with the actual project development. We get the model data using a qualitative research in the project.
The System dynamics process
Jay W. Forrester (1994: 3) suggests a six-step procedure for creating a system dynamics model. The research begins with one step, when we notice an undesirable behaviour of the system. At first we have to understand the problem and only then we can propose measures to correct the problem. According to the research results (Krátký 2013: 6) generally the contentious issues of the project included: the failure to meet the deadline (mentioned by 83% respondents), the failure to achieve the determined objective of the project (64 % respondents), failure to meet the budget (66 % of respondents), failure to evaluate project benefits (50 % of respondents). Based on this defined problem we can formulate a research question that remains to be answered: what is the reason the project managers fail to manage the project in order to meet at least the following designated four aspects of the project implementation: time, scope, costs and benefits?
In the second step simulation model is defined. The system is visualized through the levels and flows. Creating this model means that, we would have to revise an often vague description of the system problem from the Step 1 in order to increase its accuracy. The third step is to run the simulation model. This assumes that we are ready to fill numerical model with data so that the dynamic simulation can display the development of the project in time. We can measure and simulate not only the projected (estimated) project development, but also its real development in case we have available relevant data. In the fourth step, we use a tool that clearly (explicitly) expresses a simplified description of reality and the problem that occurs within the project. The fifth step has a direct impact on the educational process. The modelling results shall be shared; we should give some space to project team members during the discussion to comment on the reality of the project development, causes of the occurrence of issues, the forecast of the future development of the project. According to Jay W. Forrester (1994) it is the greatest challenge for the project management, its sponsors and team members. This appeal is followed by the sixth and final step, which is the implementation of changes in the team leadership policy, or the interference with the project scope, quality control and access to measuring benefits as a practical issue of the successful implementation of the project plan.
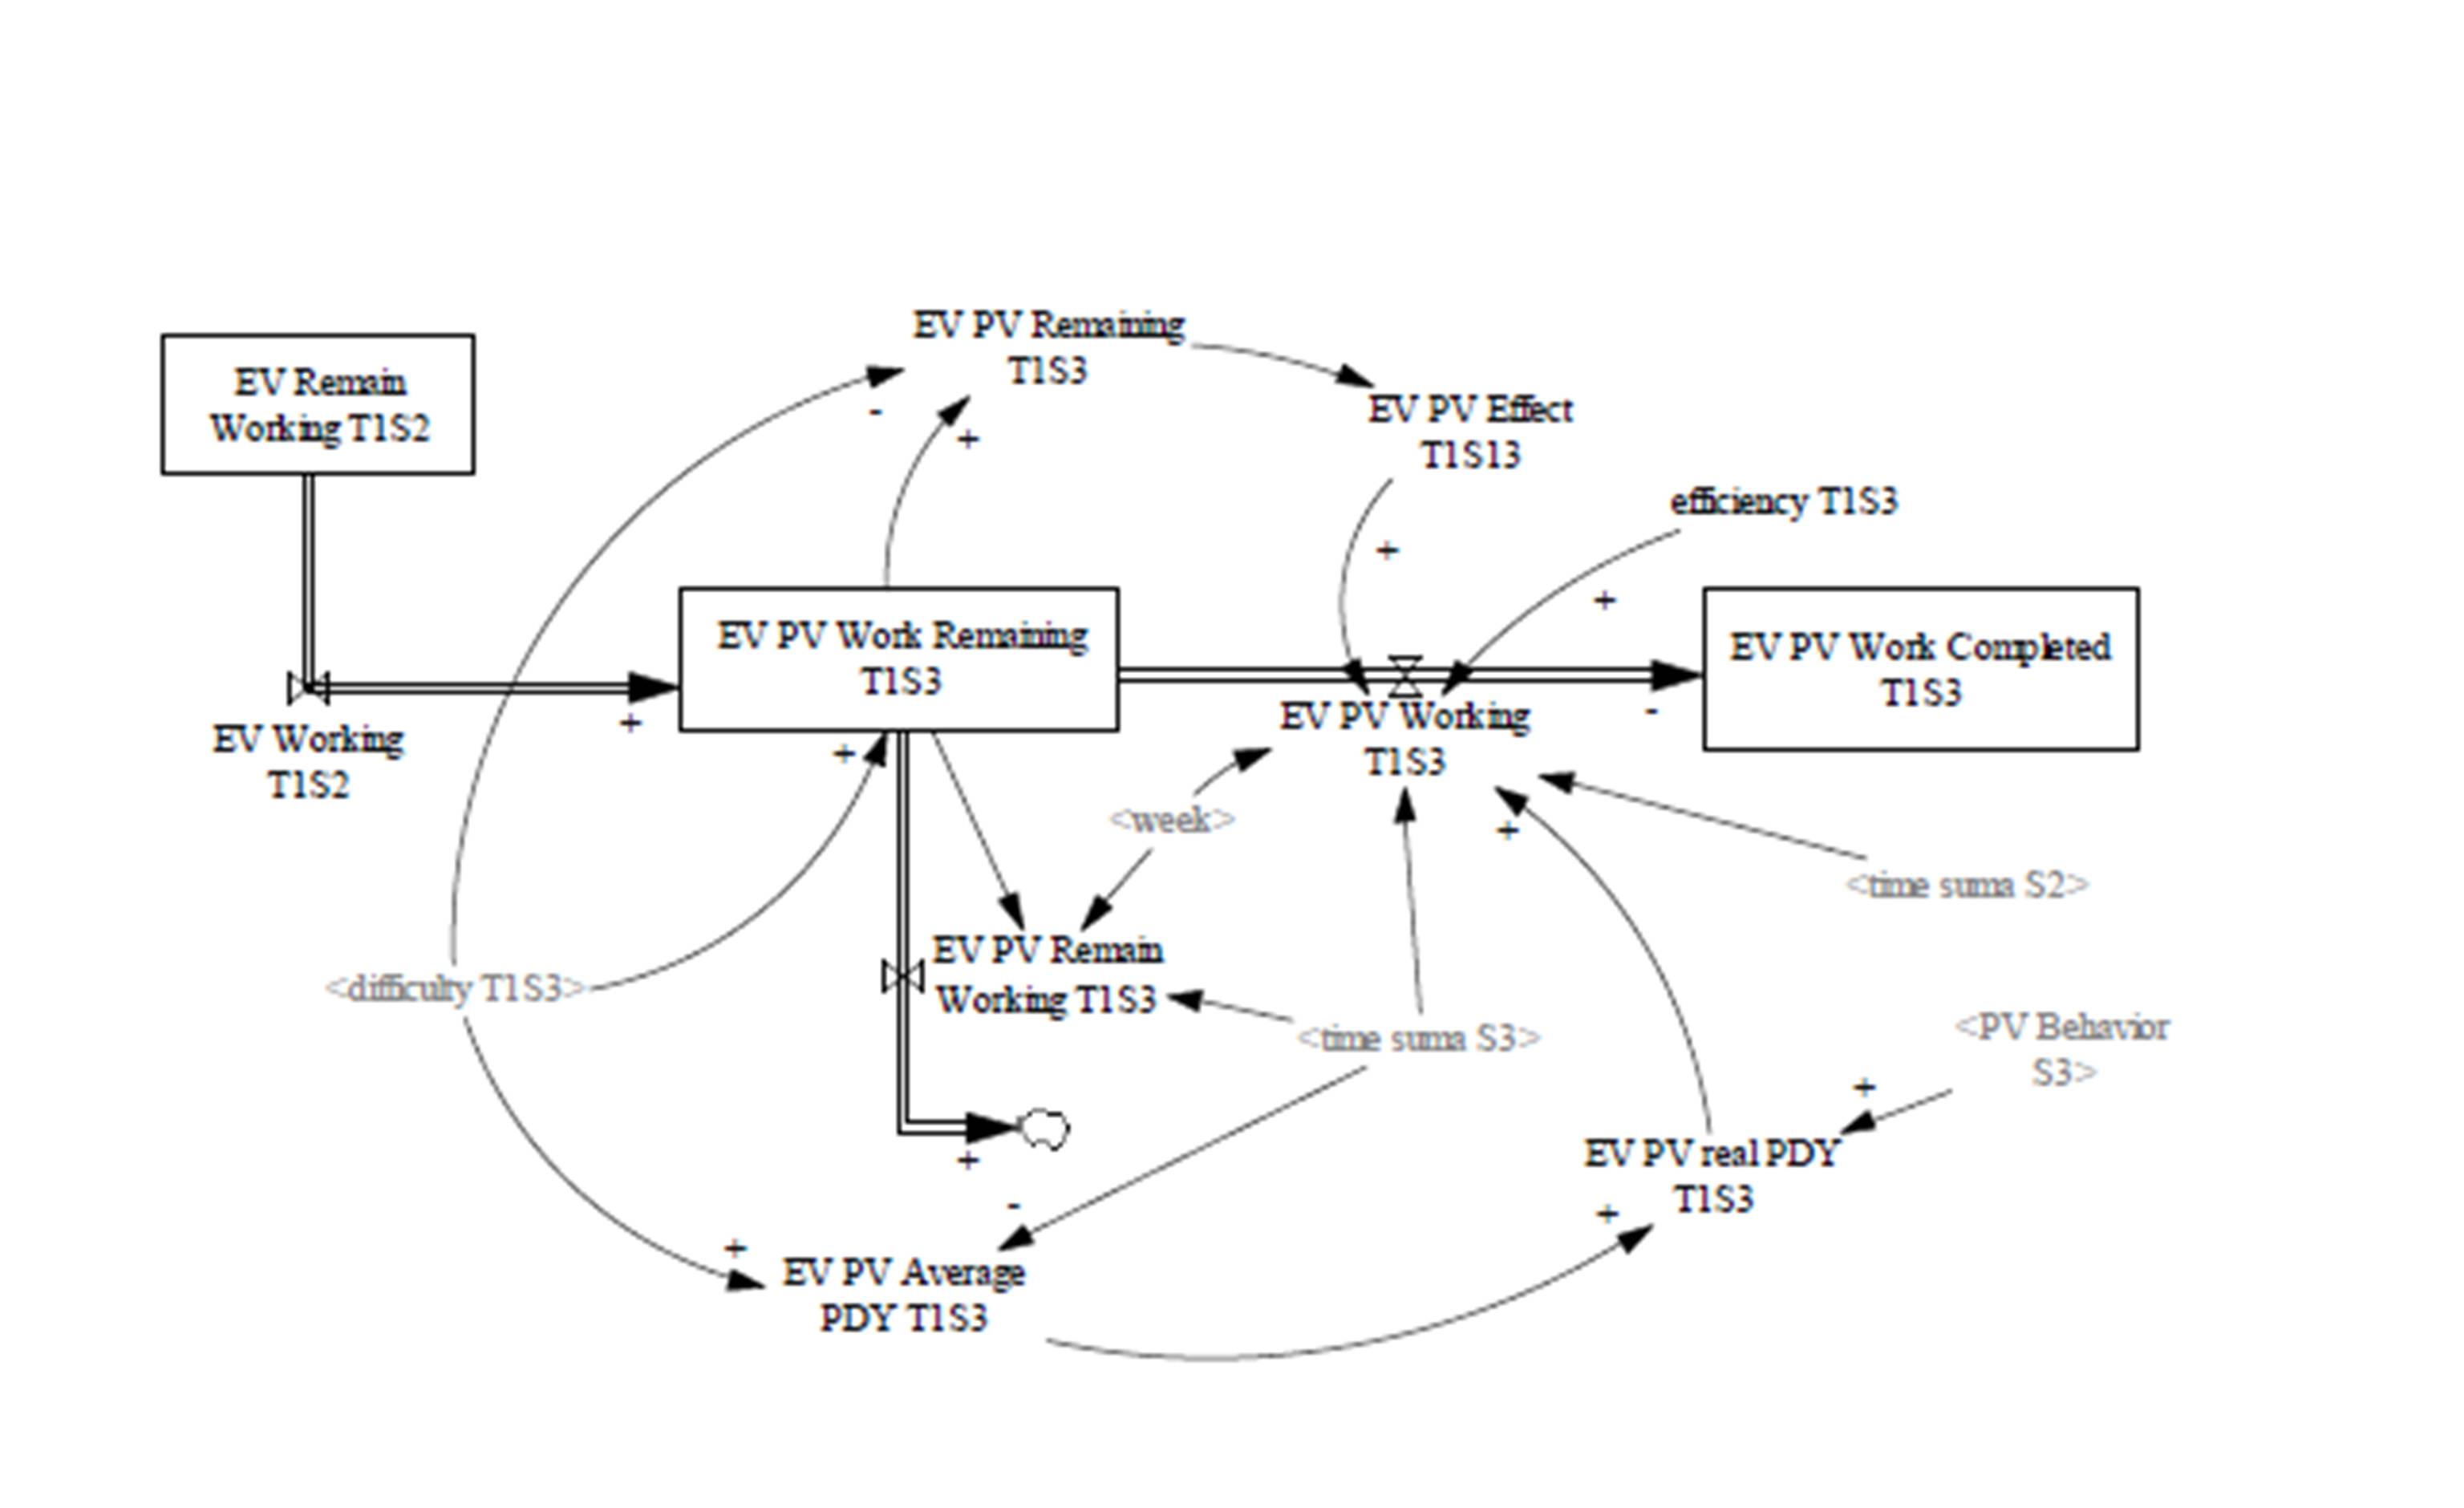
The sequence of elements that is repeated in the complex system dynamics model is shown in Figure 1. The sample includes all the building blocks of the system dynamics, i.e. levels, flows, variables, feedback loops.
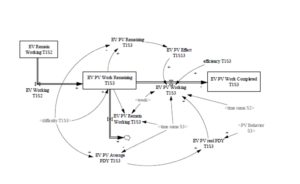
Figure 1: A part of the system dynamics model of a case study (Team 1-Production, Stage-3)
(Source: Own work)
Standards and methodology of the project management
To prepare the data into a project model tools and techniques of A Guide to the Project Management Body of Knowledge (PMBoK 2000: 114): Earned Value Management method and the triple constraints technique according to the standard ICB (Pitaš 2008: 275) have been used. As a methodical support the internationally recognized methodology Projects in Controlled Environments (PRINCE2 2009) has been developed.
We have namely used the PRINCE2 (2009) methodology for the design of the system dynamics model as a source of principle of management in stages, the principle of focusing on products, issue of plans, stage process management and stage border management, product delivery management and the progression topic (Å viráková 2014: 36). According to PRINCE2, there are six aspects of the project implementation that must always be managed: time, scope, costs, benefits, quality and risks. We can work with all the features of the project in the system dynamics model.
Qualitative Research
We have chosen the Laboratory project through the purposeful selection methodology. The project has been organized by academics at Tomas Bata University in Zlín. The team of coordinators of the Laboratory project, headed by the project manager, has altogether ten members; it is organized so as to provide five key activities. All faculties of Tomas Bata University in Zlín have been involved in the project. One of the faculties, the Faculty of Multimedia Communications, has been involved in the preparation of creative textbooks, animated cartoons and feature movies, which innovate the teaching methodologies. The Faculty of Technology guarantees the scientific validity of creative products.
From now on, we will only deal in our description of the qualitative research with activities of the Faculty of Multimedia Communications and the communication between creators and scientists from the Faculty of Technology. For modelling purposes we have created the following organizational structure, which consists of five teams: 1-Animated cartoons – general science, 2-Animated cartoons – technology, 3-Film Water, 4-Film Beauty of the surface, 5-Graphic design. A description of research of six aspects of the project implementation, which must always be managed (PRINCE2: 2009), follows.
Time
The Project began in March 2014 and its completion is scheduled for June 2015. The time period of the project implementation has been divided into 9 unequally long stages:
The first stage: (13 weeks)
The second stage: (13 weeks)
The third stage: (9 weeks)
The fourth stage: (10 weeks)
The fifth stage: Week 46 to 48 – i.e. by 31/01 2015 (3 weeks)
The sixth stage: (4 weeks)
The seventh stage: (4 weeks)
The eighth stage: (4 weeks)
The ninth stage: (2 weeks)
Completion of the project – the final stage (8 weeks)
We completed the qualitative research of the Laboratory project for this article by 31 January 2015, i.e. at the end of the fifth stage, when we examined the actual status of the project. Stages from 11 January 2015 have been reduced due to the requirement of the project manager for better supervising over the implementation of the project plan.
Scope
Based on a detailed analysis of the project plan and based on an interview with the project manager we have found that the total number of planned creative project products is 36 (pieces). We have decided that for the purposes of modelling we will classify their difficulty so that we can evaluate both the plan and backlogs of creative products. The planned difficulty has been set to a value of 992 points. No creative product has been completed and delivered by 31 January 2015; nevertheless all 36 creative products have been under process by then. The total value of the work in process has been determined at 503 points based on qualitative research. This fact led the project manager of the Laboratory project to the question of whether under such circumstances it is possible to meet the deadline of all products delivery (by 30 June 2015) so that the supplies of all created products are of the good quality so that they can be entered in books on the date specified in Laboratory project costs and paid for, see the following aspect of the project implementation (costs).
Costs
The last 8 weeks of the time of the project implementation has been left for the processes of bookkeeping all project costs. The projected budget of this part of the project amounts to the value of EURO122,750. The budget was recalculated to the points so that its total value in points is the same as the total value of the difficulty in achieving project products (992 points). By the last day of the 5th stage 437 points had been entered into accounts.
Benefits
The project manager in the project plan declares contributions towards the target group as follows: For the teaching staff of secondary schools and primary schools, who are engaged in systematic work with students and pupils in the area of the familiarization with science and research, a space for obtaining the latest information from the theory and research will be created, which may enhance innovative practices in their lessons. However, no objectively measureable indicator has been specified to measure the contribution.
Quality
The concept of quality is not present in the Laboratory project. That is the reason why quality has not been processed in the system dynamics model, although it is a vital aspect of the successful project implementation. As later research results clearly indicate, they will significantly affect the actual project schedule.
Risks
The project plan identifies the following risks in the case of employees of high schools and primary schools, who do systematic work with students and pupils in the field of science and research: willingness to engage in key project activities, namely the preparation of methodological materials and aids in popularization and promotion of science and technology. Another risk of the project is its short duration, which places high demands on the successful and rapid implementation of all key activities. However, the risks have not been further monitored by the project manager, so we were not able to include this aspect in our model.
Based on the acquired information we have created a register of creative products of the project. For all animated cartoons and feature movies, as well as for graphic design products, we have outlined the stages the creative product had to pass through during its production. For example, we have divided the production of an animated cartoon into the following ten stages: 1-topic; 2-script; 3-sketches; 4-storyboard; 5-animatic; 6-animation in line; 7-animation colouring; 8-sounds; 9-music; 10-commentary. At the end of each phase a creative interim product must be created that can be evaluated in terms of its quality.
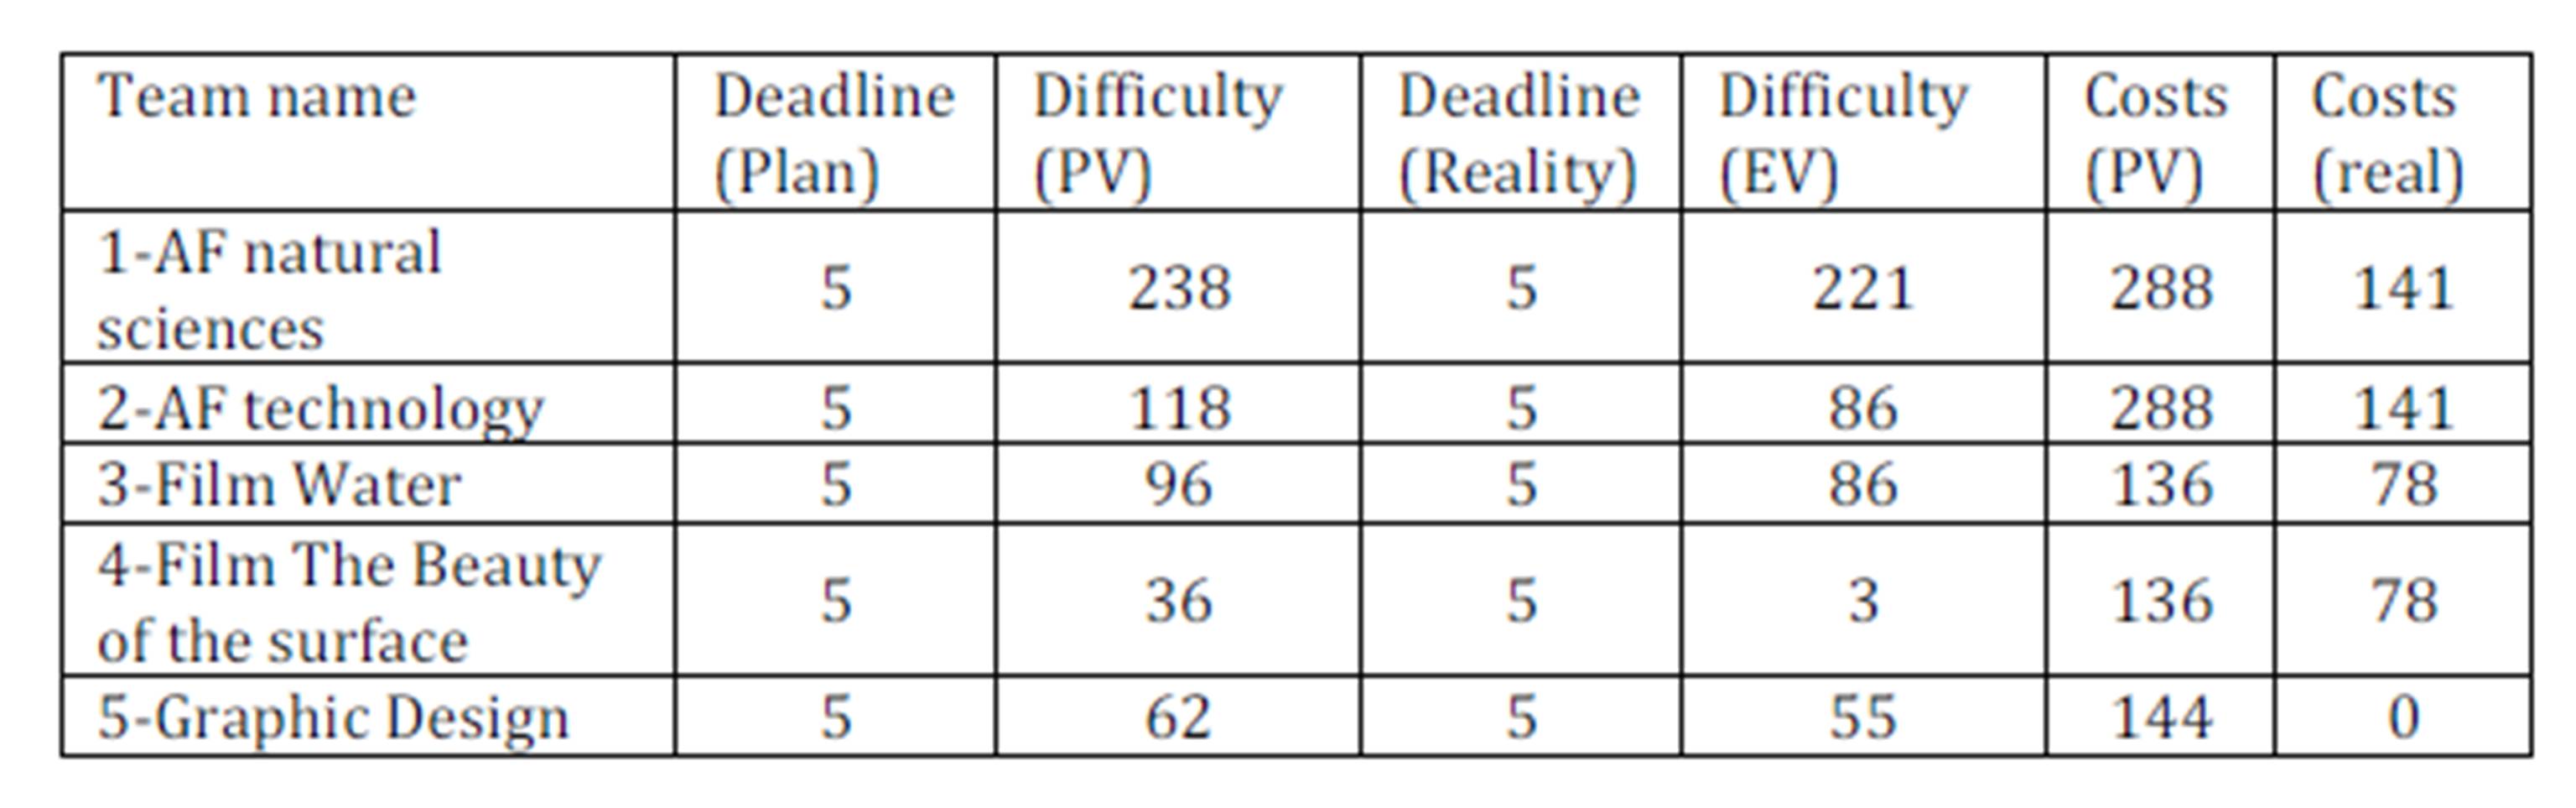
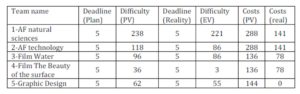
We have classified their planned difficulty and actual backlogs and completed the obtained data into the project model using the qualitative research. Every output defined by the project team is evaluated (given points) in the same way, while each output can be divided into more parts for detailed planning of the next stage of the project. This technique is modified by Ojha (2011). Each stage of the creative product has a planned (estimated) difficulty worth 5 points; the theme is worth 3 points, because we estimate that its preparation was a little less difficult. Chart 1 shows a sample of the registry, we have been able to prepare on the basis of the above described qualitative research. The PV abbreviation is a recognized abbreviation standing for the Planed Value indicator; EV abbreviation stands for Earned Value indicator according to the international standard PMBoK (2000).
Table 1: Sample of summarising data from the registry of products (Source: own calculation)
Results and Discussion
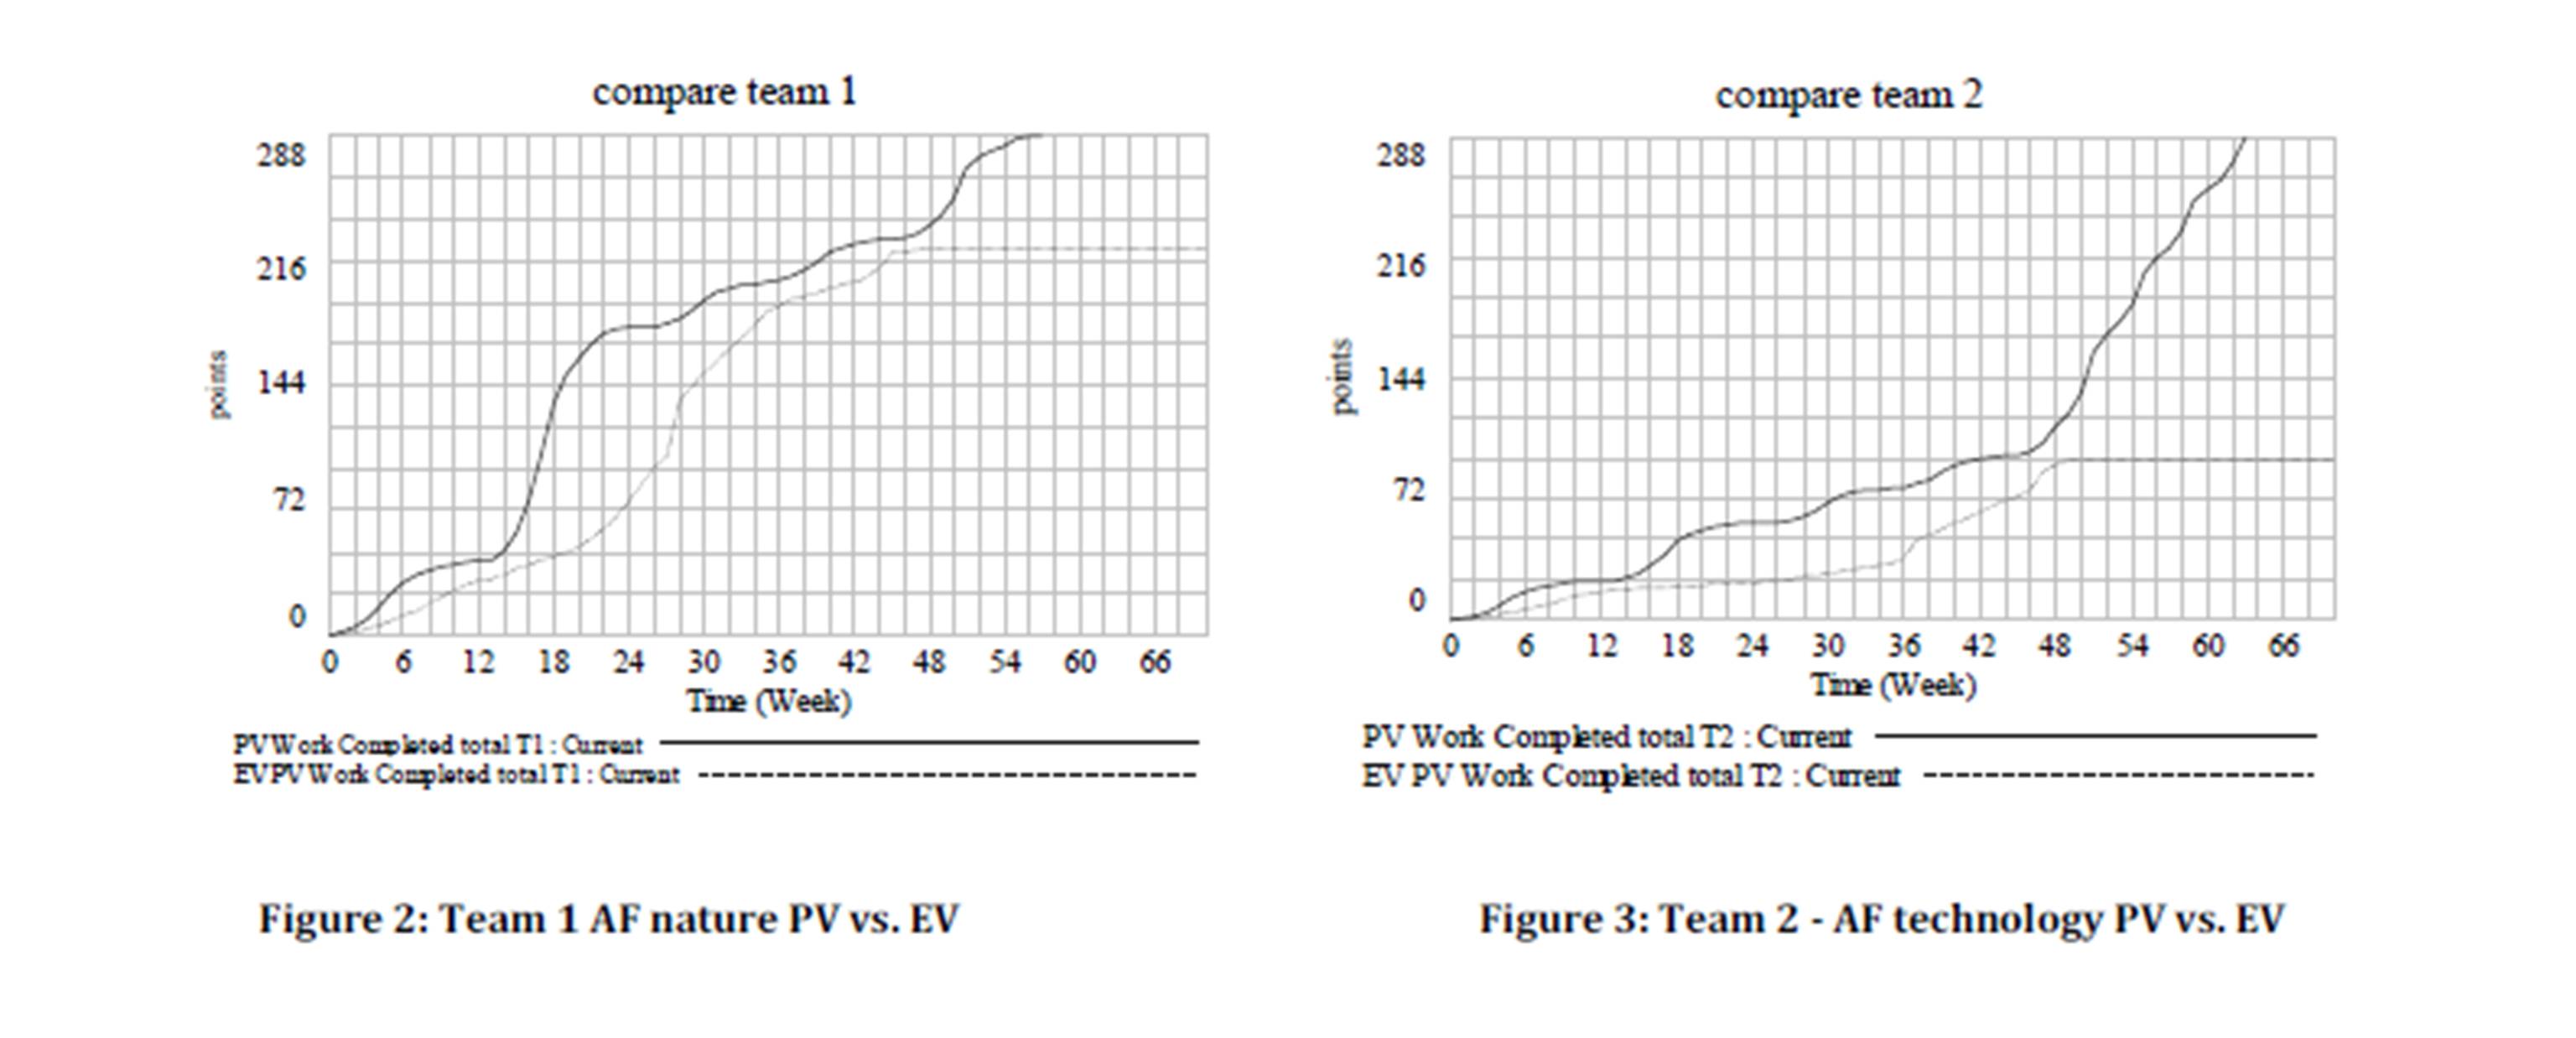
We transferred data collected within the qualitative research into numeric data and entered them into the prepared model. We used the charts, which form a model output, to indicate the planned Laboratory project development in its three monitored aspects: time, scope and costs. Given the fact the project team did not have data for monitoring the other three aspects that must always be managed (according to the PRINCE2 methodology), we did not create the modelled course of the project for the following aspects: the benefits, quality and risk. The project is scheduled for 9 stages as defined in within the chapter on qualitative research and their lengths are not identical. On the whole, the Laboratory project is scheduled for 62 weeks, whereas the charts below are processed for 70 weeks. 8 weeks are indicated in the graphical display as a reserve; this is the final stage of the project. At this time no completion of any creative product is planned and all products are scheduled to be delivered by the 9th stage at the latest. The project is on date of the actual status report for this article in the 48th week. See below images for sample project plan and its actual development according to the scale of the project by individual teams (Fig. 2, 3, 4, 5, 6). AF is the abbreviation for animated cartoons (Animated Films).
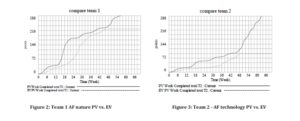

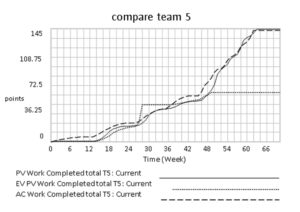
Figure 6: Team 5 – Graphic design PV vs. EV
(Source Fig. 2. — 6.: Own work)
The above charts indicate that the team 1 AF nature (animated cartoons with the naturalist theme) and the team 2-AF technology (animated cartoons with the technology themes) are scheduled to have the same difficulty of supply of creative products. Both teams shall deliver six animated cartoons. However, while the team 1-AF nature is currently (the 48th week) very close to meeting their deadline and only a small part of the delivery is left to be done, the team 2-AF technology has deviated more significantly from the original plan. However, its current role is not just about catching up with the time schedule. The steep curve of the production plan of this team from the 48th week is warning for members of the team 2-AF. They are about to complete more creative products in the last two weeks than they have done previously, i.e. during the previous 48 weeks. It is a big challenge for the team 2-AF technology, which requires the rapid increase of the work efficiency.
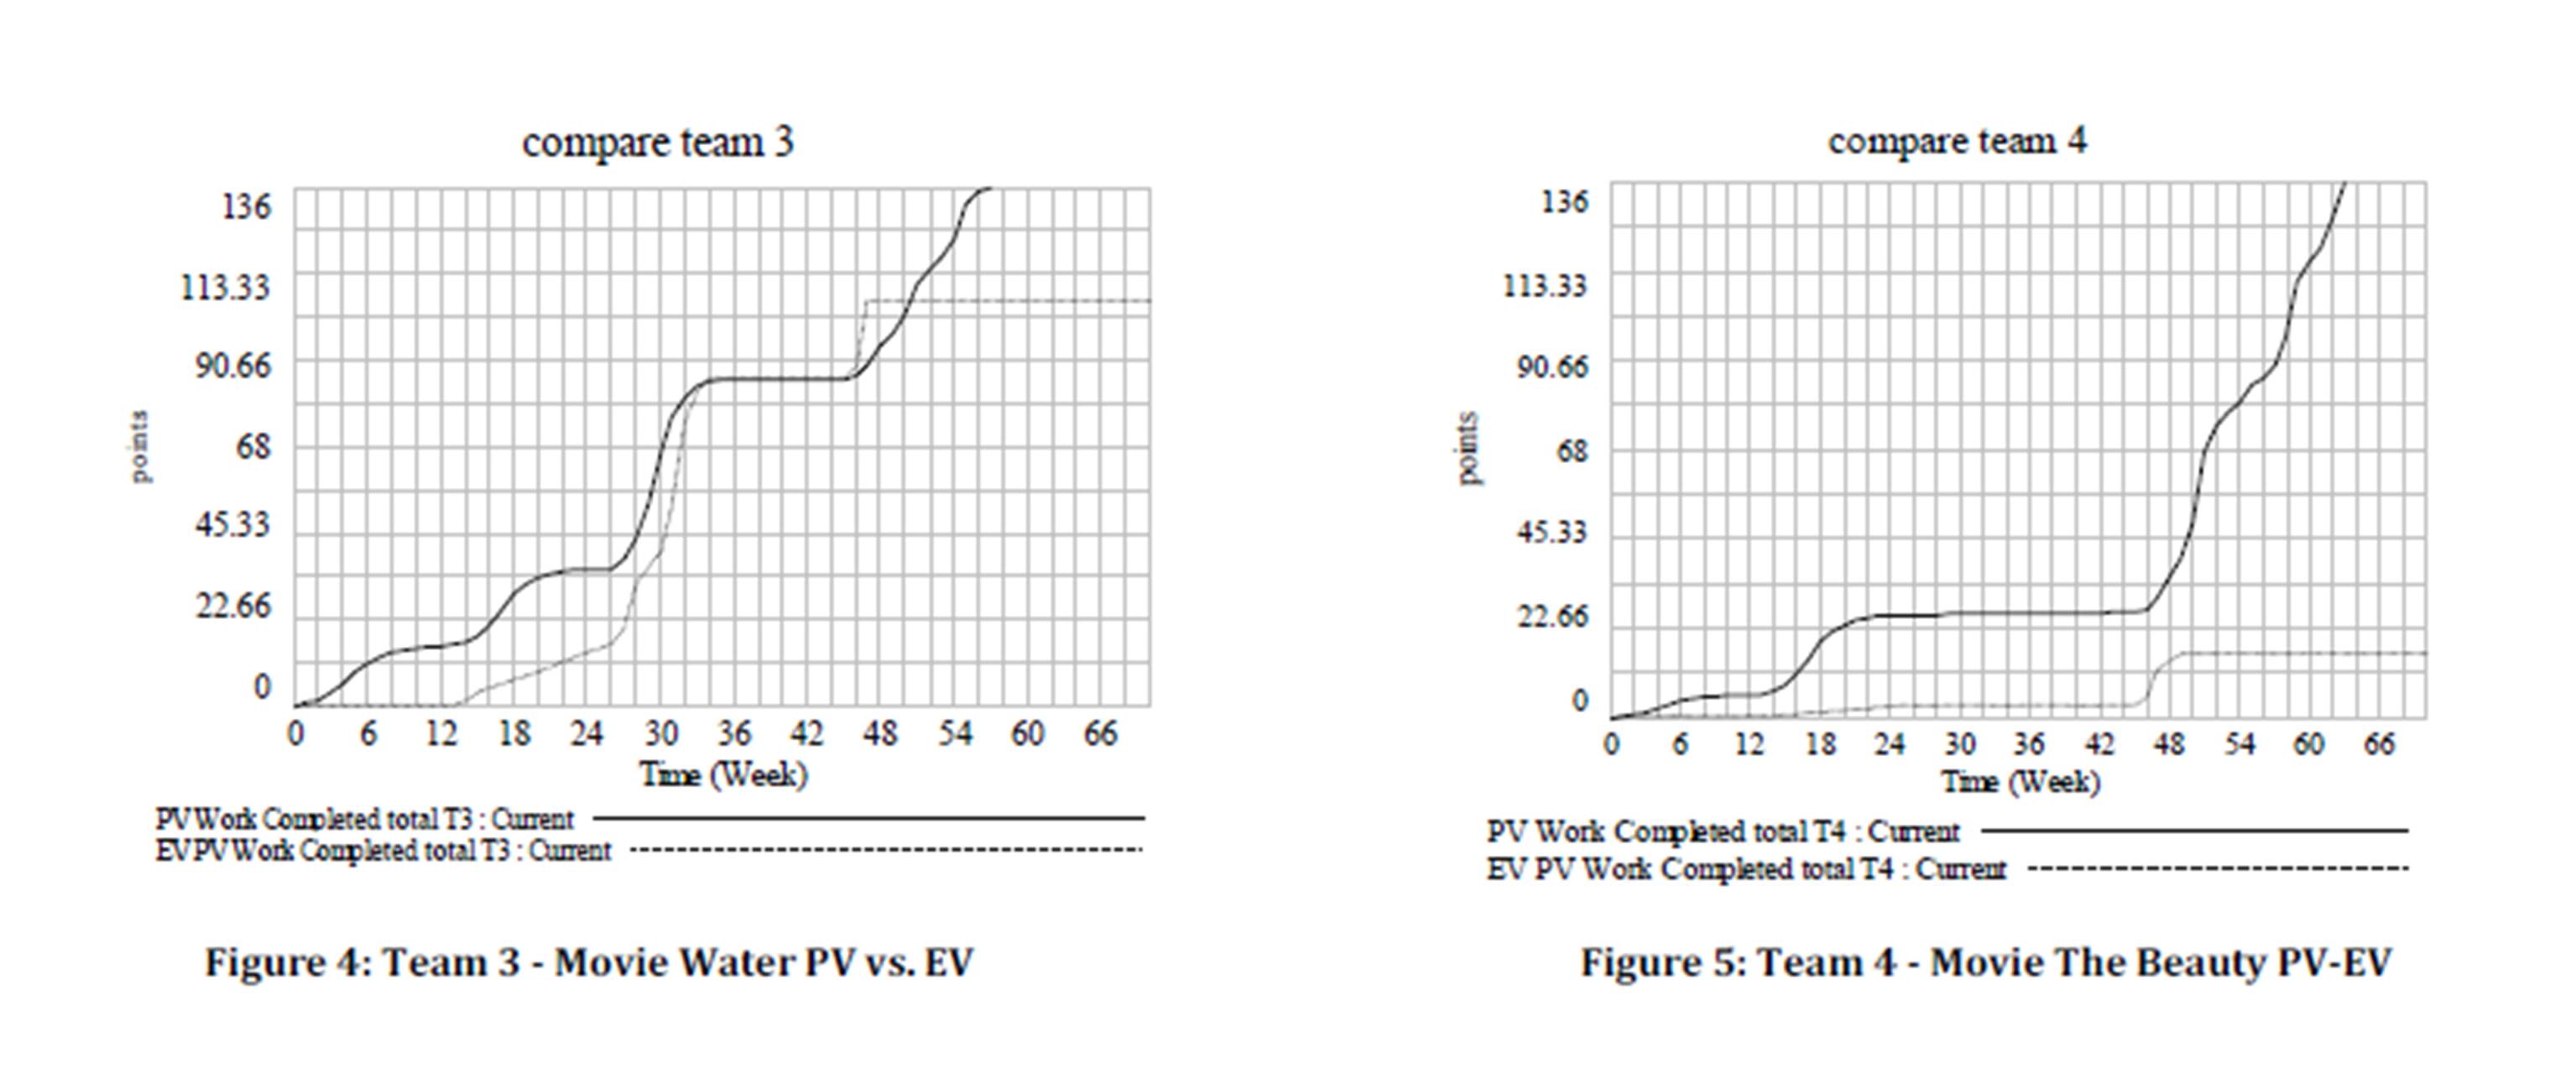
Another chart (Fig. 4) indicates that Team 3-Movie Water is even ahead of its time schedule. Due to the fact that this team has the same composition as Team 5-Movie Beauty of the surface according to the following chart (Fig. 5), this being ahead of the schedule is very important. While the movie with the theme of the natural sciences called Water (team 3-Movie Water) has been created according to the actual course up to the editing stage for the total of 48 weeks, the second movie with the theme of technical sciences called the Beauty of the surface (Team 4-Movie the Beauty of the surface) must be completed in half the time, i.e. within 14 weeks. Team 4-Movie the Beauty of the surface has been forced by the circumstances to work with the twice as high efficiency to meet the project commitment. It remains a question whether working at such a speed, the team will be able to comply with the quality. Due to the fact that the quality in this project is rather a subjective category as it is not defined anywhere in the project, it will be more about a feeling-based evaluation of the quality of the Beauty of the surface movie. We will comment on the quality of creative products later in this article.
Team 5-Graphic design is obliged to deliver a total of 4 textbooks, 4 teaching aids and 2 virtual textbooks. According to the chart, which is the output of the system dynamics model, Team 5-Graphic design has been meeting the deadline by the 48th week. It means that it had the planned a difficulty of delivering products of 61 points and it reached 59 points, which is within the tolerance, the graphic team manager can uphold as a negligible difference. However, the overall difficulty of the products of this Team 5-Graphic design is 145 points. This means that even in this case the team of graphic designers will have to increase their work intensity, which is also documented by the curve of the plan, which has been rising from the 48th week of the project. Team 5-Graphic design has the budget set for its work independently; therefore also the development of costs is displayed in the relevant way within this chart.
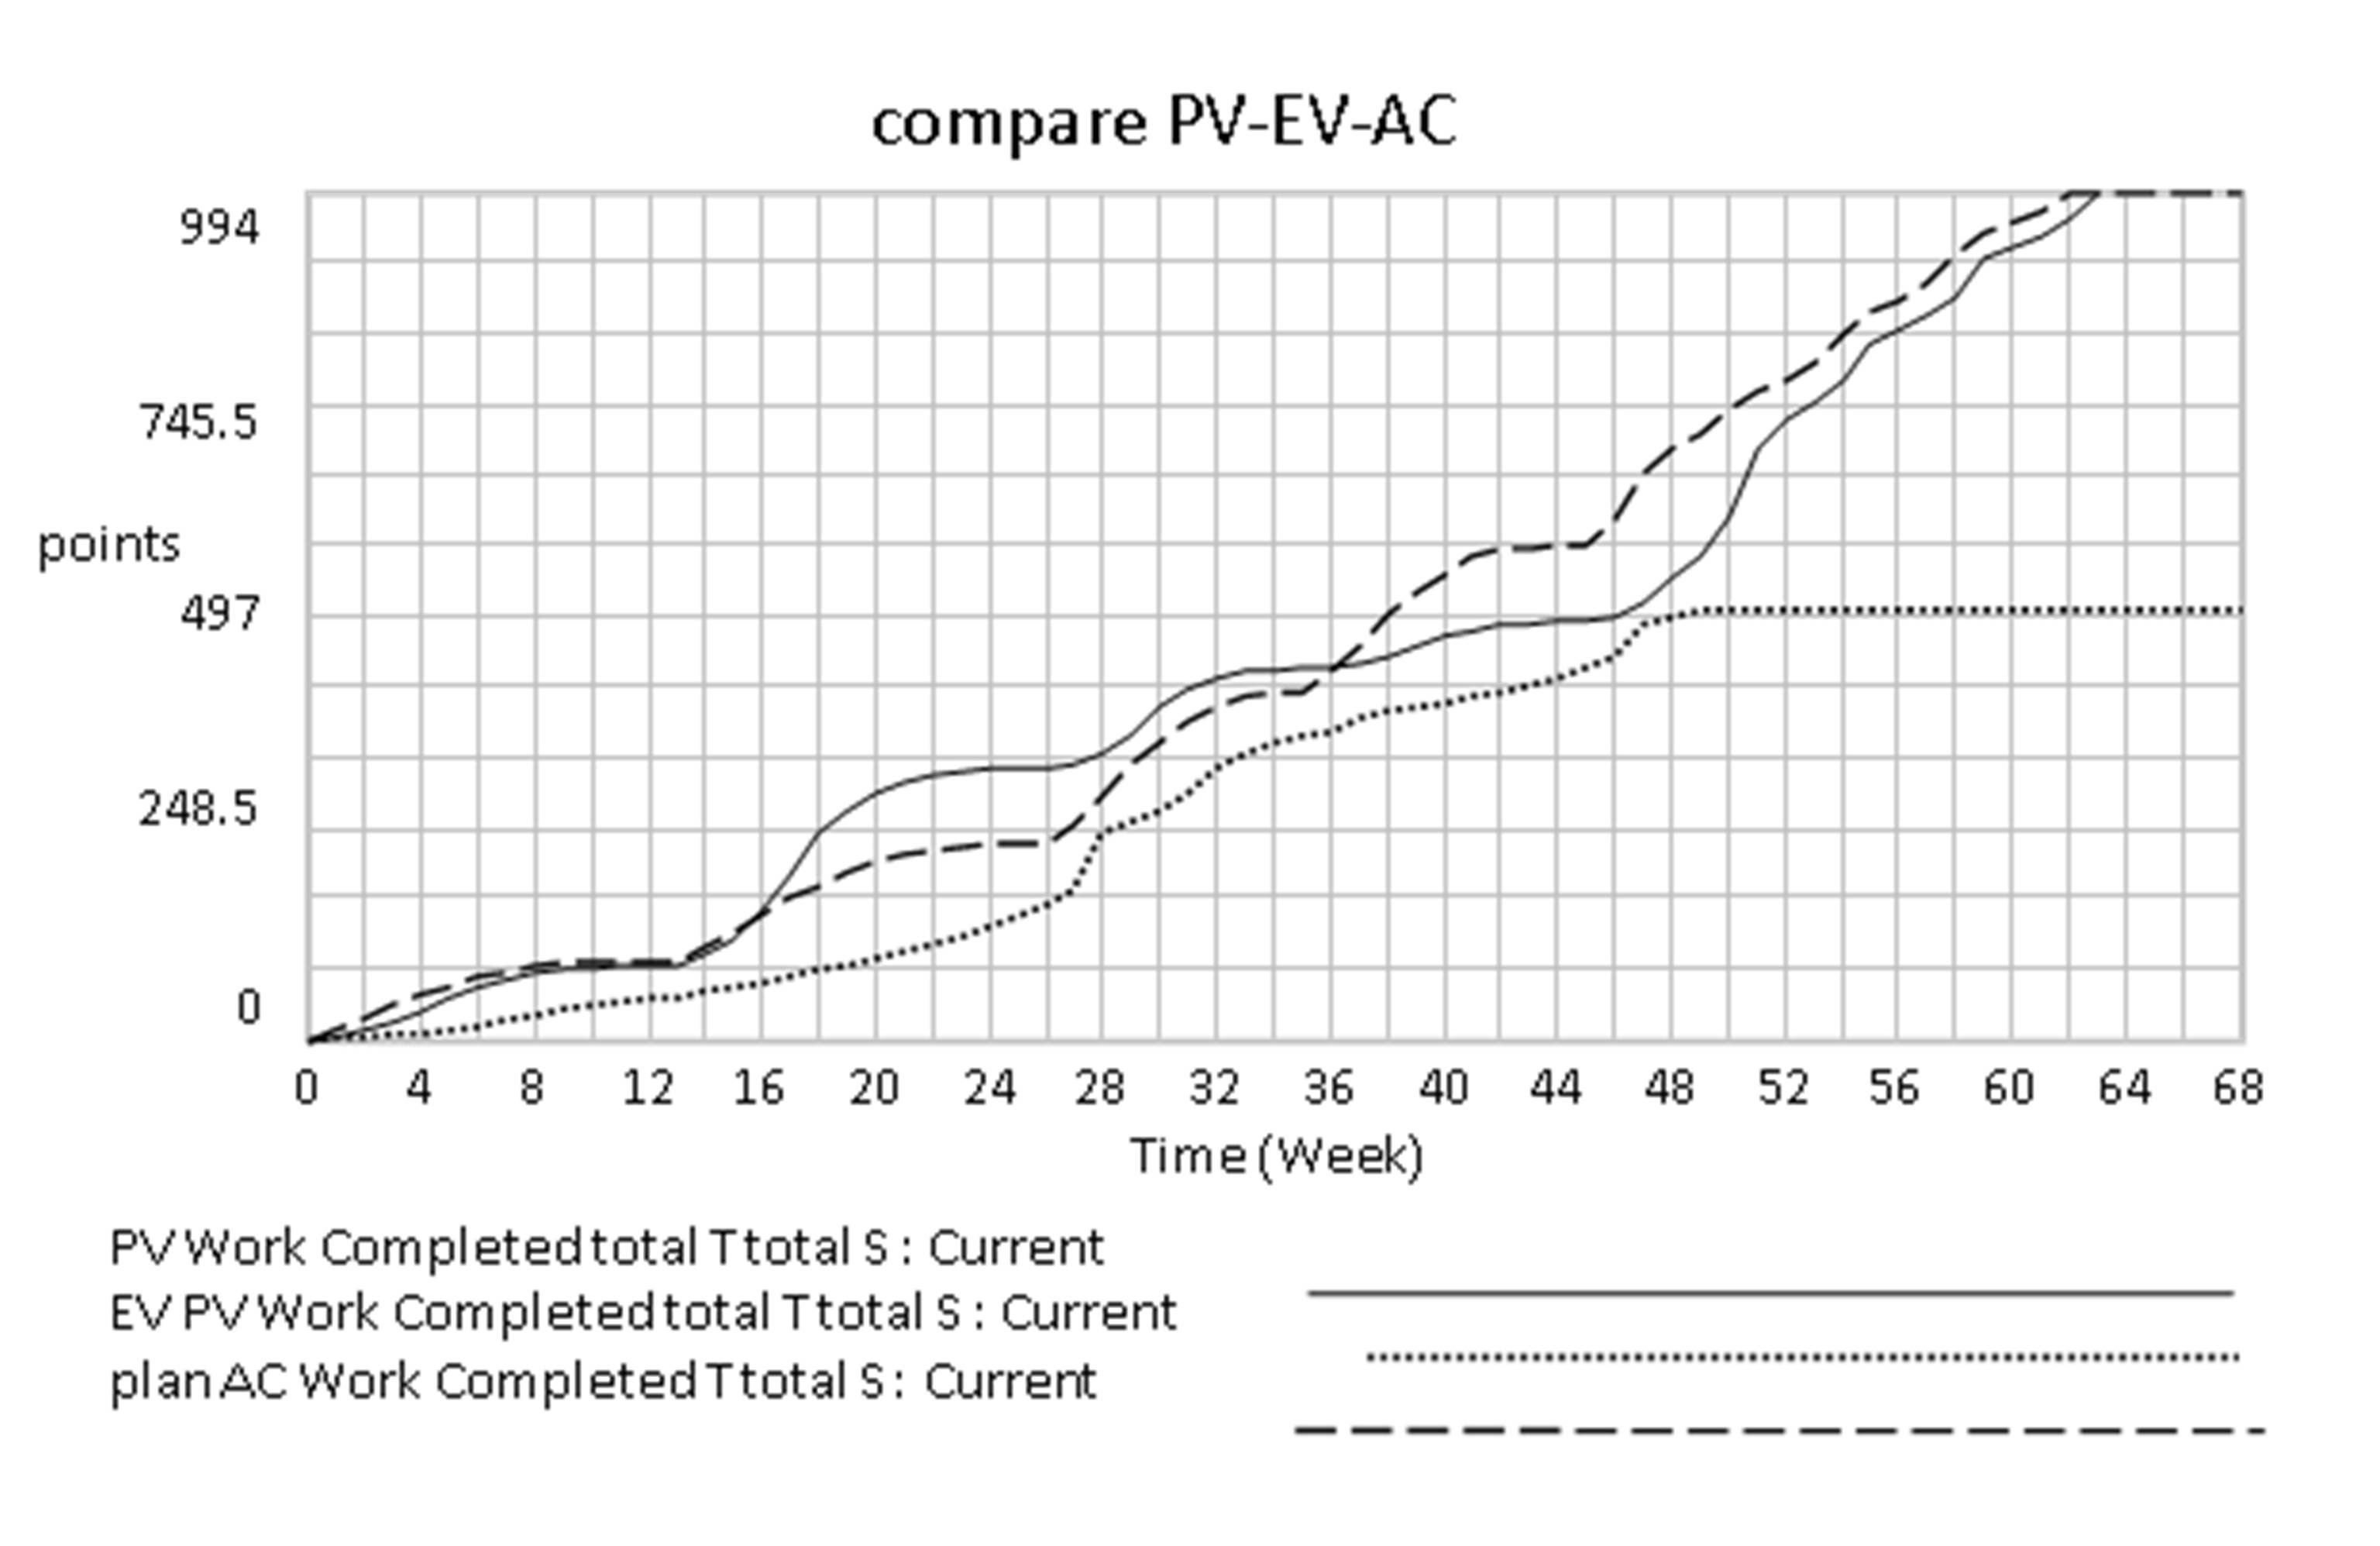
The next chart (Fig. 7) shows a general view of the development of all three aspects of the Laboratory project implementation in time. The chart indicates an obvious contradiction between the remuneration and the work actually performed by all team members. In the 48th week the total amount of works performed by the Laboratory project is not too behind the plan. From the 48th week to the end of the project only 14 weeks are left, during which a total of 36 products must be created, delivered and approved and the value of the remaining work is still 555 points. Therefore, during the remaining time, which is left by the end of the project more creative work remains to be done than it has been done during more than double the time that has already elapsed. Will the project team be able to increase efforts in order to comply with its obligations?

Figure 7: Laboratory Project in total, comparison of PV, EV and costs (AC)
(Source: own work)
Conclusion
We discussed the modelling results with the Laboratory project manager in a great detail. In particular, he has been interested in the structure, thanks to which we have been able to determine the numbers necessary for modelling. We had to be prepared for the fact that we would have to prove the meaningfulness and truthfulness of these data so that the model is not just a black box with impressive resulting charts.
In terms of understanding the effects of delays in the project, in particular Team 2-AF Technology, we evaluated the reason why the delay occurs. We revealed quite a logical cause, which, however, is not obvious at first sight, especially for the Laboratory project manager who is rather technically, not culturally or artistically oriented. Creativity of products brings certain specificity to the approach to the work in question. The creator of animated cartoon is not capable of working mentally on more than two films at the same time. If we force him to do so, he will be able neither to invent a good quality script nor to develop the storyboard, which helps creator describe the story and visualises the storyline. During the project the storyboard actually proved to be a key element for approving the quality of the submitted script by academics (scientists) from the Faculty of Technology. Having read the script (a literary work), they could not imagine any subsections of the prepared movie and they were not able to tell whether the literary script – as it was written — is in line with scientific findings of science and technology.
This means that even though quality was not mentioned in the project plan, it caused project delays. Scientists from the Faculty of Technology responsible for scientific aspects of the cartoons and feature films kept returning scenarios including the boarded animation to their creators at the moment they were not satisfied with the degree of scientific elaboration. This gave rise to extra load of work for the teams of animators and filmmakers, which meant a further delay in the project and postponing the preparation of new screenplays.
The Laboratory project manager welcomed the model and it was a useful novelty to him. The charts inspired him to try to predict the further development of the project so that he could estimate whether the obligations will be fulfilled and when. However, his conclusion was quite unpleasant for us. He let all sub-coordinators know that if any of the teams fails to deliver their work they were to be paid for, he will keep the salary for the last two months of the project. This decision concerned also us, creators of the model.
We have called on our culture creative workers in all creative teams to change their attitude. We requested a reduction in pressure for setting and meeting deadlines, which caused stress and thus further delay. We proposed that we ask creators every other week about their progress. We can further simulate this progress in the system dynamics model, thus reporting whether there the needed progress has been accomplished and whether this progress was sufficient. Questions aimed at our creative designers concerning the progress of the project and subsequent praise are, in our opinion, definitely more efficient than question asking when the next film will be delivered and whether we have met the deadline. This call is particularly important in a situation where creative people are unable to meet the deadline because of the extra work required due to inadequate quality interim products.
However, our request based on the system dynamics modelling and experience with the cultural creators working style has not been heard in practice. Nevertheless, we still believe that a proper approach of the project manager, in which he will manage the delivery of creative products, is not about the question when you deliver and/or whether you have already delivered the finished product, but about the question of what is holding you back and how we can help. It does not mean that the project manager should give up the project management or even that he loses track of the fulfilment of project objectives. On contrary, thanks to the system dynamics model he will maintain such an objective view of the fulfilment of the tasks in a project providing him with a better chance to complete the project successfully. A successful project that meets the expectations of the audience and adheres to the quality expected of creative products is an every manager´s dream. We may conclude by saying that the manager, despite his negative attitude to monitoring the project development, said that the simulation was valuable and understandable for his overview of the project.
Acknowledgements
We would like to thank all members of the Laboratory project team for their kind methodological assistance when defining meaningful stages of the project. The preparation of the article has been supported by the IGA TBU in Zlín grant, Creative project management: developing new research methods with the potential for practice.
References
1. Bačuvčík, R. (2012), Marketing kultury. Divadlo, koncerty, publikum, veřejnost. VeRBuM, Zlín.
2. Bertalanffy, L. (1976). General System theory: Foundations, Development, Applications, George Braziller, revised edition, New York.
3. Botek, M. (2013), ‘Quizzes as a Tool for Student’s Attendance and Participation’, Proceedings of 10th International Conference of Efficiency and Responsibility in Education 2013 (ERIE), ISBN: 978-80-213-2378-0. Jun 06—07, 2013, Praha, Czech Republic, 39-46.
4. Bureš, V. (2012), ‘A Process View on Product Management in Software Engineering Companies’, Journal of Software & Systems Development. [Online], [Retrieved March 1, 2015], http://www.ibimapublishing.com/journals/JSSD/2012/898139/898139.pdf
5. Cikánek, M., (2012). ‘Strategická příručka: Jak strategicky využívat evropské podpůrné programy.’ In: Institut umění — divadelní ústav. [online], [Retrieved March 31, 2015], http://www.idu.cz/media/document/strategicka-prirucka-kkp_final.pdf
6. Edgeman, RL and Eskildsen, JK. (2012), ‘The C4 Model of People-Centered Innovation: Culture, Consciousness, and Customer-Centric Co-Creation’, Journal of Innovation & Business Best Practice. [Online], [Retrieved March 1, 2015], http://www.ibimapublishing.com/journals/JIBBP/2012/932564/932564.pdf
7. Forrester, J W. (1994) ‘System dynamics, system thinking, and soft OR’ System Dynamics Review, 10 (2-3), 245-256.
Publisher – Google Scholar
8. Forrester, J W. (1961). Industrial dynamics. 2nd printing. Mass: Productivity Press, Cambridge.
9. Kloudová, J. et al (2010), Kreativní ekonomika: trendy, výzvy, příležitosti. Grada Publishing, Praha.
10. Kolerova, K., Bures, V. and Otcenaskova, T. (2014), ‘Usage of System Archetypes in Business Administration by Top-Managers’. Proceedings of the Vision 2020: Sustainable Growth, Economic Deevelopment, and Global Competitiveness, ISBN: 978-0-9860419-2-1. 13-14 May 2014, Valencia, Spain, 1734-1743.
11. Krátký J. (2013). ‘Projektové řízení v ÄŒR 2012: Zpráva o výsledcích šetření,’ Společnost pro projektové řízení CR. [Online], [Retrieved March 31, 2015] http://www.mbpconsulting.cz/upload/soubor/original/projektove-rizeni-v-cr-2012.pdf
12. Ojha, N. (2011). ‘Modern Project Management and Chaos Theory’. ICOQM-10. [Online], [Retrieved March 31, 2015], http://www.icmis.net/infoms/icoqm 10/ icoqm10cd/pdf/ p442-final.pdf
13. Pitaš, J. et al (2008). ‘Národní standard kompetencí projektového řízení: National competence baseline of project management.’ Brno: VUT v Brně, Brno.
14. PMBoK, 2000. A Guide to the Project Management Body of Knowledge: PMBOK guide. Project Management Institute, Penn: Newtown Square, USA.
15. PRINCE2, 2009. Best Management Practice: Managing successful projects with PRINCE2, 2009. 5th ed, TSO, London.
16. Steiger, T. and Lipmann, E D. (2012). Psychologie pro manažery: jak ovládnout umění vést. 1st ed. BizBooks, Brno.
17. Senge, P M. (2006). The Fifth Discipline. The art and Practice of the Learning Organization. Doubleday/Currency, New York.
18. Svirakova, E. 2014. Kreativní projektový management. 1st ed. VeRBuM, Zlín.
19. Vojtko, V. and Hesková, M. (2010), ‘Constructivist Use of Business Simulators in Education, Communications of the IBIMA. [Online], [Retrieved April 1, 2015], http://www.ibimapublishing.com/journals/CIBIMA/2010/366397/366397.pdf
20. Žáková, E. (2010). Kulturní a kreativní průmysly v kulturní politice Evropské unie. In: Institut umění — divadelní ústav [online], [Retrieved March 1, 2015] http://www.idu.cz/media/document/2-priloha-c.-2-studie-kulturni-a-kreativni-prumysly-v-kulturni-politice-eu.pdf.