JEL Codes: C38, I23, L15, and M19
Introduction
The technology revolution through the computerized environment has shifted the industrial society to the information one (Dabas, 2008). One of the influenced societies is the academic institutions. The information society enforces the academic institutions to play a vast role in which the academic institution’s main responsibility is to prepare the other societies to be ready and conversant with the new era. Therefore, it cannot be denied that higher-education institutions become the key player to produce excellence quality students or to produce high quality of soft skill people. Thus, these people are able to become the key and viable assets to deal with fiercely nations’ competition environment. To achieve that vision, higher-education institutions (HEIs) have defined their programs and targets according to the nation’s vision, such as defining the future target to be Apex University or Research University. At the same time, many HEIs are also required by their Higher Education Ministries to achieve a certain level of earned soft skills for its students. Consequently, those higher-education institutions engage in some types of evaluation to depict their quality. One of the major components in pursuing the organizational quality is customer satisfaction. As one of the main contributors in supporting the parent organization’s performance, library services must be a part of this evaluation. It is because library services were also recognized as a nerve centre of all systems of education (Arora, 2008).
There is no longer a short cut to achieve quality, and it is also not an overnight sensation. However, in order to achieve it, the organization must have a good planning. They need what to say, do, and prove it. One of the guidelines to prove it is by implementation of quality management (QM) practices, such as ISO 9000. It has been developed as the result of intense global competition since 1987 (IQCS Certification Quality Science Universal No. 2206/2003). The importance of QM practices and organization quality has been highlighted in many studies.
In many Southeast Asian countries’ perspective, the application of Quality Management System (QMS) ISO 9000 is a strongly encourage to every higher institution as well as to the library itself. For example, this embarking was done by the introduction of the Development and Administration Circular by the Malaysian Government in 1996 (Jabatan Perkhidmatan Awam, 1996). This circular enforces all government agencies to implement the MS ISO 9000 quality system in their organization as a tool to ensure the delivery of quality services to customers is excellence. In addition, the government has also set certain rules and standards how to measure the higher institution. However, this internal assessment tends to focus on the direct effect of academic institution within units and there is no specific assessment guideline on how to measure academic library services. By emphasizing on this particular environment, the study aims to develop and verify the new instrument to evaluate the university’s library services that comply with ISO 9000 standard requirements and practices. This study gains more attentions as in many previous empirical studies showed that many people first looked into the library in forming an opinion of the overall quality of a university (Brophy, 2005; Ling-Feng Hsieh, Jiung-Bin Chin & Wu, 2004).
As an organization, library has both internal customer as well as external customers, which are supposedly served well to meet their satisfaction. These customers are the colleagues who are working together for producing and providing a service or product to their further process’ clients. Meanwhile, an external customer, by definition is a person, might be represented as an individual or as an enterprise that uses the service or product from another person or organization or as a person who has been continuing the process from the previous one. However, the existence of any organization depends on the existence of its exterior customers. That is why external customer satisfaction recognized as the most important likely, as well as becomes the most frequent target of customer’s satisfaction measurement programs. Furthermore, according to Jones (2002), the new standard of ISO 9000, organizations that are looking for answers to their products definition, service and marketing questions need to look on their customer’s needs. Eventually, identification of external customer is an important activity of the ISO 9000 quality management system. According to Hernon (1999), peers or rankings on the basis tangible criteria, such as library collections can rate the quality of library.
To determine whether a library is providing a good service has occupied the attention of practitioners and researchers for many years, and it cannot be disassociated with the measurement of customer satisfaction. An analysis of customer satisfaction is important as the expectations of academic library customers’ rise, as the number and diversity of library competitors grow, and as change-related to an independent of the electronic information environment continues to have a profound impact on service delivery and use (Hernon, 1999). Thus, the library user surveys have become widespread, especially in the university libraries during the past twenty years. A substantial body of literature has been developed on surveys and service quality, led by studies and reviews from such library educators/professionals Van House, Weil and McClure (1990), Hernon and Altman (2000), Nitecki and Franklin (1999).
Based on those facts and raison d’être to be survived by servicing the best to its customers, it is important to find valid constructs of academic library user satisfaction that can be used as a standard model of customer satisfaction measurement. The result of this effort will contribute to the quest of many organizations’ search of what customer wants, how much and how often they use the product or service, and how satisfy are they.
Literature Review
The ISO 9000 family of quality management standards have been accepted worldwide as a baseline for organizational performance since their first release in 1987 (Jones, 2002). It is a set of international quality management standards and guidelines. It assists an organization in developing, implementing, registering, and sustaining an appropriate quality management system that functions independent of the specific product and/or service (Westcott, 2006). The primary concern of ISO 9000 is “quality assurance,” which refers to what an organization does to ensure compliance of its product and service that is consistent with the customer’s requirements (Feng, Terziovski, & Samson, 2008). According to the new ISO 9000:2000 standard, companies looking for answers to their product definition, service, and marketing questions need to look at no further than their customers (Jones, 2002).
According to Department of Standard Malaysia from the total of 4638 organizations certified with QMS-MS ISO 9001, approximately 204 of them are from education organization (Department of Standard Malaysia, 2009). Therefore, research on effectiveness of ISO 9000 in the education sector, especially in the library became an active research. However, there is a lack of empirical study to investigate an effectiveness of ISO 9000 toward customer satisfaction in reflect to ISO requirements.
In the new version of ISO 9000, under the clause 7.2, the standards specifically cover the ‘customer-related product process’, which is related to some important aspects, such as the identification of customer requirements where the organization shall establish a process for identifying customer requirements. It also covers the review of customer requirements where the organization shall review it before committing to supplying a product/service to the customer, and customer communication where the organization shall implement arrangements for communicating with customers. In another clause (clause 8.2 — measurement and monitoring) three sub-clauses were defined that, firstly, the organization shall monitor information on customer satisfaction/dissatisfaction. Secondly, the organization shall analyze applicable data to provide information on customer satisfaction/dissatisfaction. Thirdly, the organization shall analyze relevant data to provide information on conformance to customer requirements.
Zeithaml and Bitner (2000) defined satisfaction as the customers’ evaluation of a product or service in terms of whether product or service has met their needs and expectations. Failure to meet needs and expectations is assumed to result in dissatisfaction. Therefore, customer satisfaction is not an objective statistic, but more of a feeling or attitude. Thus measuring customer satisfaction is an artistic or skill. Meanwhile, Viggo and Michael (2004) mentioned that customer satisfaction had been a popular topic in marketing for more than 30 years but without the emergence of a consensual definition of the concept.
According to Oliver (1997), conceptually, satisfaction is an outcome of purchase and use resulting from the buyer’s comparison of the rewards and costs of the purchase in relation to the anticipated consequences. Meanwhile operationally, satisfaction is similar to attitude in that it can be assessed as the sum of the satisfactions with the various attributes of the product. Oliver himself has defined satisfaction as the consumer’s fulfillment response, it is a judgment that a product or service feature, or the product or service itself, provided (or is providing) a pleasurable level of consumption-related fulfillment, including levels of under or over fulfillment.
Since the early 1970s, the volume of customer satisfaction research has been impressive (Churchill & Surprenant, 1982). Thus reviewing the previous literatures, the readers would find abundant and very vast articles reporting the customer satisfaction studies. Even though, most of the articles were only concerned with making management feel good about the scores they are earning from year to year (Pruden, 1997).
Therefore, numerous theoretical structures have been proposed to examine the most antecedents of satisfaction as well as to develop the meaningful of the constructs. The vast majority of these studies used some variant of the disconfirmation paradigm which holds that satisfaction is related to the size and direction of the said experience. Meanwhile, disconfirmation itself is related to the person’s initial expectation, i.e., firstly, confirmed when a product performs as projected, secondly, negatively disconfirmed when the products perform more poorly than estimated, and thirdly, positively disconfirmed when the product performs better than expected. Dissatisfaction results when a subject’s expectations are disapprovingly disconfirmed.
Bitner and Hubert (1994) used four items to measure the customers’ overall satisfaction with the service provider, and they were introduced the concept of encounter satisfaction and devised a nine-item scale to measure the same (i.e. the customers’ satisfaction with a discrete service encounter). Meanwhile, Cronin and Taylor (1992) have measured customer satisfaction as a one-item scale to measure the customers’ all-inclusive feeling towards an organization. Other works have emphasized the multi-faceted nature of customer satisfaction and have used multiple item scales to measure customer satisfaction (Oliver, 1997; Surprenent & Solomon, 1987; Westbrook, 1981). In a recent effort, Sureshchandar, Rajendran and Anantharam (2002) have postulated that customer satisfaction comprises of the following five factors, i.e., firstly, core service or service product, secondly, human element of service delivery, thirdly, systematization of service delivery, fourthly, non-human element, tangibles of service — services capes and finally, social responsibility.
Methodology and Model
The library user surveys have often been used as a tool to assess service quality and user satisfaction. In general, the previous literatures revealed that multiple methods had been used to measure the library user’s satisfaction. For example, the work of Baggs and Kleiner (1996) has proposed various measurements, such as Disconfirmation Model, SERVQUAL, SERVPERF, and direct investigation. The SERVQUAL instrument has been covered by Nitecki (1995, 1996), and Cook and Heath (2000), White (1998). An application of the LIBQUAL instrument has been covered by Davis, Groves and Kyrillidou (2006), Hitchingham and Kenney (2002), Thompson, Cook and Heath (2003), Dole (2002). And an application of SERPERF has been covered by Roslah and Zainab (2007).
According to Hiller (2001), a rapid change in library services and operations, demands for internal institutional accountability, and assessment expectations by external accrediting agencies have contributed to further development and application of user surveys within academic libraries during the past decade. User surveys can be designed and administered in a number of ways. Self-administered surveys are often employed to reach a large number of potential respondents with a minimum of direct contact and cost. Individuals are given or sent surveys to complete and return, and the responses turned into data that can be analysed. Surveys can range from broad and comprehensive to those narrowly focused on specific services or activities. When properly designed and administered, user surveys can provide both quantitative and qualitative data directly from the target population. This method might be considered as direct investigation as classified by Baggs and Kleiner (1996).
Wilson (2002) argued that even the study of customer satisfaction measurement had been dramatically grown over the past 20 years; there might also be weaknesses in the measurement. The author added that the satisfaction’s scores might vary according to specific circumstances as well. It should also be noted that satisfaction measurement is not a standardized process. It requires that the scales that are used to collect data are varied. It asks that the format of questions is varied and the data collection methods (self-completion, telephone, personal interview) are varied too. Therefore, generalizing about the value of customer satisfaction measurement is often very difficult. However, despite the lack of standardization, most measurement procedures tend to share one common characteristic.
Shi, Holahan and Peter (2004) proposed that satisfaction for library users is a function of multiple sources – the customer’s satisfaction with the information product(s) received as well as satisfaction with the information system and library services utilized to obtain the information product. Nagata, Satoh, Gerrard and Kytomaki (2004) stressed that even though the customer/user could judge quality, but on what criteria he/she judges it, or which aspect he/she values has not been made clear.
Meanwhile, Poll and Boekhorts (2007) have highlighted that the other issues, which are relevance to measuring library quality, are cost-effectiveness, library as working place and meeting point, library’s teaching role, library’s functions for external users and the importance of staff. This paper also tried to encounter the issue that was highlighted by Hiller (2001), Wilson, Tufo and Norman (2007), Shi Holahan and Peter (2004), Poll and Boekhorts (2007). Therefore, this paper aims to explore some of the assertions made in the literature by examining how satisfaction surveys are being used in practice relative to other measurement tools, and in particular, to evaluate the worth and future role of satisfaction surveys in the eyes of practitioners. However, the difference is this study explored the dimensions that related to QMS characteristics.
This study explores five (5) constructs of the library users’ satisfaction proposed variable from the selected academic libraries in Malaysia. The research methodology employed is a mail survey and to enable respondents to indicate their answers, seven-point ordinal scales were used for the questionnaire. We used the list of the higher-education directory of Malaysia to choose randomly the sample libraries. The libraries were scattered around the country. The study received three thousand nine hundred and twenty five (3925) useable responses and analysed the data by using the SPSS package.
In general, according to Juran (1992), customer satisfaction is a result achieved when service or product features respond to customer needs and when the company meets or exceeds customers’ expectation over the lifetime of product or service. In the library, the information comes from a variety of sources such as library staff, library material, library facilities, etc. Shi, Holahan and Peter (2004) argued that information was investigated as a consumable product.
In this study, customer satisfaction is understood as overall constructs conceptualized on the cumulative level. This implies that customers’ satisfaction in this context is operationalized as post-use judgement that library users experience of using library information. That can be ranged from dissatisfied to satisfied scale. Thus, the ALUS was developed and used to access customer satisfaction in the academic library. It consists of five dimensional – DIM1 (Quality of Library Staff), DIM2 (Quality of Electronic Services), DIM3 (Service Suitability), DIM4 (Psychical Facilities Availability and DIM5 (Services Accessibility). The levels of satisfactions are measured as seven-point scales (1 = very satisfied, 7 = very dissatisfied) for each of the seven dimensions of satisfaction variables.
This study used four preliminary analyses. Firstly, it is the frequency distribution. The main purpose of this analysis is to justify the data deviation for non-normality. Thus, items from ALUS were assessed. Among of the particulars’ point being considered are skewness and kurtosis. This step is very important because, Hoyle (1995) assumed that the χ2goodness-of-fit statistics are not likely to be inflated if the skewness and kurtosis for individual items do not exceed the critical values of 2.0 and 7.0, respectively. Second, the reliability of the sub scales of the ALUS was assessed using Cronbach’s alpha (α) as an indicator of internal consistency. As a rule thumb, a value for α of .70 is considered sufficiently (Nunnally, 1978). Thirdly, mean levels of customer satisfaction were computed across the public and private academic library. Lastly, the structural equation model program implemented on AMOS version 4.0 was used to assess the factor structure or loading or regression weight of the ALUS, using maximum likelihood method.
To test the model, we compared the developed model with the null model. The null model is a model in which all the correlations or co-variances is zero, or it is as the “Independence Model” in AMOS (Kenny, 2003). In other words, null model is in which all constructs were hypothesized to be uncorrelated and measured without error, served as a basis for model comparison. The study used the four fit indices, i.e., firstly, the discrepancy functions — such as Chi-square test and RMSEA. Secondly, the study employed the tests that were to compare the model and independence model — such as CFI, NFI, TFI and IFI. Thirdly, the study searched for the information of theory goodness — such as AIC, BCC, BIC and CAIC. Finally, the study used the non-centrality test — such as NCP.
One of the criteria is being used to analyze the model is the Chi-Square. If the Chi-square (in AMOS refer to CMIN value) is not significant, the model is regarded as acceptable. RMSEA represents by the square root of the average or mean of the covariance residuals. Zero values are the perfect fit, and the maximum is unlimited. Browne and Cudeck (1989) proposed RMSEA should less than 0.08, Stieger (2000) suggested below 0.05, and Hu and Bentler (1999) suggested the value should not exceed 0.08. The Normed Fit Index (NFI) and the Non-Normed Fix Index (NNFI) are used to assess the global model fit. The NFI represents the point at which the model being evaluated falls on a scale running from a null model to perfect fit. This index is in Normed, which is expected to fall on a 0 to one continuum. It is suggested by (Marcoulides & Schumacker, 1996) that these indices are relatively the incentive to sample size. In addition, the NNFI considers model parsimony. A model is regarded as acceptable if NFI exceeds 0.90 (Byrne, 1994) or 0.95 (Schumacker and Lomax, 2004).
Findings and Discussion
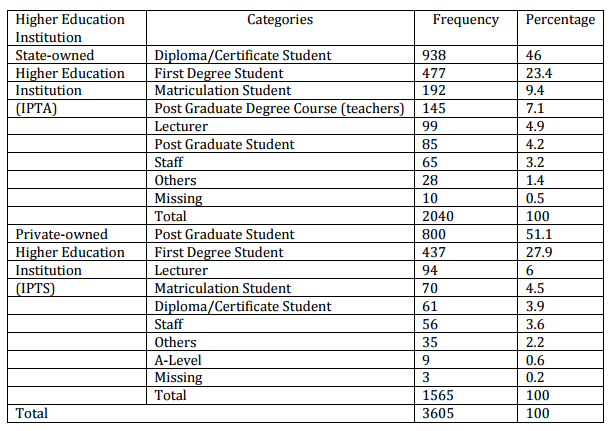
For normality testing, all cases (3927) were processed. In first screening, it deleted 50 cases, i.e. four cases because of incomplete information and 46 cases because of not comply with research target population (never use the library for the past six month). The following screening found that 253 were invalid data due to missing value. After passing those screening, an exploratory factor analysis was conducted (from 3824 data). From this step, nineteen (19) cases were deleted and finally, the valid data were equal to 3605. The skewness and kurtosis have been tested to check the normality. The result shown than the maximum value is 1.9 and the minimum is 1.35. These values showed that the data was in normal distribution.
Table 1: Demography
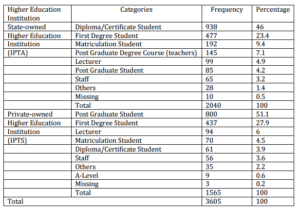
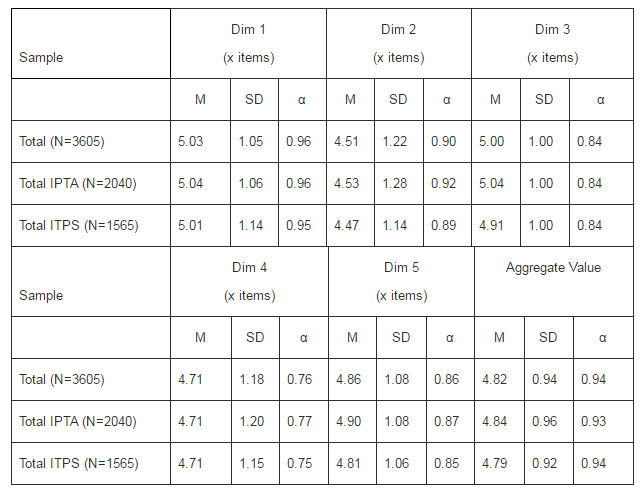
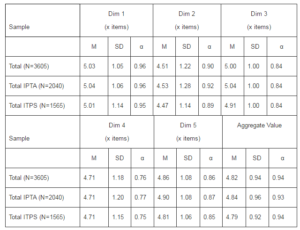
Table 2 provides overall results for mean values, standard deviations and internal consistencies (Cronbach’s alpha) for the total and as well as for a subgroup (IPTA-public and IPTS-private owned universities) sample of ALUS model. For the comprehensive dimensions, Cronbach’s alpha is 0.94, which indicates high largely internal consistency 26 items representing the customers’ satisfaction factor. The Dim1, Dim2, Dim3, Dim4, and Dim5 are sufficiently internally consistent because Cronbach’s alpha meets the criterion of 0.70 value. The values for the total sample are 0.96, 0.90, 0.84, 0.76, and 0.86 respectively. Meanwhile, the values for the subgroup (IPTA and IPTS) almost same, except for Dim3 with slightly difference (IPTA=0.92, IPTS=0.89).
Table 2: Means (M), Standard Deviation (SD), and Internal Consistencies (Cronbach’s α) of ALUS
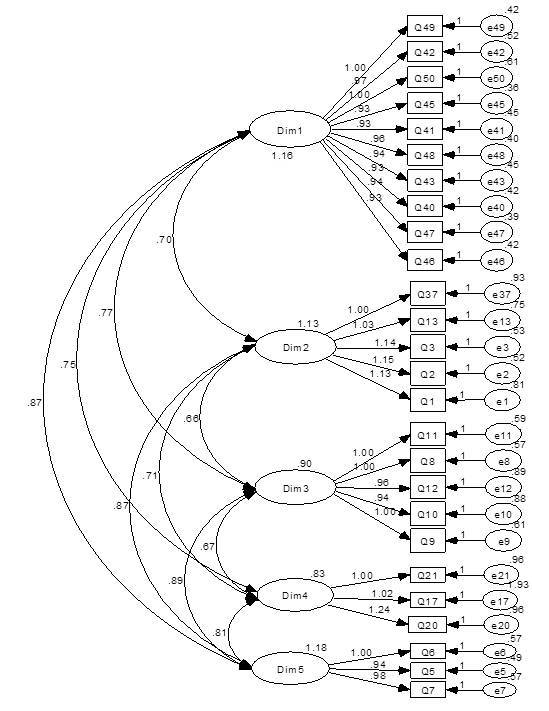
Prior to evaluate the fitting model, we defined a measurement model to verify that the 26 measurement variables are reflecting to five unobserved construct (Dim1, Dim2, Dim3, Dim4 and Dim5). To define the three measurements, i.e. the degree of model-fit, the adequacy of the factor loadings, and the standardized residuals and explained variances for the measurement of the said 26 items, we used the confirmatory factor analysis (CFA). All factors were set for a freed loading (i.e. estimated). It means that the items are allowed to load on only one construct (i.e. no cross loading), and the latent constructs (five items) were allowed to correlate (equivalent to oblique rotation in exploratory factor analysis).
The result for a basic output from AMOS that the input covariance matrix generated from the model’s 26 measurement variables contains some important information. It had 351 numbers of distinct sample moments (351 pieces of information), 21 regression weights, 10 co-variances, and 31 variances for the total of 62 parameters [p(p+1)/2] to be estimated.
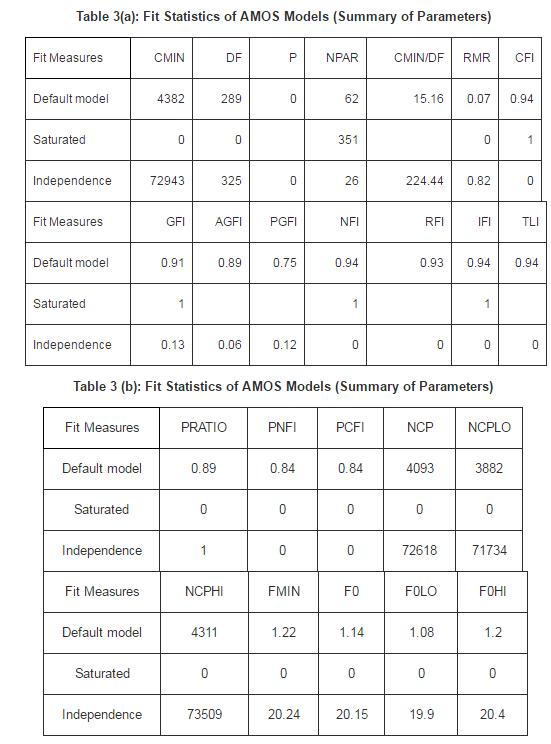
The following tables [Tables 3(a), 3(b), 3(c) and 3(d)] are taken directly from AMOS output. Each table showed three models. First, it is the default model (the hypothesized model). Second, there is the saturated model (is an extreme model), where in which the number of estimated parameters equals the number of data points, i.e. variances and co-variances of the observed variables, as in the case of the just-identified model) and the least constricted. Finally, it is the independence model that it is one of a complete independence of all variables in the model, in which all correlations among variables are zero, and it is the most restricted.
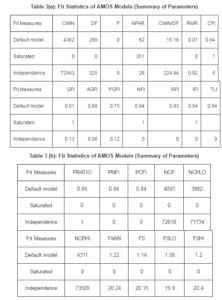
A model has 289 degrees of the freedom (351 — 62), and Chi-square goodness-of-fit statistics showed that the model did not fit the data well, in which χ2 is 15.16 (N=3605, df = 289). For the overall, the study shows that the hypothesized model is a recursive type (i.e. a full latent variables model that specifies the direction of the cause from one direction only) with the sample size is 3605. Both GFI and AGFI range from zero to 1.00, but values close to 1.00 or more than .9, which is considered as a good indicator (Kelloway, 1998). Based on the table, GFI (0.91) and AGFI (0.89), we conclude that the hypothesized model fit the sample size very excellence. PGFI (parsimony goodness-of-fit index), introduced by James, Mulaik, and Brett (1982), addressed the issue of parsimony in SEM. Typically, the values of PGFI lower than the threshold level are accepted generally, but the values above 0.90 and more are better (Kelloway, 1998). The study’s PGFI value for the hypothesized model is 0.75, considerably accepted.
For incremental or comparative indices of fit, we compared the hypothesized model against some standard, as represents at the baseline model (typically the independence or null model). NFI (Normed Fit Index) and CFI (Comparative Fit Index) range from zero to 1.00 and values above 0.90 considered a good fit model. As shown in the table, both NFI (0.904) and CFI (0.94) indicated that the hypothesized model was well fitting. The related measure of NFI is RFI. It represents a derivative of the NFI, and the RFI coefficient values are also ranged from zero to 1.00. Values above 0.95 are considered a good fitting model (Hu and Bentler, 1999). This study indicated the RFI value is 0.93. The IFI (incremental index of fit) will address the issues of parsimony and sample size, which were known to be associated with the NFI. Its computation is basically the same with the NFI, except that degrees of freedom are taken into account. Therefore, it is not surprising that the hypothesized model IFI (0.94) is consistent with the CFI and reflects a very well-fitting model. Tucker-Lewis Index (TLI) is also coherent with the other indices, and it yields ranging from zero to 1.00. Values, which are close to .95 (for a large sample), indicate good fit and the hypothesized model. The TLI’s value is 0.94, indicates that the model is very well fitting. Another index related to the model parsimony is PRATIO (first fit index). It is computed relative to the NFI and CFI. The values of PNFI (0.84) and PCFI (0.84) respectively, it is considered moderately fit.
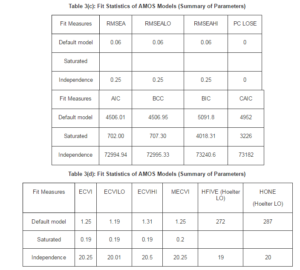
To test fit statistics, we used NCP (no centrality parameter) estimate. It is a fixed parameter with associated degrees of freedom. In the hypothesized model, we find that the model yield a non-centrality parameter 4093. This value represents the value χ2 minus its degree of freedom (4382 – 289). The confidence interval indicates that we can be 90% convinced that the population value of the non-centrality parameter (ÊŽ) lies between 3883 (NCPLO) and 4311 (NCPHI).
We also took into account the error of approximation in the population. Therefore, the next set of statistics focused on the root mean square error of approximation (RMSEA). It took into account the error of approximation in the population and asked the question, “How well would the model be, with unknown but optimally chosen parameter values, fitted the population covariance matrix if it were available?” This discrepancy is expressed per degree of freedom, thus making the index was sensitive to the number of estimated parameters in the model (i.e. the complexity of the model). The values, which are less than 0.05, indicate good fit, and the values, are as higher than 0.08, represent reasonable errors of approximation in the population. The values, between 0.08 – 0.10, indicate mediocre fit, and those are greater than 0.10; it indicates a poor fit. In referring to the table, the RMSEA’s value for the hypothesized model is 0.06 (with the 90% confidence interval), which ranges from 0.06 (RMSEALO) to 0.06 (RMSEALI), and the p value for the test equal to 0.000. It is concluded that of the confidence interval indicates we can be 90% convinced that the true RMSEA value in the population will fall within the bounds of 0.06 and 0.06, which represents a good degree of precision.
As noted by Byrne (1994), we also matched the result with another cluster of statistics. Firstly, we tested the Akaike’s Information Criterion (AIC) and CAIC. Both criteria address the issue of parsimony in the assessment of model fit. The AIC and CAIC are used in the comparison of two or more models, with smaller values representing a better fit of the hypothesized model. There are no standard values, but the range is between zero to 1.00 and for both criteria, the smaller values indicate a more parsimonious model (Kelloway, 1998). According to Schneider (2009), the Browne-Cudeck Criterion (BCC) and Bayes Information Criterion (BIC) operate in the same manner as the AIC and CAIC. Nevertheless, the basic difference is that both BCC and BIC impose greater penalties than either the AIC or CAIC for complexity model. Turning to the output, the study indicates that the AIC, CAIC, BCC as well as BIC for the hypothesized model is smaller than the Independence Model. We conclude that these four criteria are fit.
We developed the second criteria for the additional cluster by testing an expected cross-validation index (ECVI). It was proposed, initially, as a means to assessing in a single sample, the likelihood that the models cross-validate across similar-sized samples from the same population (Browne and Cudeck, 1989). Especially it measures the discrepancy between the fitted covariance matrix in the analysed sample, and the expected covariance matrix that would be obtained in another sample of equivalent size (Byrne, 2001). The model having smallest ECVI value exhibits the greatest potential for replication. The author also said that there were no longer determined appropriate range values but if the value of the hypothesized model was less than the value of the saturated and independence model, it was considered the best fit to the data (Barbara, 2001). The result showed the value for the proposed model was 1.25, which was bigger than saturated and lesser than the independence model. We conclude that the study represents the best fit to the data.
Our last consideration to test the goodness-fit statistic is Hoelter’s critical N(CN) (labeled as Hoelter’s 0.05 & 0.01 indices). This statistic measurement differs substantially from those previously discussed one that focuses directly on the adequacy of sample size, rather than on model fit. Specifically, its purpose is to estimate a sample size that will be sufficient to yield an adequate model fit for a χ2 test. The value above 200 indicates that a model adequately represents the sample data. As shown in table 3(d) above, both the 0.05 and 0.01 CN’s values for the hypothesized model were bigger than 200 (272 and 287 respectively). The interpretation of this finding leads us to conclude that the sample size our sample (3506) was satisfactory. The model was depicted in Diagram 1.
Diagram 1: Hypothesized Five-Factor ALUS Model

Summary and Conclusions
We conclude that the hypothesized five factor CFA model for ALUS is highly fit the data. Therefore, we decided no need to further identify any areas of misfit in the model. If the hypothesized model is low or moderately fit the data, AMOS software provides two types of information that can be helpful in detecting model misspecification, i.e. the standardized residuals and the modification indices. We conclude that five dimensional – DIM1 (Quality of Library Staff), DIM2 (Quality of Electronic Services), DIM3 (Service Suitability), DIM4 (Psychical Facilities Availability and DIM5 (Services Accessibility) are fit to measure academic library user satisfaction. By default, the same dimensional could be used in other places to test the consistency and especially to universities that intend to improve its library service quality. As stated before, many people first looked to the library in forming an opinion of the overall quality of a university.
References
Arora, K. (2008). University Library System: Centralization and Decentralization, New Delhi: Regal Publications.
Publisher
Baggs, S. C. & Kleiner, B. H. (1996). “How to Measure Customer Service Effectively,” Managing Service Quality. 6(1), 36-39.
Publisher – Google Scholar – British Library Direct
Brophy, P. (2005). ‘The Academic Library,’ (2nd). London: Facet Publishing.
Google Scholar
Browne, M. W. & Cudeck, R. (1989). “Single Sample Cross-Validation Indices for Covariance Structures,” Multivariate Behavioral Research. 24(4), 445-455.
Publisher – Google Scholar
Byrne, B. M. (1994). ‘Structural Equation Modeling With EQS and EQS/Windows,’ London: Sage Publications.
Google Scholar
Byrne, B. M. (2001). ‘Structural Equation Modeling with AMOS: Basic Concepts, Applications, and Programming,’ New Jersey: Lawrence Erlbaum Associates.
Google Scholar
Chiemeke, S., Longe, O. B., Umar, S. S. & Shaib, I. O. (2007). “Users’ Perceptions of the use of Academic Libraries and Online Facilities for Research Purposes in Nigeria,” Library Philosophy and Practice, 5(1), 201-243.
Publisher – Google Scholar
Churchill, G. A. & Surprenant, C. (1982). “An Investigation into the Determinants of Customer Satisfaction,” Journal of Marketing Research. 19(4), 491-504.
Publisher – Google Scholar
Cook, C. & Thompson, B. (2000). “Reliability and Validity of SERVQUAL Scores used to Evaluate Perceptions of Library Service Quality,” Journal of Academic Librarianship. 26(4), 248.
Publisher – Google Scholar – British Library Direct
Cronin, J. J. & Taylor, S. A. (1992). “Measuring Service Quality: A Re-Examination and Extension,” Journal of Marketing.56(July), 55-68.
Publisher – Google Scholar
Dabas, K. C. (2008). ‘Quality Management in Libraries,’ New Delhi: ESS Publications.
Davis, M., Groves, R. & Kyrillidou, M. (2006). ‘Procedures Manual,’ Washington: Association of Research Libraries.
Dole, W. (2002). “Libqual+TM and the Small Academic Library,” Performance Measurement and Metrics. 3(2), 85-95.
Publisher – Google Scholar
Feng, M., Terziovski, M. & Samson, D. (2008). “Relationship of ISO 9001:2000 Quality System Certification with Operational and Business Performance: A Survey in Australia and New Zealand-Based Manufacturing and Service Companies,” Journal of Manufacturing Technology Management. 19(1), 22-37.
Publisher – Google Scholar – British Library Direct
Hernon, P. (1999). ‘Editorial: Service Quality in Libraries and Treating Users as Customers and Non-Users as Lost or Never-Gained Customers,’ Journal of Academic Librarianship. 22(3), 1-2.
Google Scholar
Hernon, P. & Whitman, J. R. (2000). Delivering Satisfaction and Service Quality: A Customer-Based Approach for Libraries, Chicago: American Library Association.
Publisher – Google Scholar
Hiller, S. (2001). “Assessing User Needs, Satisfaction, and Library Performance at the University of Washington Libraries,” Library Trends. 49(2), 605-625.
Publisher – Google Scholar – British Library Direct
Hitchingham, E. E. & Kenney, D. (2002). “Extracting Meaningful Measures of User Satisfaction from Libqual+ for the University Libraries at Virginia Tech,” Performance Measurement and Metrics. 3(2), 48-58.
Publisher – Google Scholar
Host, V. & Knie-Andersen, M. (2004). “Modeling Customer Satisfaction in Mortgage Credit Companies,” The International Journal of Bank Marketing. 22(1), 26-42.
Publisher – Google Scholar – British Library Direct
House, N. A. V., Weil, B. T. & Mcclure, C. R. (1990). Measuring Academic Library Performance: A Practical Approach,Chicago: American Library Association.
Publisher – Google Scholar
Hoyle, R. H. (1995). Structural Equation Modeling: Concepts, Issues, and Applications, London: Sage Publication.
Publisher – Google Scholar
Hu, L.- T. & Bentler, P. M. (1999). “Cut-Off Criteria for Fit Indexes in Covariance Structure Analysis: Conventional Criteria versus New Alternatives,” Structural Equation Modeling. 1(1), 1-55.
Publisher – Google Scholar – British Library Direct
Jabatan Perkhidmatan Awam. (1996). Pekeliling Kemajuan Pentadbiran Awam Bilangan 2 Tahun 1996: Garis Panduan Bagi Melaksanakan MS ISO 9000 Dalam Perkhidmatan Awam, Kuala Lumpur: Jabatan Perdana Menteri. (In English: Public Service Office. 1996. Public Service Report No. 2/1996: Guideline for MS ISO 9000 in Public Administration. Kuala Lumpur: Prime Minister Office).
Publisher
James, L. R., Mulaik, S. A. & Brett, J. M. (1982). Causal Analysis: Assumptions, Models, and Data, London: Sage Publications.
Publisher – Google Scholar
Johari, R. & Zainad, A. N. (2007). Measuring the Library Service Performance Using SERVPERF, International Conference on Libraries, Information and Society, Icolis. University Malaya.
Publisher – Google Scholar
Jones, D. M. (2002). ISO 9001:2000 and Customer Relationship Management.
Publisher
Juran, J. M. (1992). Juran on Quality by Design: The New Steps for Planning Quality into Goods and Services, New York: The Free Press.
Publisher – Google Scholar
Kelloway, E. K. (1998). Using LISREL for Structural Equation Modeling: A Researcher’s Guide, London: Sage Publications.
Publisher – Google Scholar
Kenny, D. A. (2003). Measuring Model Fit, Access from: http://davidakenny.net/cm/fit.htm.
Publisher
Ling-Feng Hsieh, Jiung-Bin Chin & Wu, M.- C. (2004). “The Performance Indicators of University E-Library in Taiwan,”The Electronic Library. 22(4), 325-330.
Publisher – Google Scholar – British Library Direct
Marcoulides, G. A. & Schumacker, R. E. (Ed).Eds. (1996). Advanced Structural Equation Modeling: Issues and Techniques, New Jersey: Lawrence Erlbaum.
Publisher – Google Scholar
Nagata, H., Satoh, Y., Gerrard, S. & Kytomaki, P. (2004). “The Dimensions That Construct the Evaluation of Service Quality in Academic Libraries,” Performance Measurement and Metrics. 5(2), 53-65.
Publisher – Google Scholar – British Library Direct
Nitecki, D. A. (1995). An Assessment of the Applicability of SERVQUAL Dimensions as Customer-Based Criteria for Evaluating Quality of Services in an Academic Library, College Park. University of Maryland.
Publisher – Google Scholar
Nitecki, D. A. (1996). “Changing the Concept and Measure of Service Quality in Academic Libraries,” Journal of Academic Librarianship. 22(3), 181-190.
Publisher – Google Scholar
Nitecki, D. A. & Franklin, B. (1999). “Perspectives on New Measures for Research Libraries,” Journal of Academic Librarianship. 25(6), 484-488.
Publisher – Google Scholar – British Library Direct
Nunnally, J. C. (1978). Psychometric Theory, New York: Mcgraw-Hill.
Publisher – Google Scholar
Oliver, R. L. (1997). Satisfaction: A Behavioral Perspective on the Consumer. United States: Mcgraw-Hill.
Publisher – Google Scholar
Poll, R. & Boekhorts, P. T. (2007). Measuring Quality: Performance Measurement in Libraries, (2nd). Munchen: K.G. Saur.
Publisher – Google Scholar – British Library Direct
Pruden, D. R. (1997). “If We Are Concerned about Customer Retention, Why Do We Want to Keep Making Contact Through Customer Satisfaction Research?,” Direct Marketing. 60(7), 30-32.
Publisher
Schneider, B. (2009). Fit Indices for Structural Equation Modeling, Access from: http://www.psych-it.com.au/Psychlopedia/article.asp?id=277 (20 October 2010).
Publisher
Schumacker, R. E. & Lomax, R. G. (2004). A Beginner’s Guide to Structural Equation Modeling, Mahwah: Lawrence Erlbaum.
Publisher – Google Scholar
Shi, X., Holahan, P. J. & Jurkat, M. P. (2004). “Satisfaction Formation Processes in Library Users: Understanding Multisource Effects,” Journal of Academic Librarianship. 30(2), 55-64.
Publisher – Google Scholar
Steiger, J. H. (2000). “Point Estimation, Hypothesis Testing and Interval Estimation Using the RMSEA: Some Comments and a Reply to Hayduk and Glaser,” Structural Equation Modeling. 7(2), 149-162.
Publisher – Google Scholar – British Library Direct
Sureshchandar, G. S., Rajendran, C. & Anantharaman, R. N. (2002). “The Relationship between Service Quality and Customer Satisfaction – A Factor Specific Approach,” Journal of Services Marketing. 16(4), 363-379.
Publisher – Google Scholar – British Library Direct
Surprenent, C. F. & Solomon, M. R. (1987). “Predictability and Personalization in the Service Encounter,” Journal of Marketing. 51(2), 73-80.
Publisher – Google Scholar
Thompson, B., Cook, C. & Heath, F. (2003). “Two Short Forms of the LIBQUAL+ Survey: Assessing Users Perceptions of Library Service Quality,” Library Quarterly. 73(4), 453-465.
Publisher – Google Scholar – British Library Direct
Valarie, A. Z. & Bitner, M. J. (2000). ‘Services Marketing: Integrating Customer Focus across the Firm,’ Boston: Irwin Mcgraw-Hill.
Google Scholar
Vavra, T. G. (2002). Customer Satisfaction Measurement Simplified: A Step-By-Step Guide for ISO 9001:2000 Certification, Milwaukee: ASQ Quality Press.
Publisher – Google Scholar
Westbrook, R. A. (1981). “Sources of Consumer Satisfaction with Retail Outlets,” Journal of Quality. 57(3), 68-85.
Publisher – Google Scholar
Westcott, R. T. (Ed). (2006). The Certified Manager of Quality/Organizational Excellence Handbook, Milwaukee: ASQ Quality Press.
Publisher – Google Scholar
White, L. S. (1998). A Service Quality Survey at the University of Virginia Library, Management Information Services.
Publisher – Google Scholar
Wilson, D. D., Tufo, T. D. & Norman, A. E. C. (2007). The Measure of Library Excellence, London: Mcfarland & Company.
Publisher – Google Scholar