Introduction
An analytical study is done to search for an effective solution to the portfolio selection problem. Coleman (2001) and Czyzyk et al. indicate that “Portfolio theory assumes that for a given level of risk, investors prefer higher returns to lower returns. Similarly, for a given level of expected return, investors prefer less risk to more risk”. Investors would therefore prefer to invest in an efficient portfolio. That is, no other portfolio will give them more reward (greater return) for the same or a lower level of risk. Also, no other portfolio will give an investor less risk for the same (or more) reward than the investor get on this portfolio (Coleman, 2001; Czyzyk et al.)
Traditionally the Markowitz portfolio selection model was used to find a solution portfolio selection problem. This is a non-linear optimisation model that searches for a portfolio of funds that minimises risk, as measured by its variance. The investor has a fixed amount to invest and wants to know what percentage of the investment budget should be allocated to each fund. However, this paper investigates investment strategies that use decision-making under uncertainty. These investment strategies are compared with the Money Market (MM), which has very little risk associated with it.
In decision making-under uncertainty, there are a number of possible outcomes for each alternative and the decision maker does not know the probabilities of the various states of nature (Render et al., 2003). Risk measures are, therefore, not used in these investment strategies. In other words, in decision-making under risk, the decision-maker assigns mathematical probabilities to the randomness that he is faced with. In decision-making under uncertainty the randomness cannot be expressed in terms of mathematical probabilities because it is not known (Fonseca).
The first section of this paper presents a brief background to decision-making under uncertainty in economic applications and a few examples of other areas where this type of decision-making has been applied to in the past. The results of perfect information strategies and investment strategies that use models for decision-making under uncertainty are also included. All the models, without the MM fund included (except for perfect information), performed better; even before transaction costs were considered. Hence, only models without the MM are demonstrated in this paper. Perfect information implies that investors know in advance what event will occur. Although investors never have perfect information in practice, it is worth knowing how much they could improve the value of their decision if they had such information (Camm & Evans, 2000).
The following summary statistics will be indicated for each strategy. The comparison of the results and selection of the best strategies, using these decision criteria, are included in this paper (see Comparison of results):
- X
 Monthly return on fund/strategy.
-
 Average return per month.
- s Standard deviation as a measure of risk.
- r Effective interest rate.
- P(X < MM) Probability that monthly returns of a fund or a strategy are less than the monthly returns of the MM.
Background to Decision-Making under Uncertainty
According to Hansson (2005), modern decision theory has developed since the 1950s through contributions from a number of fields of study, including statistics, economics, psychology, political sciences, social sciences and philosophy. Not all the practitioners in these disciplines will study the same aspects of the decision-making process though. For example: “a political scientist will study voting rules and other aspects of collective decision-making; a psychologist will study the behaviour of individuals in decisions and a philosopher the requirements for rationality in decisions” (Hansson, 2005). However, there is an overlap because methods are applied to the same or similar problems by academics of different backgrounds.
According to Fonseca, Frank H. Knight first introduced the idea to apply risk and uncertainty in economics in 1921. However, risk and uncertainty was only formally integrated in economic theory in 1944, when John von Neumann and Oskar Morgenstern published “Theory of Games and Economic Behaviour” (Fonseca; Hansson, 2005).
The following are examples of complex decisions that were made with decision-making under uncertainty strategies:
- According to their website The Club of Rome (2008) is “a global think tank and they act as a global catalyst for change through the identification and analysis of the crucial problems facing humanity and the communication of such problems to the most important public and private decision makers as well as to the general public”. The organisation consists of scientists, economists, politicians, etc. The Club of Rome developed an economic growth and resource usage model that helps politicians to make real-life decisions in complex situations (The Club of Rome, 2008).
- Decision theory helped to allocate health care funds in the United Kingdom. A team from York University achieved this by using decision theory to identify a set of key variables to explain health care usage in the United Kingdom. This resulted in modifications to the decision-making approach regarding health care funds to allocate funds more fairly and justly (Bistritz, 1997; Render et al,. 2003).
Data
The dataset comprises 18 years (July 1985 to December 2003) of monthly percentage returns from selected financial and stock market data obtained from ABSA’s actuarial division. Eight funds are included in this study, seven stock market funds and a MM fund. The stock market funds are dividend funds (funds of funds) that consist of investments in equity, bonds, cash, property, international equity, etc. The minimum amount that can be invested in a fund is R 50 000 (ABSA, 2008). In this study, the first fund will be referred to as S1, the second fund as S2, etc.
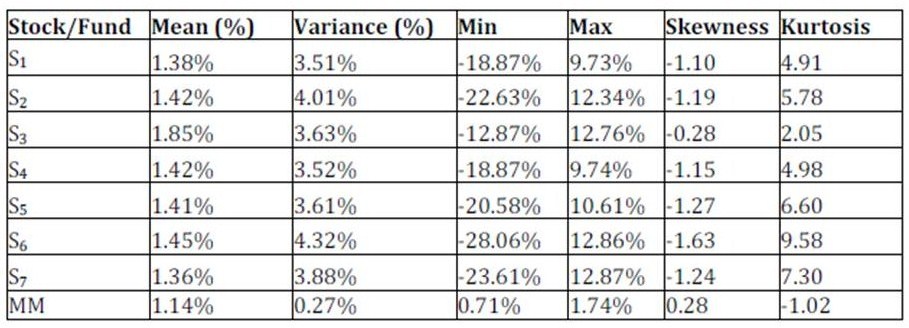
ABSA (2008) declares that the ABSA Money Market Fund is similar to ordinary unit trusts as contributions from all clients are pooled, but these are now invested in highly specialised money market securities. These securities include bank deposits, wholesale call deposits, bridging bills, parastatal bills (e.g. Eskom), treasury bills and commercial papers issued by governments, banks and large corporations who need to borrow money on a short-term basis. The minimum amount that can be invested in this fund is R 20 000 (ABSA, 2008). Table 1 displays some statistics for the monthly return data:
Table 1: Statistics of Return Data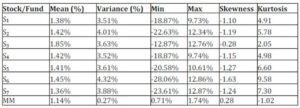
The following transaction costs are used for making switches between funds:
- Fund-manager fee (for making a switch) R100.
- To switch from one fund to another no charge.
- To stay in money market from month to month no charge.
- To switch from MM (money market) to a fund 0.25% of the investment + fund manager’s fee.
- To switch from a fund to MM 0.40% of the investment + fund manager’s fee.
Perfect Information
Perfect information answers the question: ‘What could the results have been, if we had perfect information about the future?’ In other words, prior knowledge to what the best investment alternative (the fund with the maximum return) would have been. This section includes the investment results for two Perfect Information strategies and investment in the individual funds (thus, investment in a single fund over the total investment period of 18 years).
Perfect Information Strategies
The following two perfect information strategies are applied:
- Perfect information (with MM) – Perfect information that includes the MM fund is obtained by selecting the fund that maximises the outcome for the current month. Thus, transaction costs are taken into consideration, to see whether it is worthwhile to make the switch from MM to a dividend fund or vice versa.
- Perfect information (without MM) – Perfect information that excludes the MM fund is obtained by selecting the fund with the maximum return for the present month.
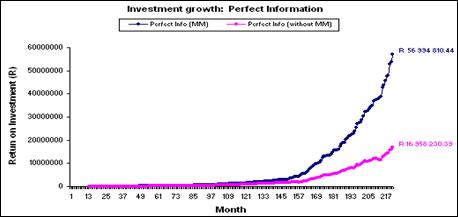
Figure 1 shows a comparison between the two perfect information strategies. The two strategies grow concurrently (until around the 28th month). Thereafter the perfect information strategy (with MM) begins to move above the perfect information strategy (without MM), i.e. grows at a faster rate. The perfect information (with MM) strategy’s total growth is more than double the total growth of the perfect information (without MM) strategy.
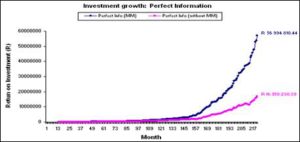
Fig 1. Comparison between Perfect Information Strategies
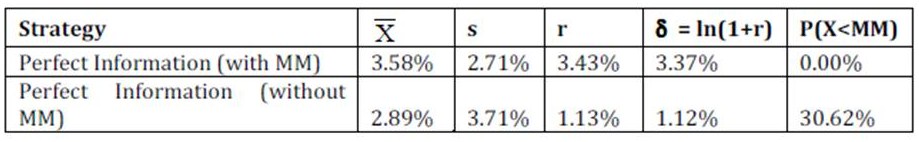
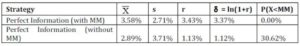
Table 2 presents the summary statistics for the two perfect information strategies.The perfect information strategy (with MM) performed better as it shows a higher average return per month, effective interest rate and delta respectively. The standard deviation for this alternative is also lower, as this strategy shows less variability of returns around the mean. The P(X<MM) value for this option is indicated as 0.00% because the investor would have invested in the MM if all the other funds performed poorly (thus, achieved lower returns than the MM returns or even had negative returns). Therefore, the decision maker can never do “worse” than the MM.
Table 2: Perfect Information Strategies Summary Information
Individual Funds
This section provides an overview of what the individual funds achieved. In other words, what the outcome would have been if an investor invested in one fund over the entire investment period.
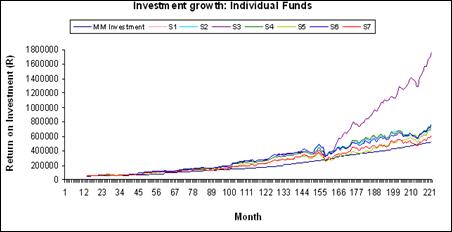
Figure 2 shows a comparison of the investment growths for the different funds. All the individual funds (from S1 to S7) performed better than the MM fund. From around the 165th month the S3 fund investment grows at a much faster rate than the other funds.
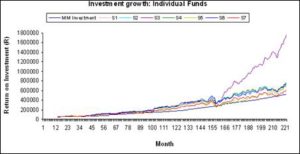
Fig 2. Comparison between Individual Funds
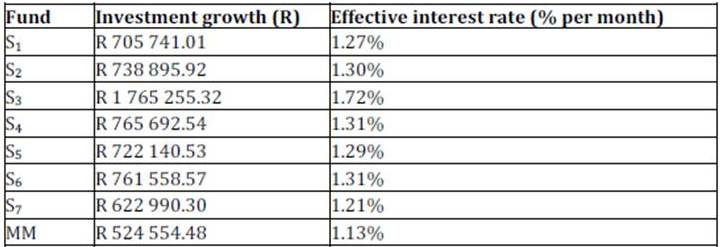
The investment growth at the end of the investment period and the effective interest rate, for all eight the individual funds, are given in Table 3. Fund S3 has the maximum investment growth and MM has the minimum.
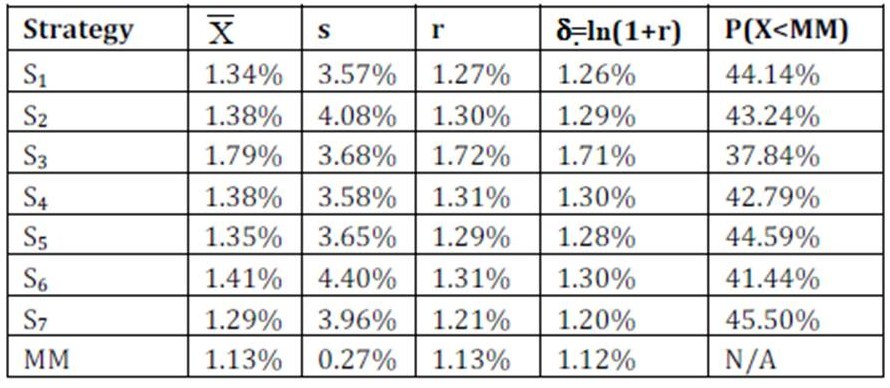
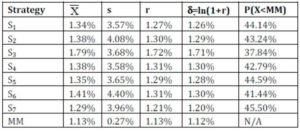
Table 4 provides more detail on the eight individual funds as it displays the summary statistics. Fund S3 has the highest average return and effective interest rate per month, i.e. 1.79% and 1.72% respectively.
Table 3: Investment Growth for Individual Funds
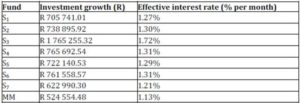
Table 4: Individual Funds Summary Information
Strategies for Decision-Making under Uncertainty
The following sections present the results of investment strategies not using risk measures, i.e. models for decision-making under uncertainty.
Min Strategy
The min strategy is applied over three different time horizons, which include:
- Monthly min strategy – Invest in the fund that obtained the smallest return in the previous month.
- Half yearly min strategy – Invest in the fund that obtained the smallest average return over the past six months, for the next six months.
- Yearly min strategy – Invest in the fund that obtained the smallest average return over the past year, for the next year.
Figure 3 illustrates a comparison between the three min strategies and the MM. All three the min strategies performed better than the MM fund.
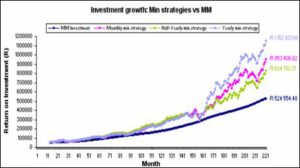
Fig 3. Comparison between Min Strategies
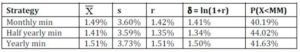
Table 5 provides details on the effective interest rates for all the min strategies. The yearly min strategy is dominant, with an effective interest rate of 1.51% per month. The effective monthly interest for the monthly min strategy is 1.42% and for the half yearly min strategy it is 1.35%
Table 5: Min Strategies Summary Information
Max Strategy
The max strategy is implemented for three different time horizons, which include:
- Monthly max strategy – Invest in the fund that obtained the largest return in the previous month.
- Half yearly max strategy – Invest in the fund that obtained the largest average return over the past six months, for the next six months.
- Yearly max strategy – Invest in the fund that obtained the largest average return over the past year, for the next year.
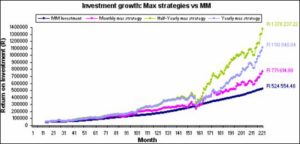
Fig 4. Comparison between Max Strategies
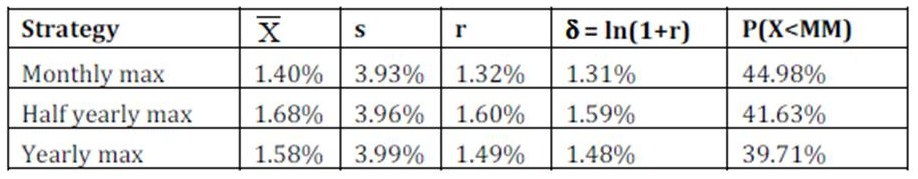
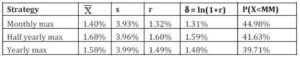
Figure 4 shows a comparison between the three max strategies and the MM. All three the max strategies performed better than the MM fund. Table 6 demonstrates that the half yearly max strategy performed the best, with an effective interest rate of 1.60% per month. The effective monthly interest rate for the monthly max strategy is 1.32% and for the yearly max strategy it is 1.49%.
Table 6: Max Strategies Summary Information
Min/Max Strategy
The investor considers the average returns on the min strategy and the max strategy respectively, for the previous year. The investor then invests in the strategy that performed the best in the previous year, for the following year. This strategy is also performed half yearly.
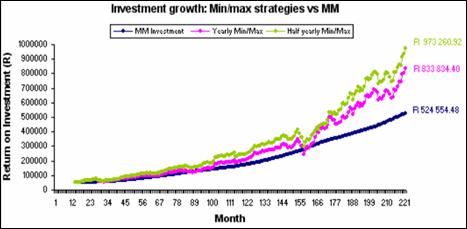
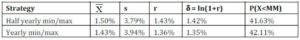
Figure 5 illustrates the comparison of the min/max strategies and the MM. Both the min/max strategies exceeded the MM fund’s growth.
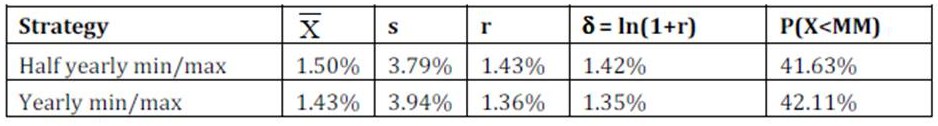
The half yearly min/max strategy has the highest effective interest rate, i.e. 1.43% per month. The effective monthly interest rate for the yearly min/max strategy is 1.36% (See Table 7).

Fig 5. Comparison between Min/Max Strategies
Table 7: Min/Max Strategies Summary Information
Maximax Strategy
This is an optimistic decision criterion that finds the alternative (fund) that maximizes the maximum payoff for each alternative (Render et al., 2003). Thus, this decision-making strategy finds the alternative with the highest possible gain, in the previous year, to invest in that alternative for the following year. The strategy is also applied half yearly.
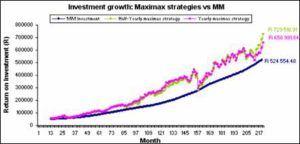
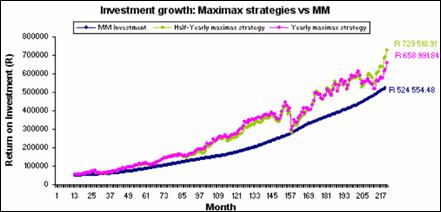
Fig 6. Comparison between Maximax Strategies
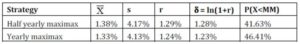
Figure 6 shows a comparison between the maximax strategies and the MM. Both the maximax strategies exceed the investment growth total of the MM fund. Table 8 provides a summary of the Maximax strategy information, which shows that the half yearly maximax strategy shows the best effective interest rate, i.e. 1.29% per month and the effective monthly interest rate for the yearly maximax strategy is 1.24%.
Table 8: Maximax Strategies Summary Information
Maximin Strategy
This is a pessimistic decision criterion that attains the alternative that maximizes the minimum payoff for each alternative (Render et al., 2003). Thus, this decision-making strategy finds the alternative with the least possible loss in the previous year, to invest in that alternative for the following year. The strategy is also applied half yearly.
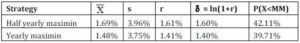
The graph below illustrates the comparison between the maximin strategies and the MM. Both the maximin strategies surpass the investment growth total of the MM fund.
Fig 7. Comparison between Maximin Strategies
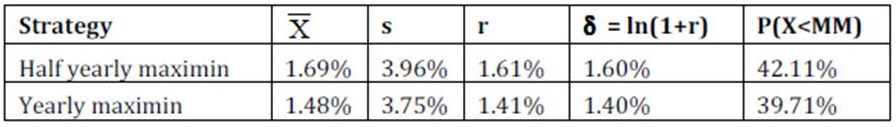
Table 9 shows that the half yearly maximin strategy has the best effective interest rate, i.e. 1.61% per month and the effective monthly interest rate for the yearly maximin strategy is 1.41%.
Table 9: Maximin Strategies Summary Information
Laplace Strategy
This is a decision approach that finds the alternative with the highest average payoff. This approach assumes that all probabilities of occurrence for the different outcomes are equal; therefore it is also called the equally likely strategy (Render et al., 2003). This strategy is applied half yearly and yearly.
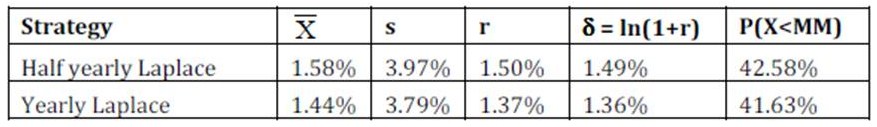
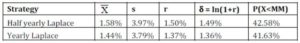
Figure 8 illustrates the comparison of the Laplace strategies and the MM. Both the Laplace strategies performed better than the MM fund. The half yearly Laplace strategy shows the best effective interest rate, i.e. 1.50% per month and the effective monthly interest rate for the yearly Laplace strategy is 1.37% (see Table 10 below for details).
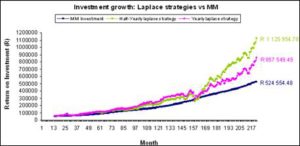
Fig 8. Comparison between Laplace Strategies
Table 10: Laplace Strategies Summary Information
Minimax Regret Strategy
This decision criterion finds the alternative that minimizes the maximum opportunity loss within each alternative. Render et al. (2003) state that the opportunity loss that is actually realized will be no more than the minimax value, as the investor finds the maximum opportunity loss within each alternative and then selects the alternative with the smallest value. This strategy is performed yearly and half yearly.
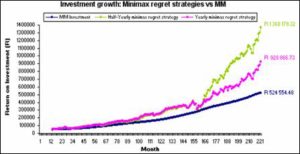
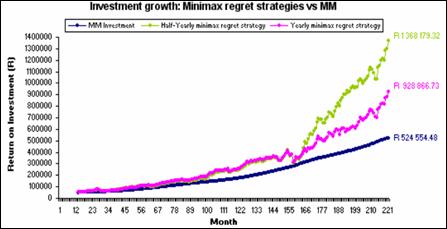
Fig 9. Comparison between Minimax Regret Strategies
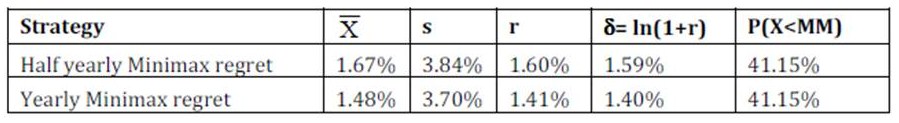
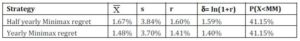
The graph above illustrates the comparison between the Minimax regret strategies and the MM. Both the Minimax regret strategies surpass the investment growth total of the MM fund. Table 11 shows that the half yearly Minimax regret strategy has the best effective interest rate of 1.60% per month and the effective interest rate for the yearly Minimax regret strategy is 1.41% per month.
Table 11: Minimax Regret Strategies Summary Information
Hurwicz Criterion Strategy
This is a weighted average approach that selects the alternative with the highest weighted average. A coefficient of realism is selected; the coefficient is between 0 and 1. When is close to 0, the decision maker is pessimistic about the future and when is close to 1, the decision maker is optimistic about the future (Render et al., 2003). This strategy is applied yearly and half yearly with both optimistic and pessimistic values for the criterion of realism.
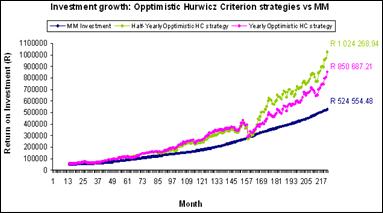
For the Optimistic Hurwicz criterion strategy the coefficient of realism is 0.8. Figure 10 illustrates the comparison of the Optimistic Hurwicz criterion strategies and the MM. Both the Optimistic Hurwicz criterion strategies performed better than the MM fund.
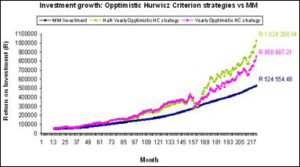
Fig 10. Comparison between Optimistic Hurwicz Criterion Strategies
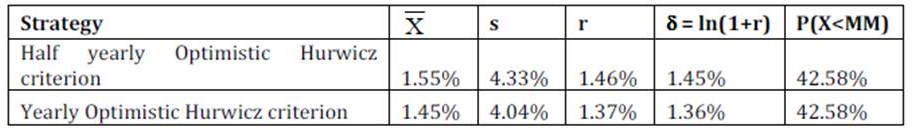
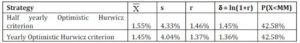
Table 12 illustrates that the half yearly Optimistic Hurwicz criterion strategy shows the best effective interest rate of 1.46% per month and the effective interest rate for the yearly Optimistic Hurwicz criterion strategy is 1.37% per month.
Table 12: Optimistic Hurwicz Criterion Strategies Summary Information
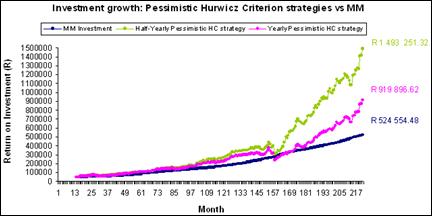
For the pessimistic Hurwicz criterion strategy the coefficient of realism is 0.1. Figure 11 illustrates the comparison of the Pessimistic Hurwicz criterion strategies and the MM. Both the Pessimistic Hurwicz criterion strategies performed better than the MM fund.
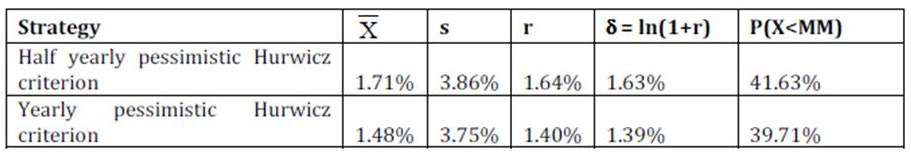
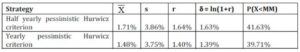
Table 13 shows that the half yearly Pessimistic Hurwicz criterion strategy has the best effective interest rate, i.e. 1.64% per month. The effective interest rate for the yearly Pessimistic Hurwicz criterion strategy is 1.40% per month.
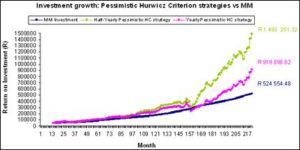
Fig 11. Comparison between Pessimistic Hurwicz Criterion Strategies
Table 13: Pessimistic Hurwicz Criterion Strategies Summary Information
Comparison of Results
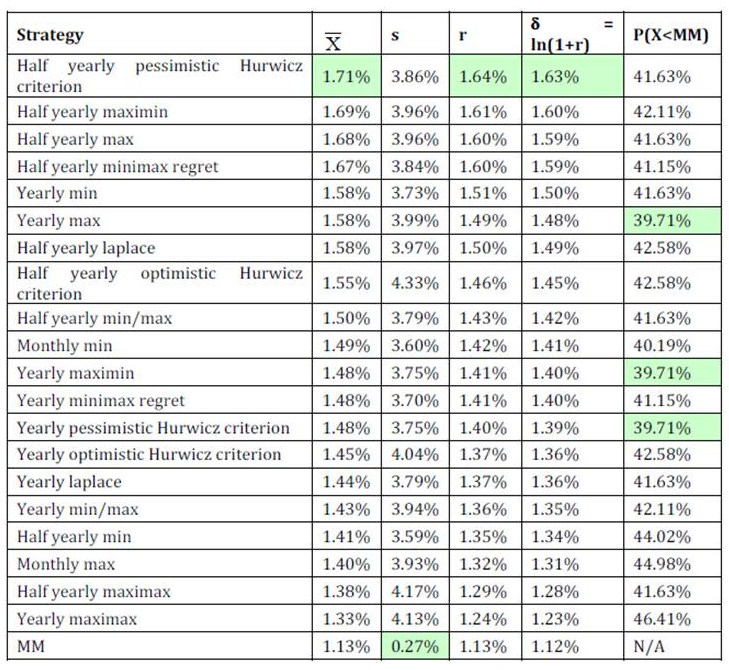
Table 14 provides a summary for the monthly return averages, the standard deviation, the effective interest rate, the delta and the estimated probability that the monthly returns will be less than the MM for the decision-making under uncertainty strategies.
Average Monthly Return, Effective Interest Rate or Delta as Decision Criteria
If the average monthly return, effective interest rate or delta (  , r and
  respectively in Table 14) is used as criteria, the objective will be to maximise the values, i.e. the strategy that has the highest values will be selected. The half yearly Pessimistic Hurwicz criterion strategy (where
  = 0.1) shows the highest value. Consequently, this strategy will be selected as the optimal strategy for decision making under uncertainty, if this criterion is preferred.
Standard Deviation as Decision Criteria
If the standard deviation (s in Table 14) is used as criterion, the objective will be to minimise this risk value, thus the strategy that has the lowest value will be selected. The MM fund shows the lowest value. Therefore, this strategy will be selected as the optimal strategy for decision making under uncertainty with this criterion.
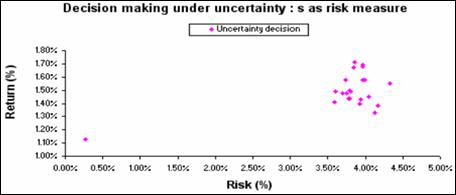
Figure 12 displays the risk (as measured by s) against the average monthly returns. The MM has the minimum risk (0.27%), but it also has the lowest return value of 1.13%. All the other strategies have monthly averages of 1.33% and higher, but these strategies also have higher risk. From the graph we can see that if an investor e.g. specifies that he require the risk to be 3.85% or less, the best strategy will be the half yearly minimax regret strategy. The average is the highest for this option and the risk restriction is satisfied. The half yearly pessimistic Hurwicz criterion will not be selected (although it has the highest average), since it does not satisfy the risk constraint. The risk for this option is 3.86%.
Table 14: Decision Making under Uncertainty Strategies Summary Information
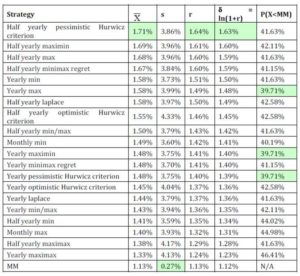
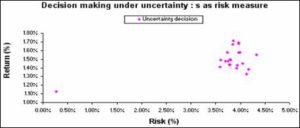
Fig 12. Risk (s as risk measure) vs. Return
P(X<MM) as Decision Criteria
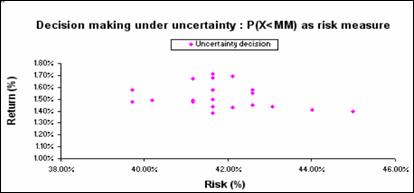
If the probability that the returns are less than the MM is used as criterion, the objective will be to minimise this risk value (the strategy with the lowest value will be selected). Table 14 indicates that the yearly max strategy, yearly maximin strategy and yearly Pessimistic Hurwicz criterion strategy showed the same minimum value for this criterion. If the highest average return is also taken into consideration, then the yearly max strategy will be selected as the optimal strategy for decision-making under uncertainty. This is also illustrated in Figure 13 that displays the risk against the average monthly returns for all the strategies for this criterion.
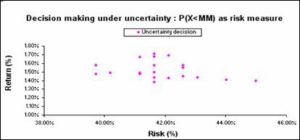
Fig 13. Risk (P(X<MM) as risk measure) vs. Return
Conclusion
This paper proposes some decision making strategies that do not use risk measures in the decision making process, i.e. decision-making under uncertainty. All these strategies are compared to the MM fund, which has very little risk associated with it. All the strategies outperformed the MM fund. The half yearly Pessimistic Hurwicz criterion strategy performed the best in terms of total investment growth.
This paper also presented the results for investment in individual funds and the results for perfect information. Fund S3 achieved the best result for investment in the individual funds, thus if an investor decided to stay in one fund over the entire investment period.
(adsbygoogle = window.adsbygoogle || []).push({});
References
ABSA. (2008). ‘Money Markets,’ [Online], [Retrieved January 10, 2008], http://www.absa.co.za
Bistritz, N. (1997). ‘Rx for U.K. Healthcare Woes,’ [Online], [Retrieved February 15, 2008], http://www.lionhrtpub.com/orms/orms-4-97/PracticeLesson.html
Camm, J. D. & Evans, J. R. (2000). “Management Science and Decision Technology,” South-Western College Publishing, Cincinnati, Ohio.
Publisher – Google Scholar
Coleman, T. F. (2001). ‘The Portfolio Selection Problem,’ [Online], [Retrieved September 14, 2005],http://www.tc.cornell.edu/~coleman/cs622_2001/port.pdf#search=’portfolio%20selection%20problem
Czyzyk, J., Stubbs, R., Wisniewski, T. & Wright, S. (2005). ‘The Portfolio Selection Problem – An Introduction,’ [Online], [Retrieved September 14], http://www-fp.mcs.anl.gov/otc/Guide/CaseStudies/port/
Fonseca, G. L. (2008). ‘Choice under Risk and Uncertainty – General Introduction,’ [Online], [Retrieved February 15],http://cepa.newschool.edu/het/essays/uncert/intrisk.htm
Hansson, S. O. (2005). ‘Decision Theory – A Brief Introduction,’ [Online], [Retrieved September 14, 2008],http://www.infra.kth.se/~soh/decisiontheory.pdf
Render, B., Stair, R. M. & Hanna, M. E. (2006). ‘Quantitative Analysis for Management,’ Pearson Prentice Hall, Upper Saddle River, New Jersey.
The Club of Rome. (2008). ‘The Story of the Club of Rome,’ [Online], [Retrieved February 15, 2008], http://www.clubofrome.org/eng/about/4/