Introduction
Social network applications have gained popularity in the health domain as they bring health information seekers (patients and alike) and medication advice providers (physicians and other relevant actors) together.
The effects of information and communications technologies (ICT) on health information and/or advice-seeking behaviors have been examined at such levels as organizational, group or individual (Dunn and Westbrook 2011). At the individual level, it is essential to understand such effects in terms of establishments of interactions within and between different health groups and actors such as physicians, nurses, patients or alike (Creswick and Westbrook 2010, Effken et al. 2011, Sillence et al. 2007). Recent reports concerning the adoption of online health applications have shown people’s and organizations’ significant interest in them (Moss and Elias 2010). Of particular importance among these applications is health information and advice-seeking supporting applications (e.g., WebMD, Healthline) having a direct link to social network sites whereby information support is empowered by human relations or vice versa. This is not surprising especially for the health domain, since peers’ opinions for medical practitioners (Bosslet et al. 2011) and patients’ experience for “like-minded others” are found to be valuable for health-decision making. Thus, one needs to find out if and how human interactions are established due to information and/or advice-seeking behaviors for health issues. Thanks to emerging online health social network platforms (e.g., HealthTap, WebMD, Doktorsitesi), which help in providing relevant data for the analysis of information and social networks.
This research aims to understand patients’ and physicians’ habitual tendencies for establishing ties as they engage in health-related interactions on online interactive health networks. Thus, the motivating questions are as follows: who wants or does not want to be tied to whom? What specific essential structural properties of tying wishes are present and how these wishes result in the establishment of ties? Who prevails in the tying and tie networks? What specific patterns of tie formation (dyadic and triadic) dominate? What are the underlying mechanisms of tying wishes and tie formation?
As shall be articulated later on, we refer to a blended model to discuss the formation of ties: growth and preferential attachment in complex networks (Barabási 2009, Newman 2001) and homophily (as opposed to heterophily) in social relations in general (McPherson et al. 2001) and in tie formation in particular (Centola and van de Rijt 2014, Mascia et al. 2011). The former indicates how ties are added to a growing network and the latter explicates the importance of social similarity for tie formation. Similar research logic is adopted by (Johnson et al. 2014) to understand social mechanisms in online communities.
To proceed in answering these questions, we examine one of the leading online interactive health networks (www.doktorsitesi.com) in Europe. According to their website, Doktorsitesi has around one million users (patients alike) and 15000 physicians. As shall be explained later on, the website examined provides physicians and patients alike with special social networking features such as private messaging, tying, exchanging information via questions and answers, and other user-led content related services (twitter-like following, articles, videos). In this research, we focus on the tie feature. This feature lets users make request for a tie and/or approve of a tie. In case a request is approved, it becomes a tie, which signifies a bilateral agreement with a reciprocal right to send an unlimited number of messages. Thus, for this research there are two essential information elements; one is concerned with request for a tie and the other is related to established ties. The former is conceptualized as a tying network, and the latter is considered as a tie network.
By conducting social network analysis (SNA), we are able to surface intriguing interactions among and between physicians and patients alike. An established connection, in turn, can be associated with the concept of a tie (Granovetter 1973). To better examine tie establishment, we make use of essential properties that characterize most real networks. We should note that the structures (patterns of interactions) underpinning such interactions turn out to be essential to explain how people learn, form opinions, and affect the others.
Rooted in social network theory (Milgram 1967) and graph theory (Wasserman 1994), social network analysis (SNA) is an approach embracing a set of techniques that can help in the examination of complex communication and interaction patterns in various contexts such as health information platforms. Empowered by a trans-discipline, so-called network science, one can explore structural and dynamic (evolutionary) aspects of a network (that is, things and their relations) from appropriate perspectives including social management, and management information systems. This research focuses on the structural aspects of a network so that we can identify, if exists, the salient features of a typical complex network such as small-world, giant component. As an alternative to conventional methods for analyzing networks in the health domain (that is, survey and observation for data collection and limited unit of analysis (Chambers et al. 2012), we make use of valuable data generated on a health information platform and employ SNA methods relevant to our data set.
Methods
We obtained a raw data set describing the ties feature of Doktorsitesi.com. The set is composed of activities of members who made use of the feature; either to make a request for a tie or to approve of a tie, collectively called tying wishes, over the 3-month period from October to December 2012. For each of these members, we have a log of their tying wishes where user identifiers of both parties and the time stamp of a record constitute a transaction. We do not have any knowledge about the true identities of the members except that they are either medical practitioners or (presumably) patients. We believe that our data set is not influenced by subjective biases on the part of the platform members, and this is an effective method for probing an online platform.
Doktorsitesi.com allows its members to access the true identities of physicians but not patients. Patients and physicians alike are only granted access to patients’ anonymous user profiles that consist of their age, gender, and education. The tying feature is a channel that helps patients connect with others, thereby allowing them to communicate anonymously through private messaging. The feature makes a member’s ties list private.
The “my questions” feature is another service of the platform through which physicians answer members’ questions in public. As it happens, this is the only feature that lets patients be aware of each other.
We should note that the platform provides services in a country where the digital reputation of physicians via rating or (Bastian et al. 2009) other means is against the law. Due to the national regulations in the health sector, physicians are allowed to work full-time or part-time in different types of hospitals (state, university, private) or clinics.
Description of the network data and visual analysis of network diagrams are produced with Gephi (Bastian et al. 2009) and SNAP (Leskovec et al. 2007). Gephi is a visualization and exploration platform for SNA and SNAP is a C++ based network analysis library. Both of them are open-source and free software.
We model tying wishes and the resulting ties as discrete networks. Our approach permits us to explore both the habitual tendencies of the members in initiating ties and the resulting ties separately. Thus, we have prepared two data sets. The first data set of tying network (Dunn and Westbrook 2011) involves all of the tying activities, whereas the second set of tie network is exclusive to the resulting ties.
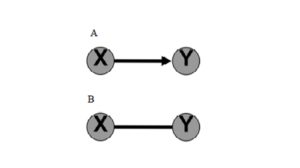
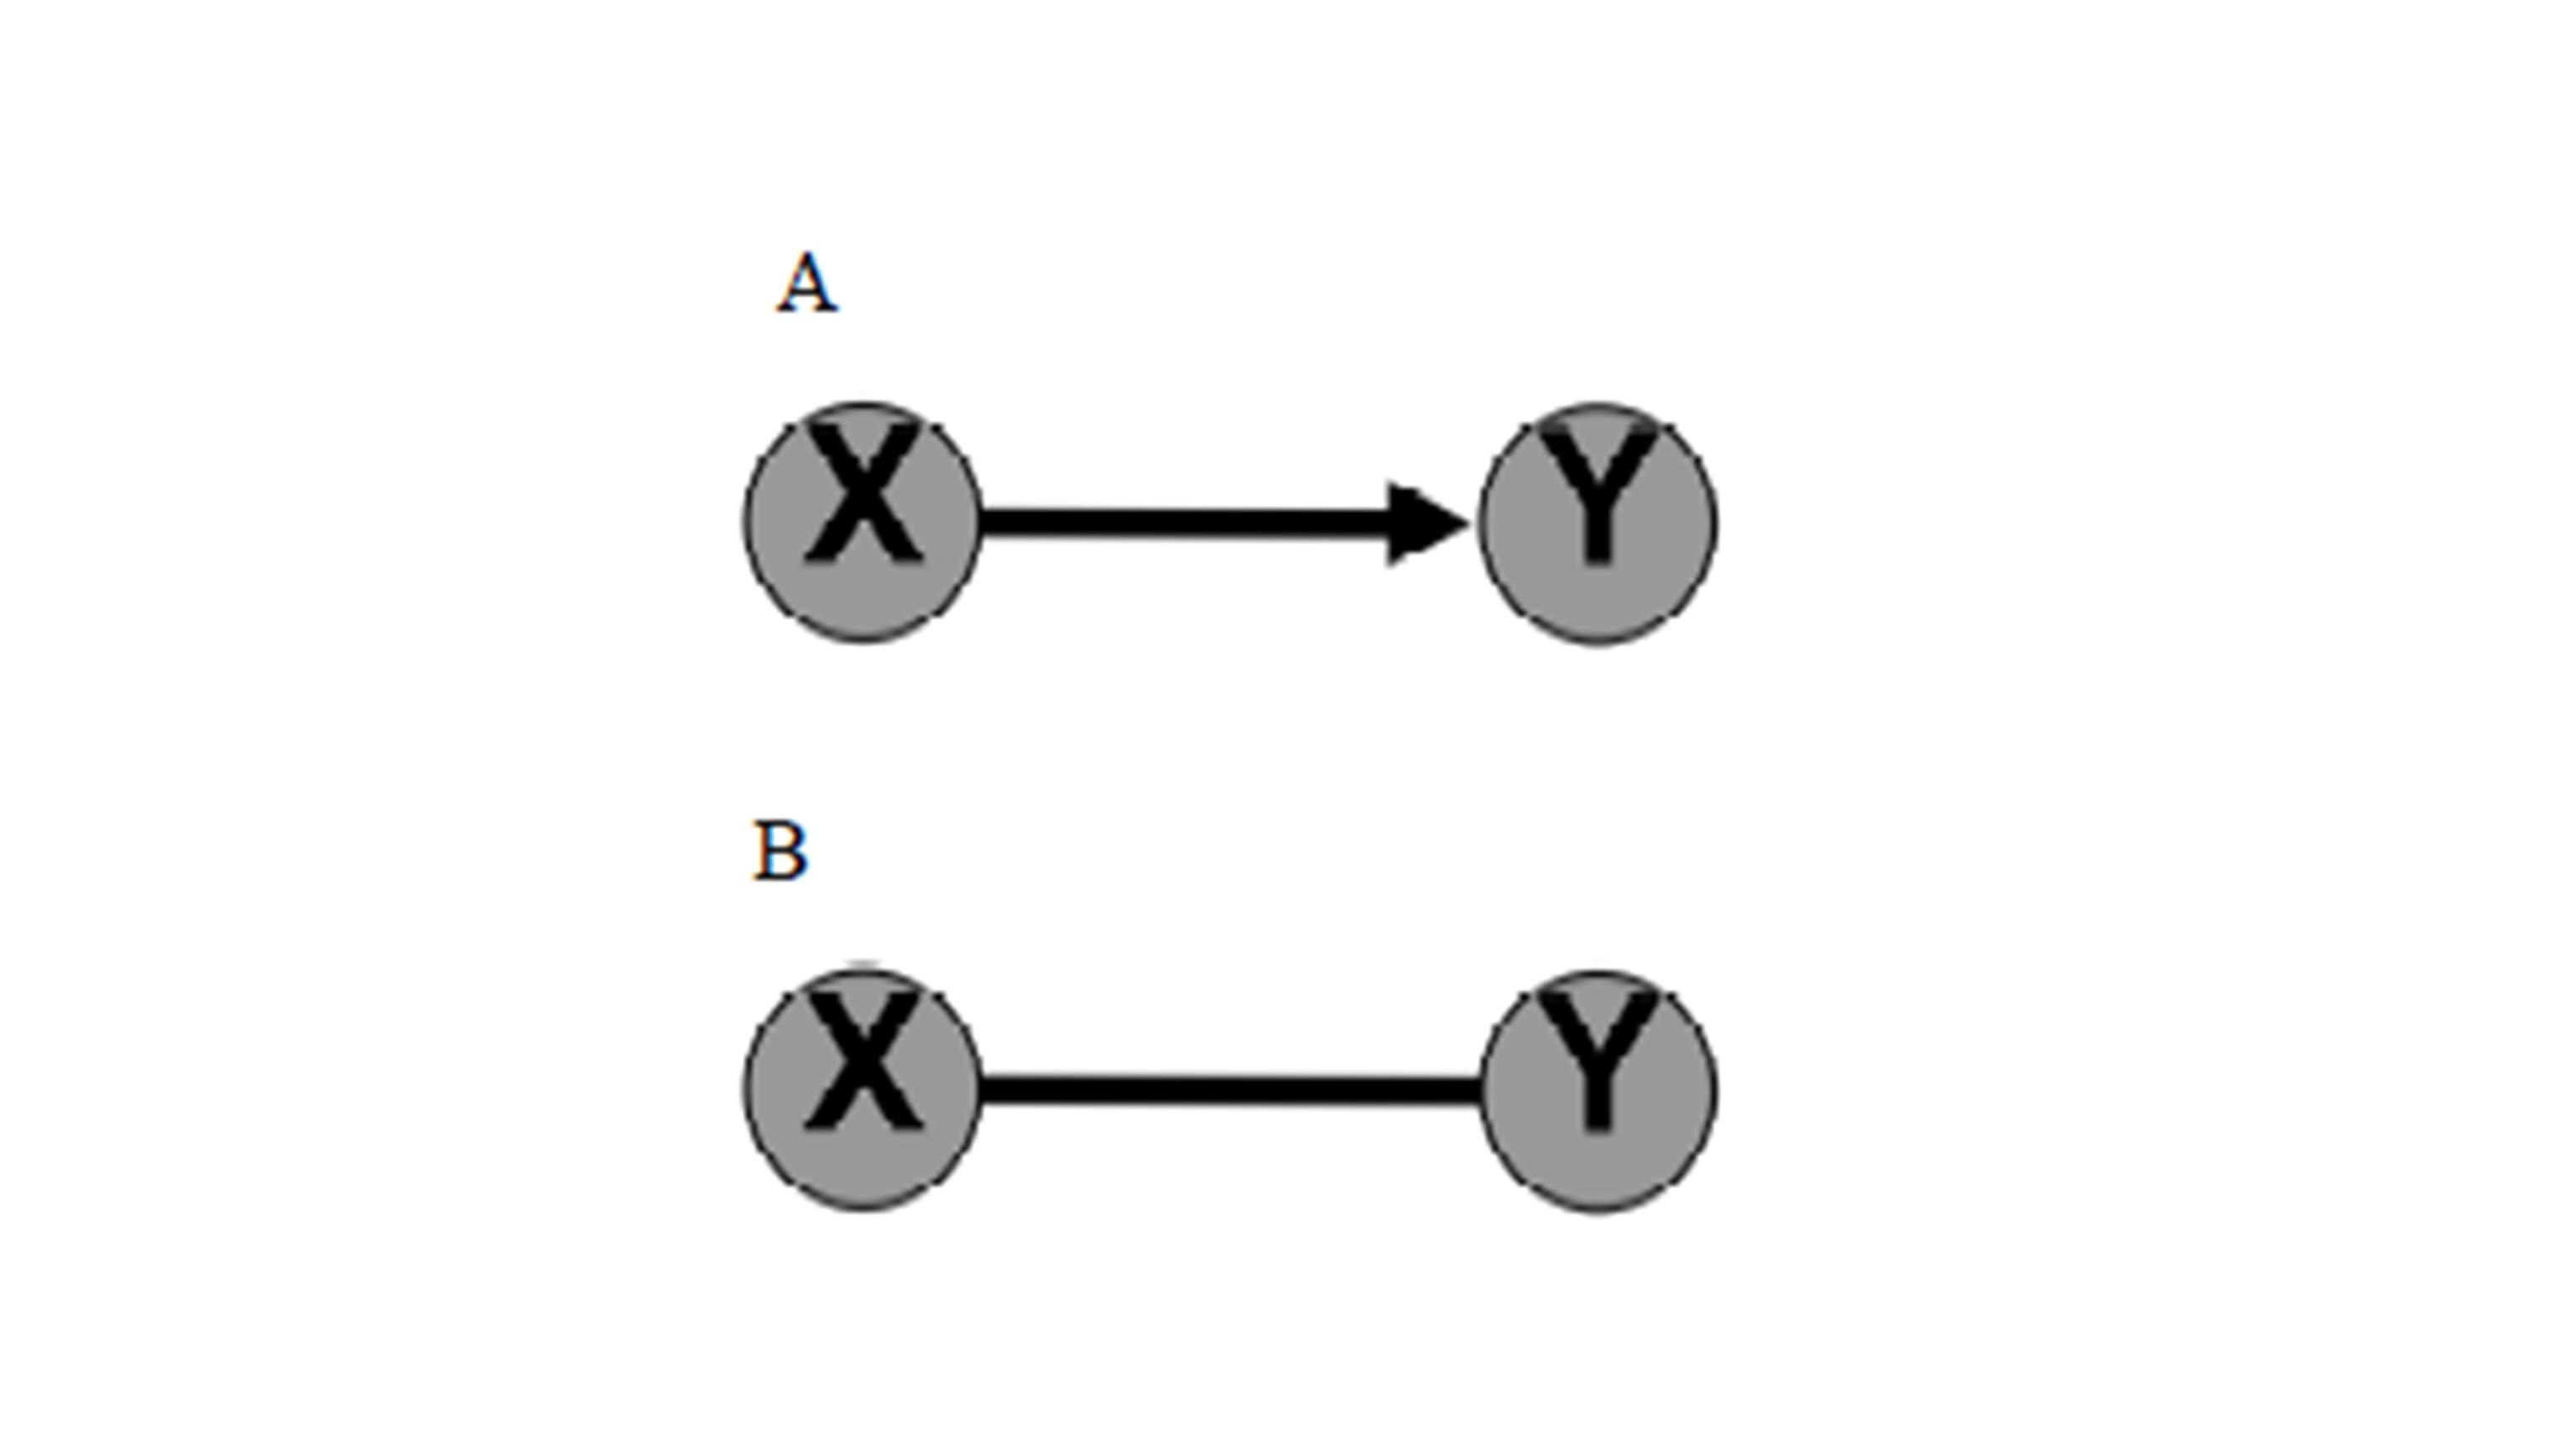
Figure 1: Panel A and B for Tying and Tie network respectively.
For the tying network, tying processes form a network in which the nodes are members and a directed edge from member X to member Y indicates that X wishes to make a tie (Fig 1. Panel A). For the tie network, tying processes result in a network in which the nodes are members and an undirected edge between members X and Y indicates that X and Y are tied. (Fig 1. Panel B).
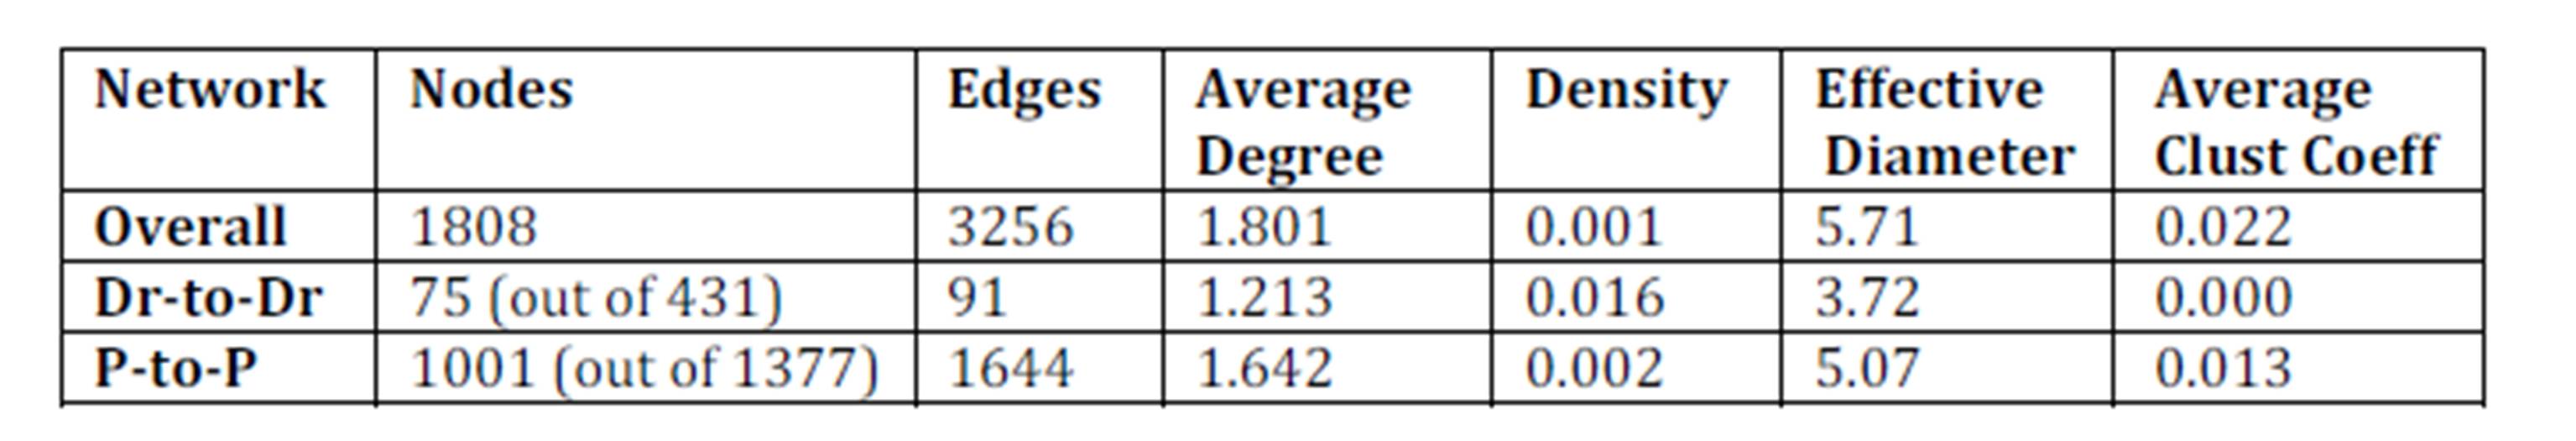
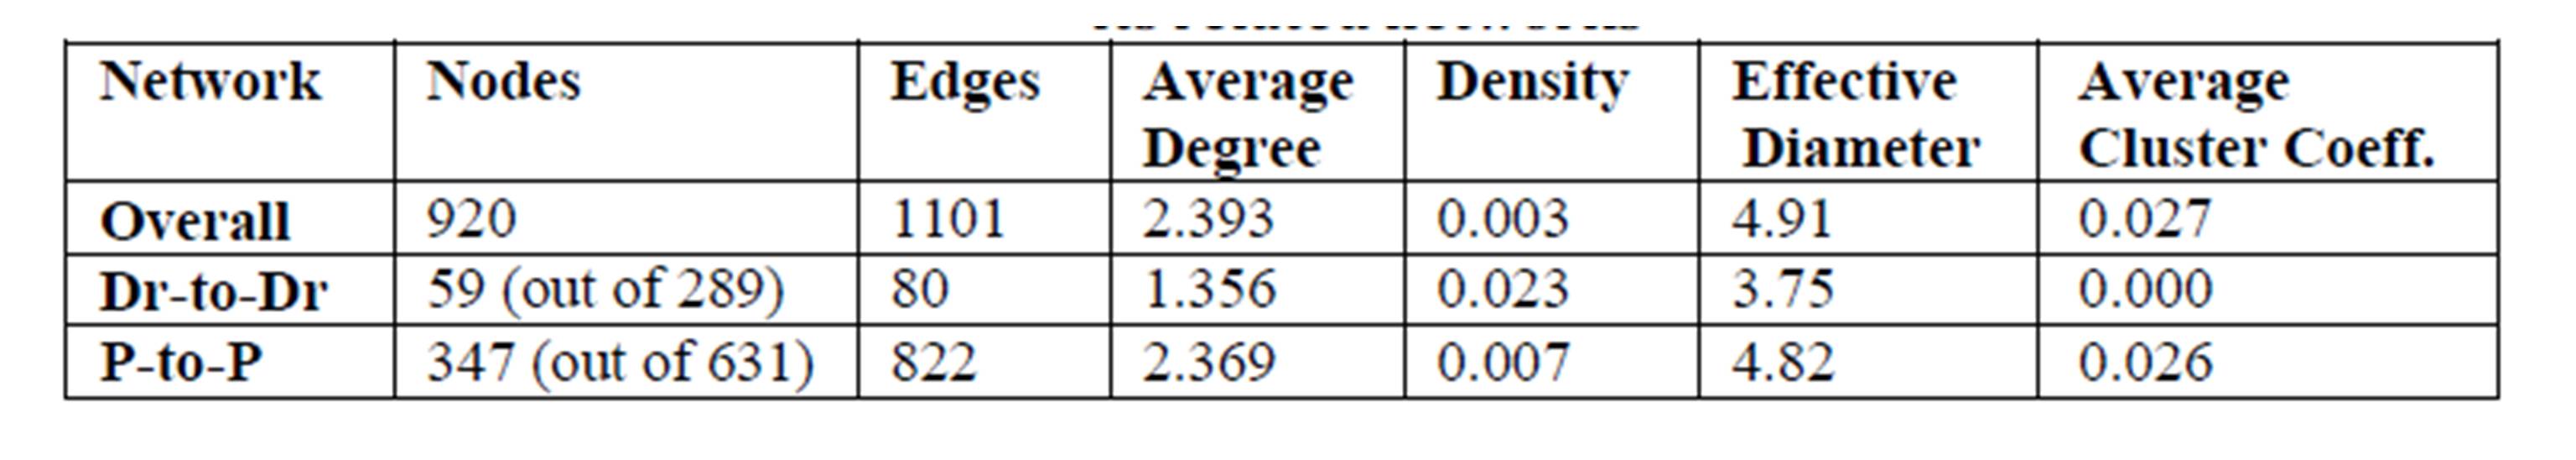
A graph of directed edges models the tying network and a graph of undirected edges models the tie network (see Fig. 1). On both graphs, nodes represent either patients (patient is abbreviated to P) or physicians (physician is abbreviated to Dr). Directed edges of the tying network represent the tying wishes. Undirected edges of the tie network, on the other hand, represent the resulting ties. Table 1 lists the basic statistics of the tying network as well as the tying wishes solely between Drs and Ps. Similarly, Table 2 lists the essentials of the tie network.
Two basic measures, node degrees and network density, provide useful, but limited, insights about the structure of a network. The former focuses on simple counts of in-degree (i.e. making a tying wish), out-degree (i.e. approving of a tying wish), maximum tying wishes, and the latter captures how highly connected nodes are by calculating the percentage of all possible connections between nodes that are realized.
To better examine an extent to which nodes are clustered (that is, clustering coefficient), one can measure the number of triplets of nodes where three nodes are connected by two edges (i.e. open triangle) or three edges (i.e. closed triangle). This is, essentially, a measure of the fraction of triads that have their third edge filled to complete a triangle. Clusters of nodes can create a significant portion of the overall network (called a giant component) or small components (Newman et al. 2002). We refer to a connected component in an undirected network as a cluster of nodes where there exist pathways between any two nodes in the cluster. For directed networks, if every node within a component has a pathway to every other node bi-directionally it is called a strongly connected component (SCC), otherwise it is called a weakly connected component (WCC) (Broder et al. 2000). We distinguish single size strongly connected components in a directed network as those nodes uni-directionally connected to just one of the nodes of a SCC (Nuutila and Soisalon-Soininen 1994).
Another important characteristic related to the global structure of a network is path length. Path length measures the distance between people in terms of the number of connections in the network examined. The maximum geodesic distance, called diameter of a network, is the largest distance of all, or the distance between people that are farthest from each other. Although the average path length and diameter give us an idea about how far apart people (patients and physicians) are, these figures are susceptible to outliers. Thus in addition to the average path length and diameter, we will also deploy the effective diameter among the path length measures, which is defined as the minimum number of nodes in which some fractions of all connected pairs of people (generally taken to be 90% of the nodes) can reach each other. The small-world effect is present if the effective diameter between every node is around six (Kleinberg 2000).
Results
Tying Network
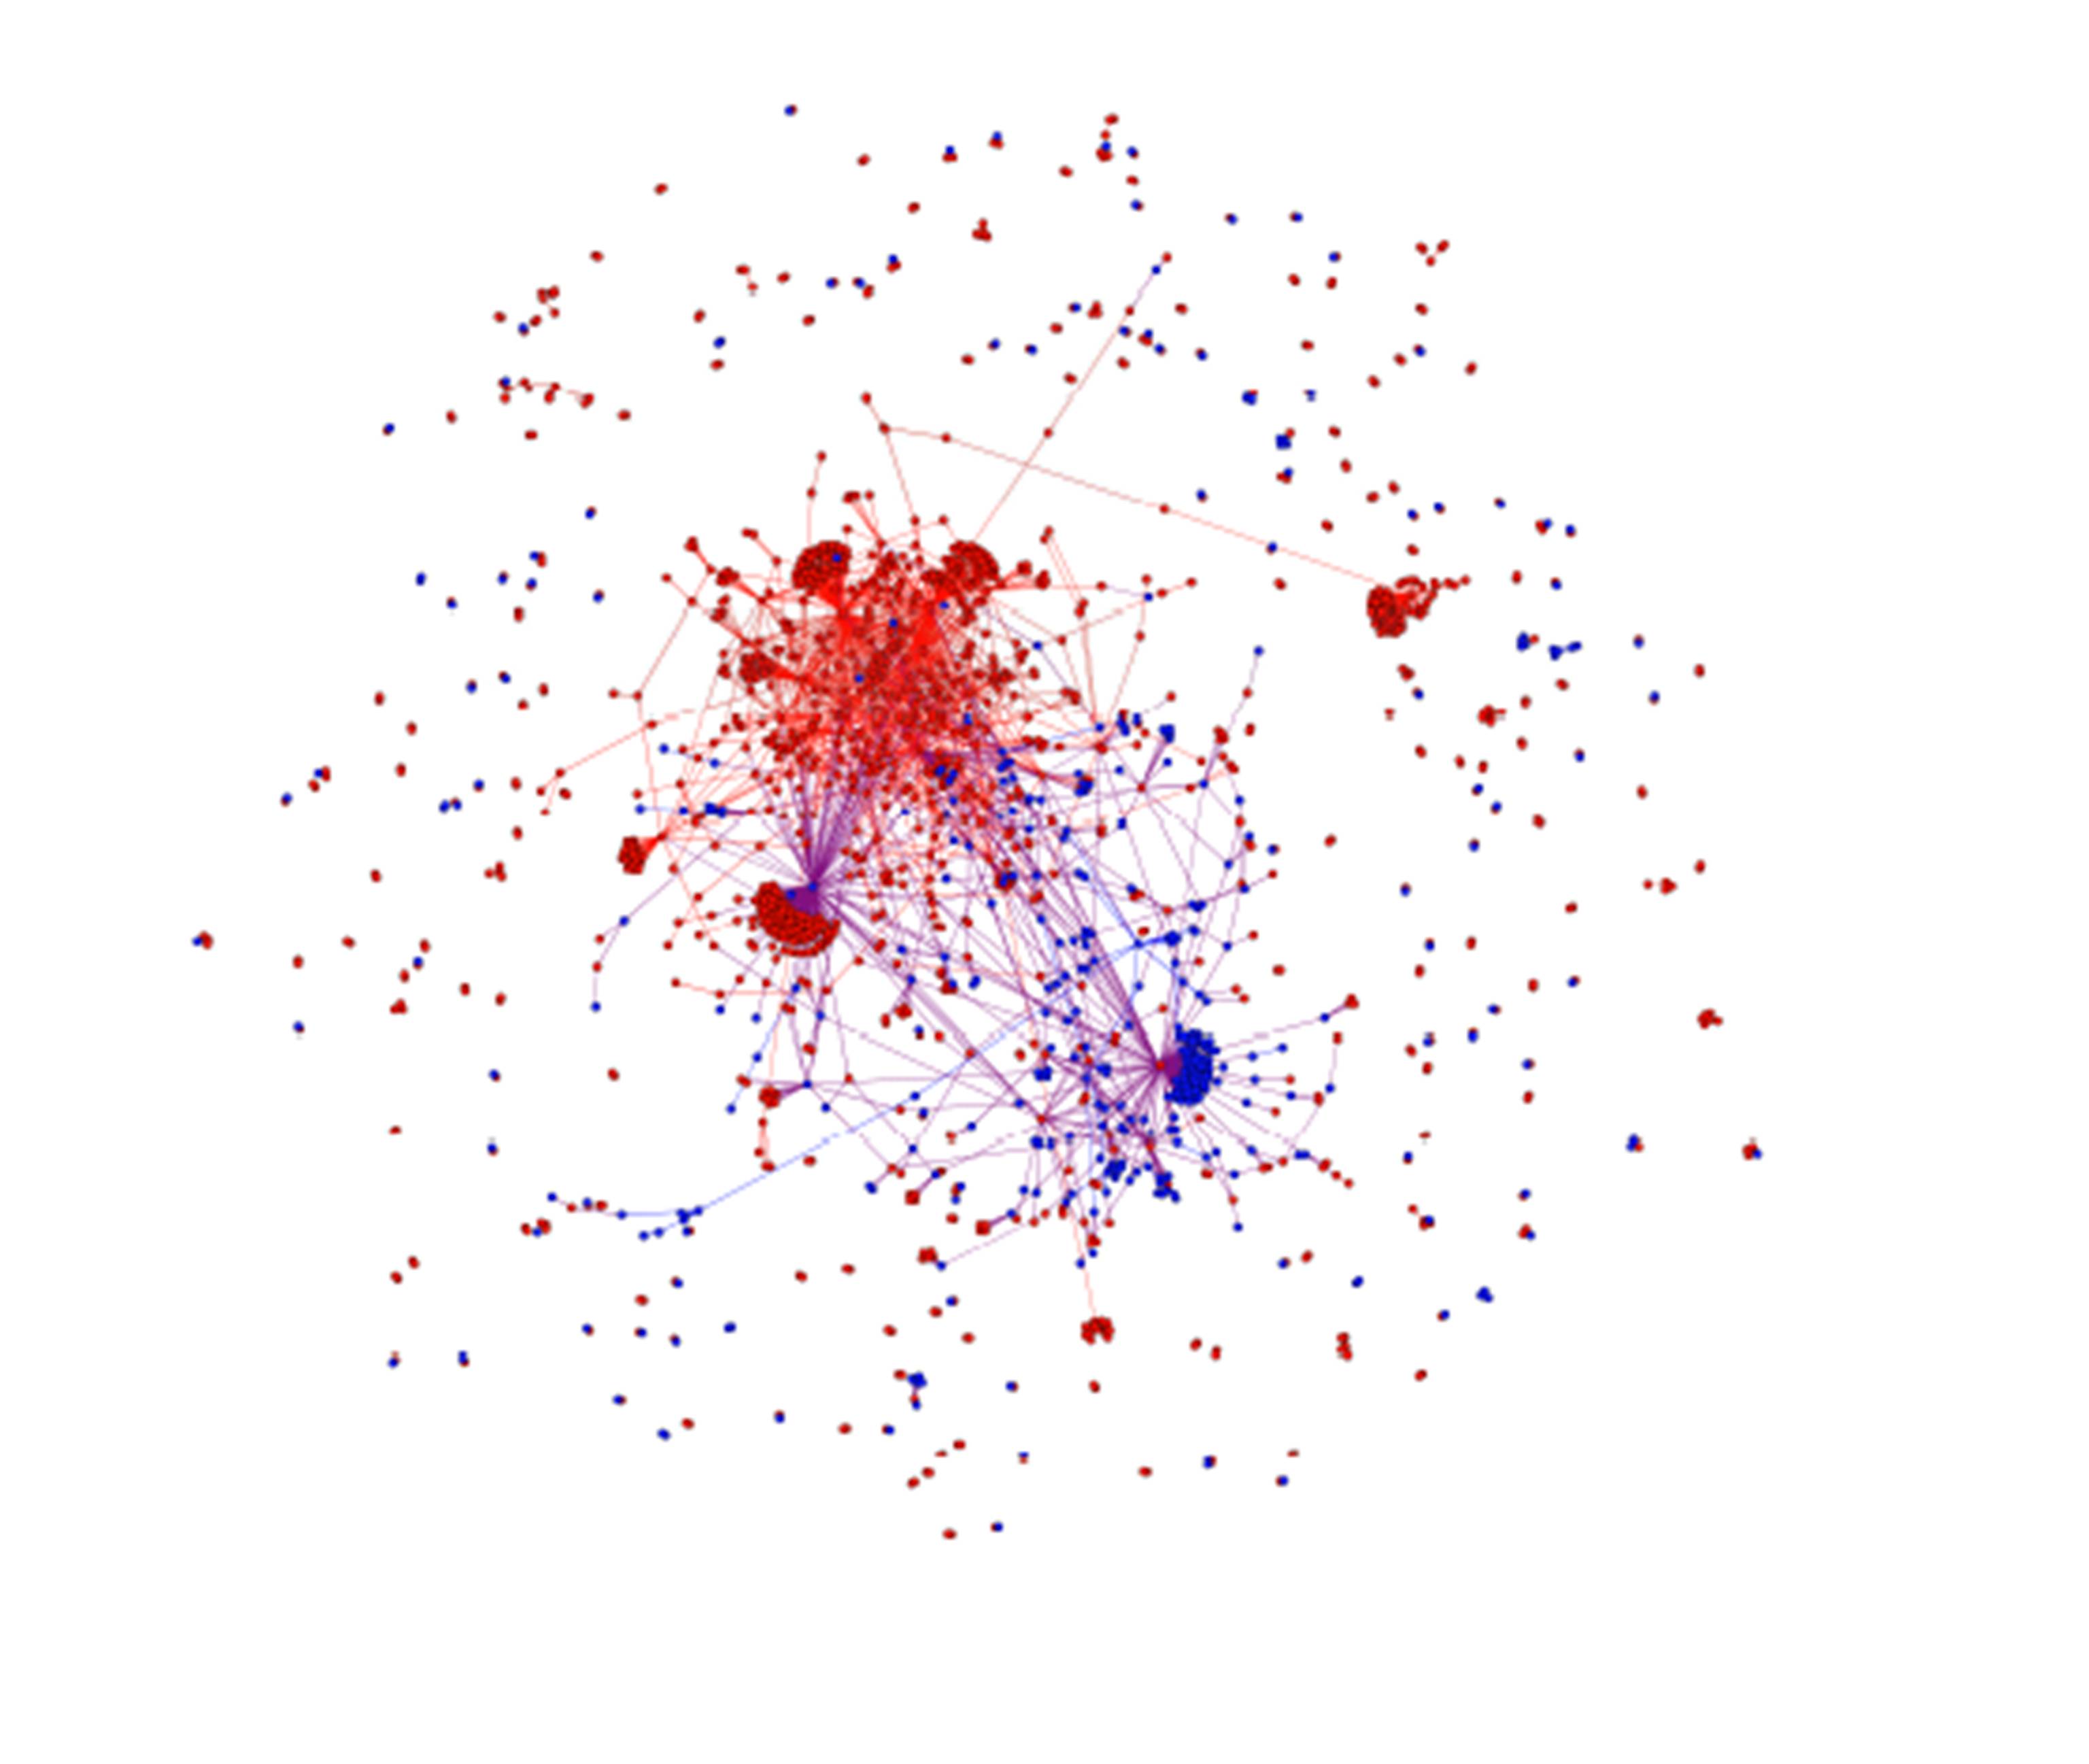
We present basic characteristics of the tying network for an overall network and two specific tying types (patients-to-patients, physicians-to-physicians) (Table 1). To better visualize edges between nodes we provide network models by alternative layouts. Fig. 2 utilizes ForceAtlas 2 layout algorithm to create a visual representation that brings out highly connected nodes.
Table 1: Summary of SNA measures for the overall tying network and two of its related networks

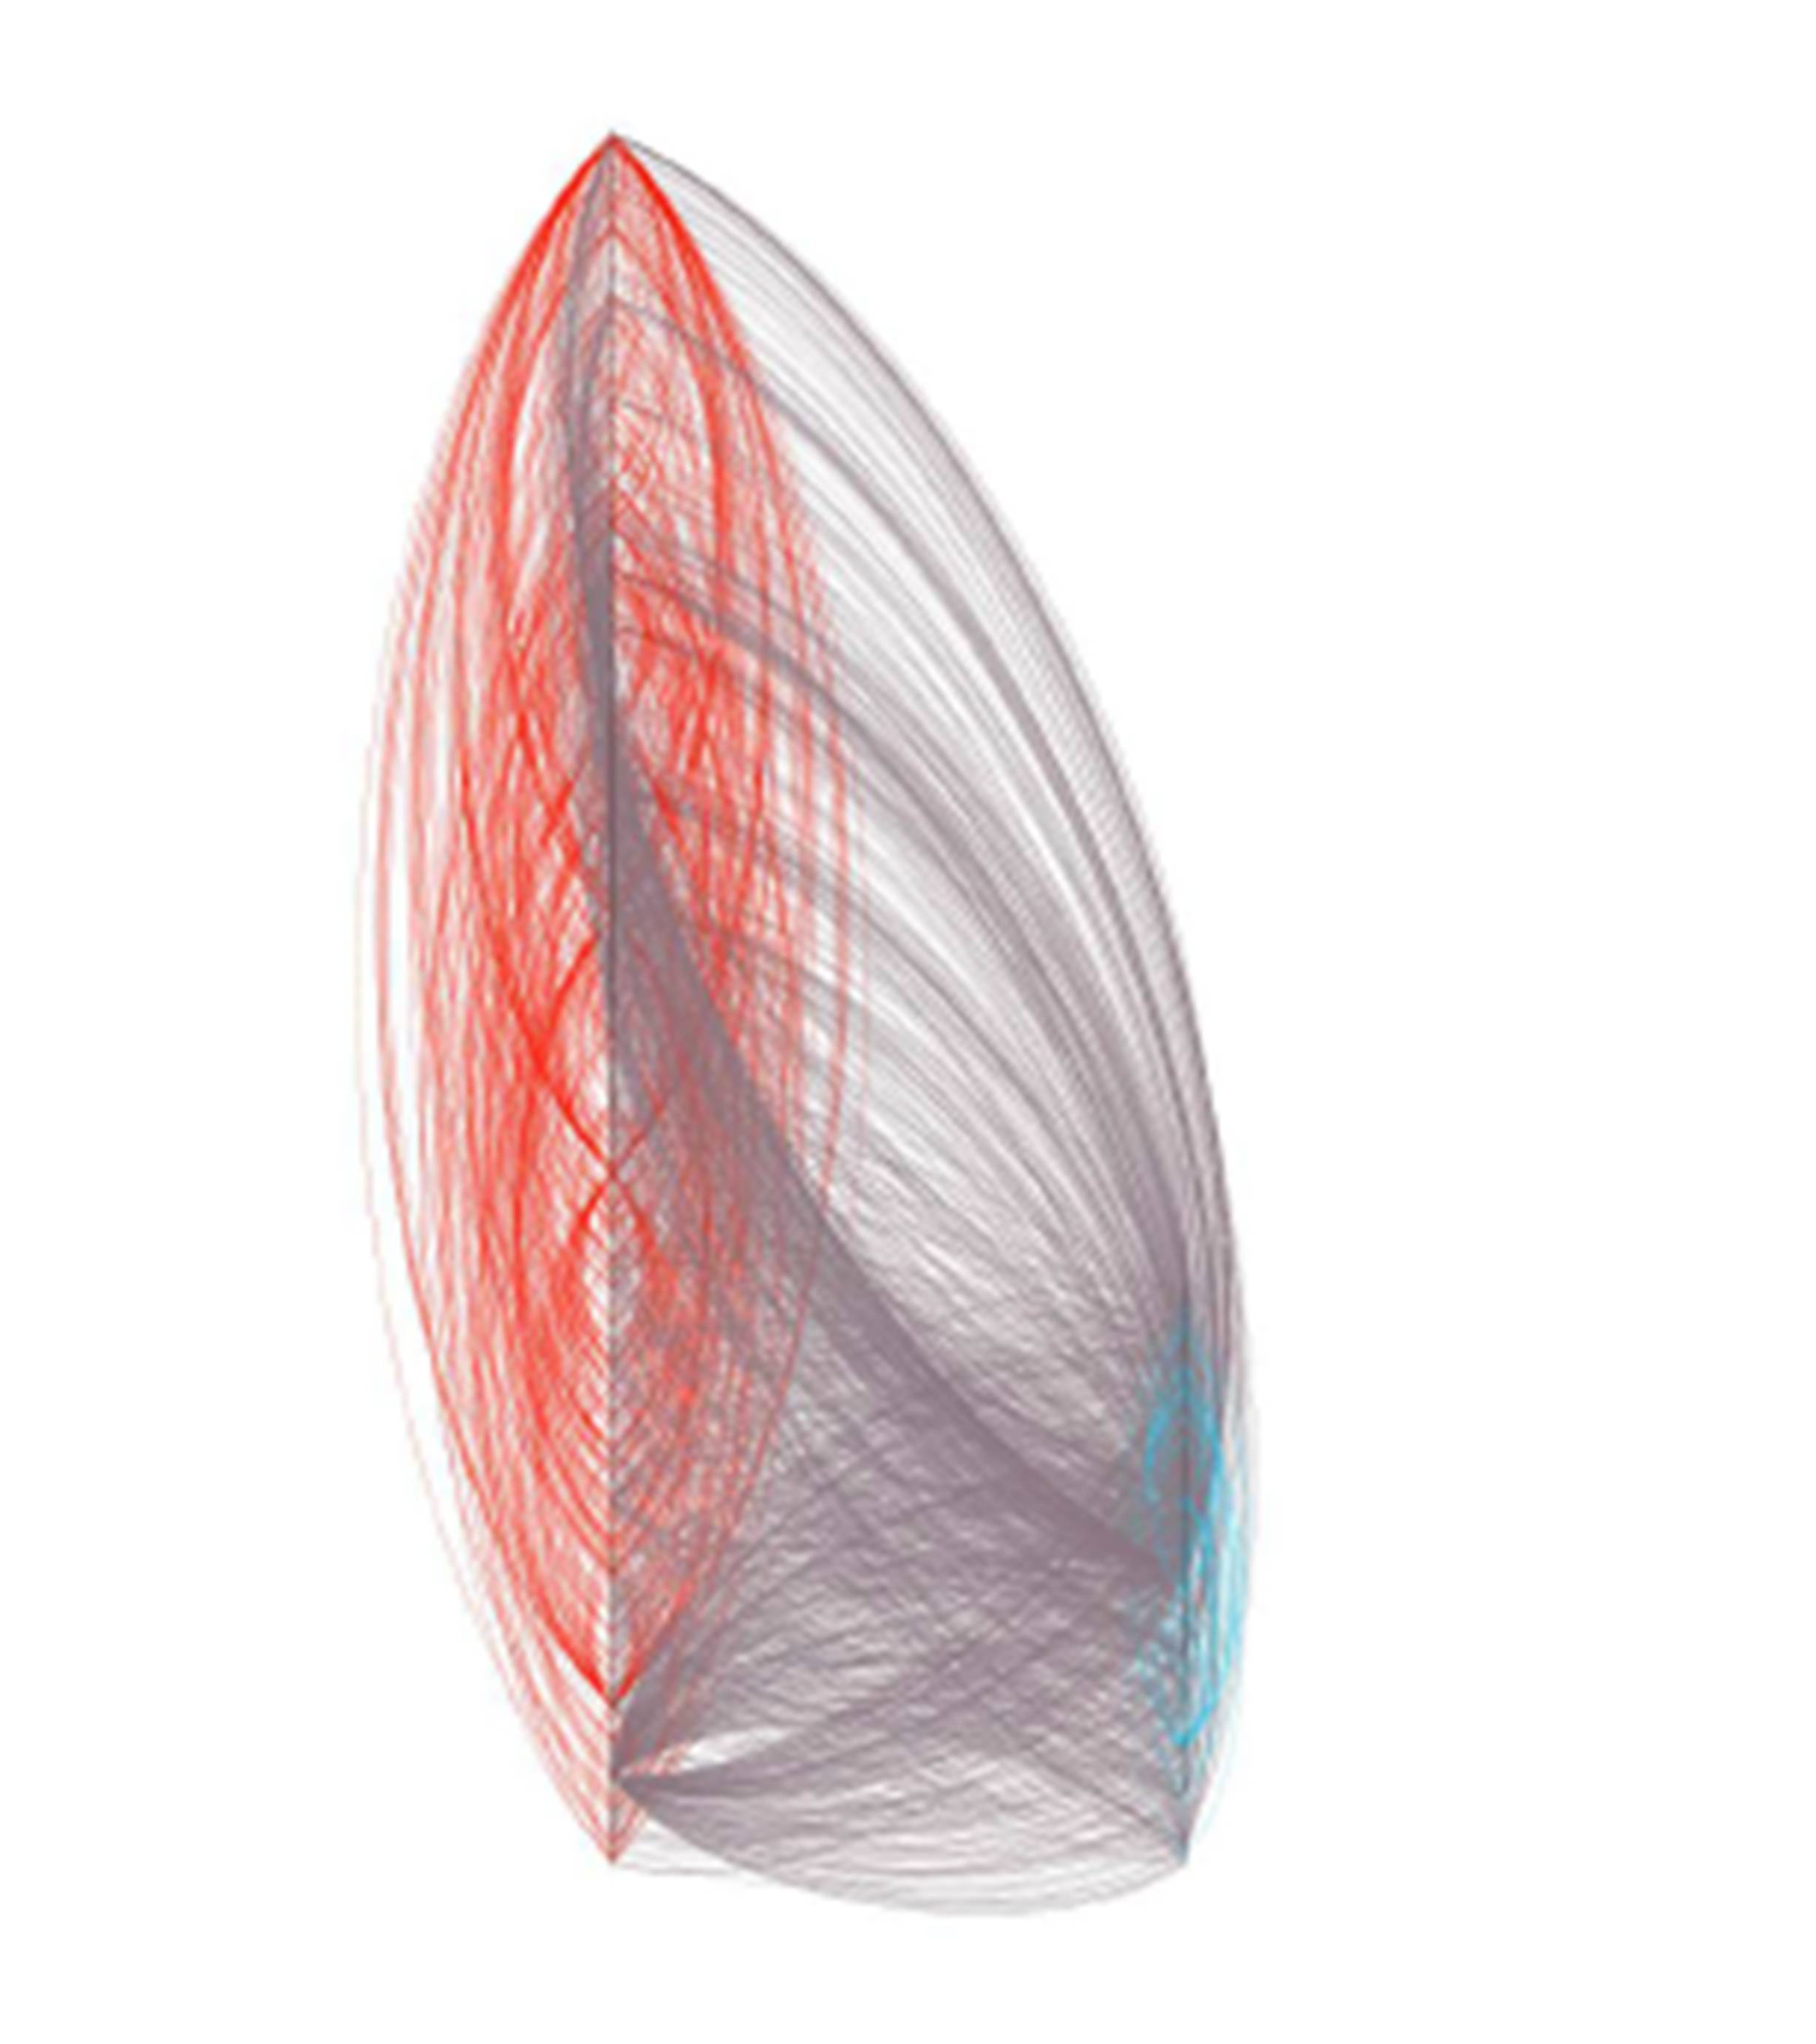
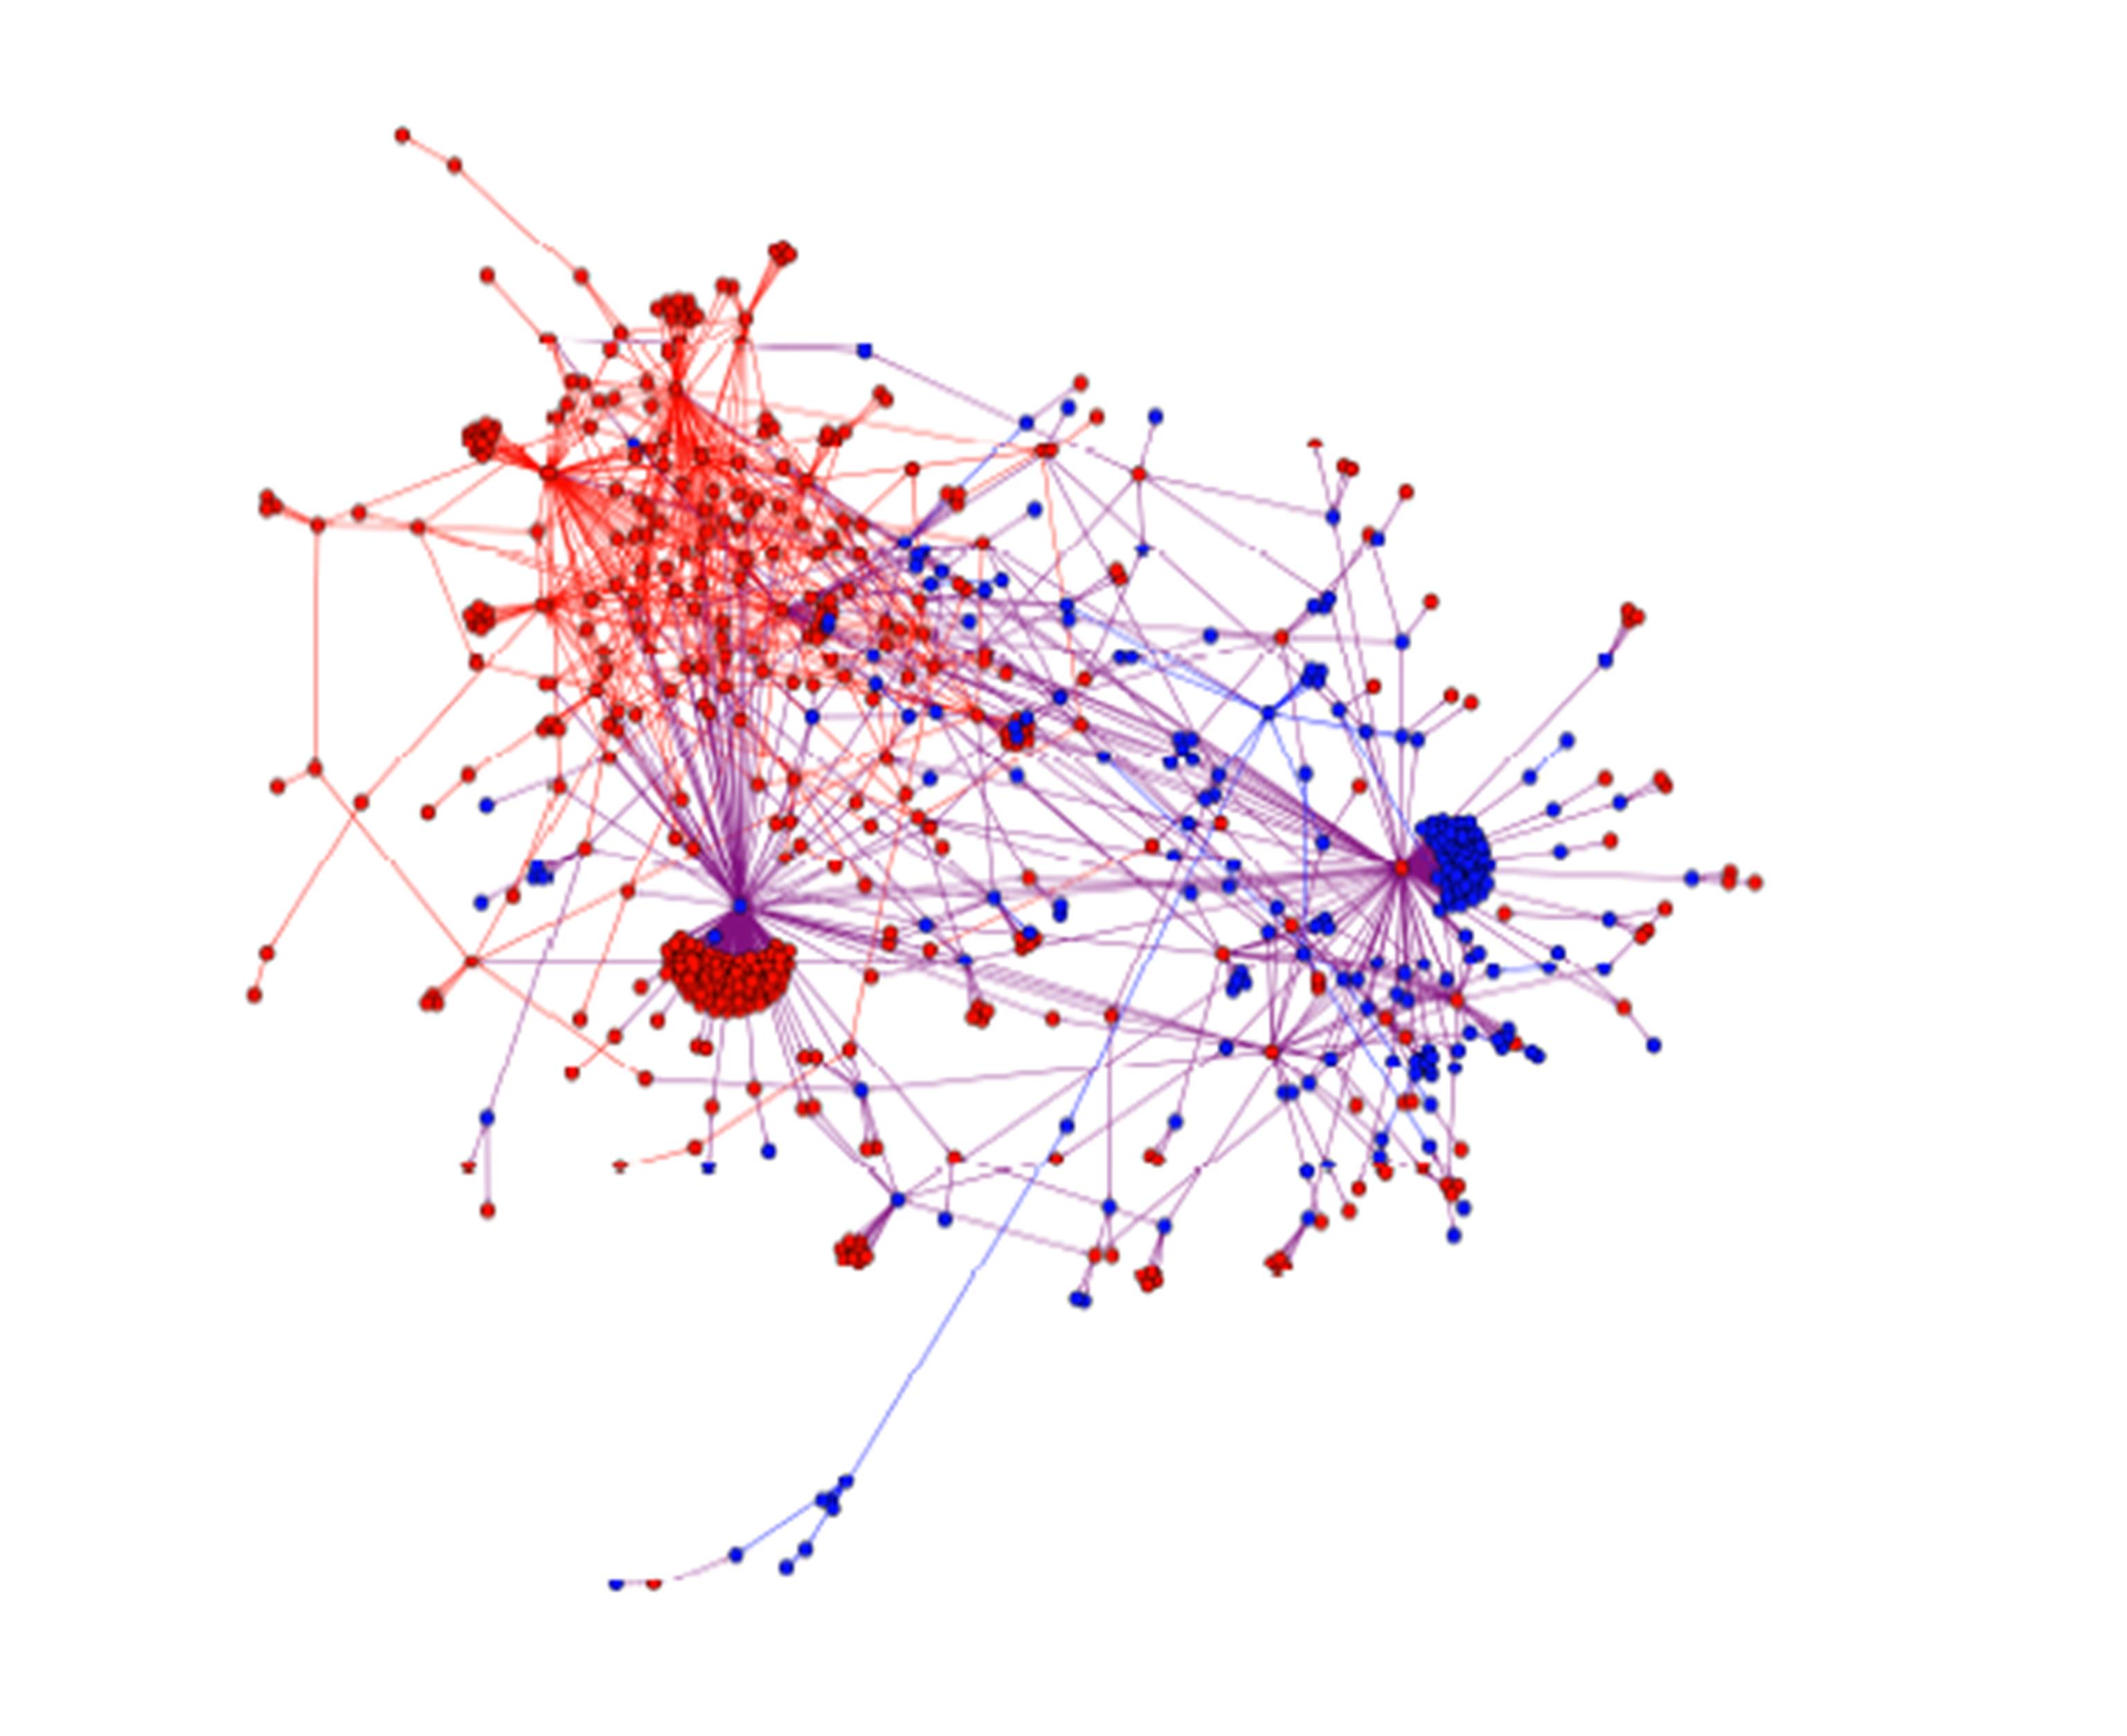
In Fig. 3, the graph is laid out using a customized layout algorithm (alphabetical ordering of the nodes of the same type on two vertical lines) where the Dr nodes are on the right and Ps are on the left. In this visualization, interactions between the same node types (red edges between Ps and blue edges between Drs, grey edges between dissimilar nodes) are clearly visible. Curved edges aid in improving visibility.
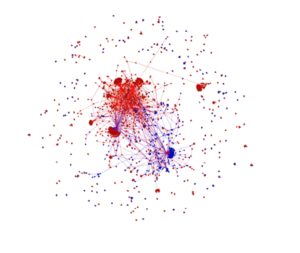
Figure 2: The visual representation of the tying network by ForceAtlas 2 layout algorithm
In Fig 2., one can see the result of the algorithm that creates a graph where two nodes are spatially closer if they have a tying relation as it accentuates hubs. Blue nodes correspond to Drs and red nodes indicate Ps.
The directed network of tying wishes has N = 1808 nodes. 1377 of these nodes are Ps, which account for 76% of all nodes. 431 Drs account for the remaining 24%. The average degree per node is 1.801 suggesting that a typical member approves a bit less than two tying wishes or makes a bit less than two tying wishes. Yet, with the help of the degree distribution (Fig. 4), we see that this number is misleading, because the majority of members have made less than two tying wishes. Moreover, the mean number of tying wishes per Ps is 3.49 while it is 3.95 per Drs. On the whole, 75% of the members made fewer than two tying wishes, and 50% of them have only one tying wish approved. These nodes coexist with highly connected nodes, or hubs (that is, nodes having relatively higher number of edges). Looking at the frequency of tying wishes, we classify nodes with twenty or more directed tying edges as hubs of the tying network. There are 34 hubs, 6 Drs and 28 Ps. The largest two of these hubs have 378 (in-degree 169, out-degree 209) and 276 (in-degree 127, out-degree 149) directed tying edges (Fig. 2 and Fig. 3). The existence of a hub-and-spoke is a characteristic seen in many real networks, including an airline network (Reggiani et al. 2010) . That is, hubs have a tendency to connect to low degree nodes.

Figure 3: The overall tying network lay out by the customized layout.
Fig 3. shows the graph of the tying network, which is laid out using a customized layout algorithm (alphabetical ordering of the nodes of the same type on two vertical lines) where the nodes representing physicians are on the right and nodes representing patients are on the left. In this visualization, interactions between the same node types (red edges between Ps and blue edges between Drs, grey edges between dissimilar nodes) are clearly visible. Curved edges aid in improving visibility.
With the visual help of Fig. 2, one can see that the tying network is fragmented in the sense that there are 241 weakly connected components, 240 of which are around the central giant weakly connected component (WCC) (see the “outer rim” of the network). One of the characteristics of real networks is the emergence of a giant component. In the present work, the network analysis of components shows that the giant WCC comprises 66% of the network. More importantly, 57% of these nodes belong to a giant SCC (see Fig. 5). Consequently, 38% of the tying wishes took place in the giant SCC. 65% of Ps and 70% of Drs contribute to the giant WCC whereas 33% of Ps and 53% of Drs contribute to the giant SCC.
The average path length between all pair of nodes within the network is 4.03 and maximal distances vary between graph diameter of 12 and graph radius of 0. The particular radius value of zero means that there is no directed path between some pairs of platform members, which is quite expected due to the existence of WCCs. The 90-percentile effective diameter of the network is 5.71, which is reminiscent of the “small-world phenomenon”, widely recognized as “six degrees of separation” property that many real world networks share (Kleinberg 2000, Watts and Strogatz 1998). The tying network of the Doktorsitesi is another small world.
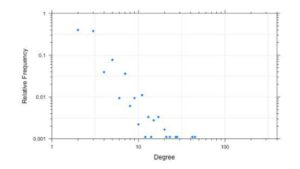
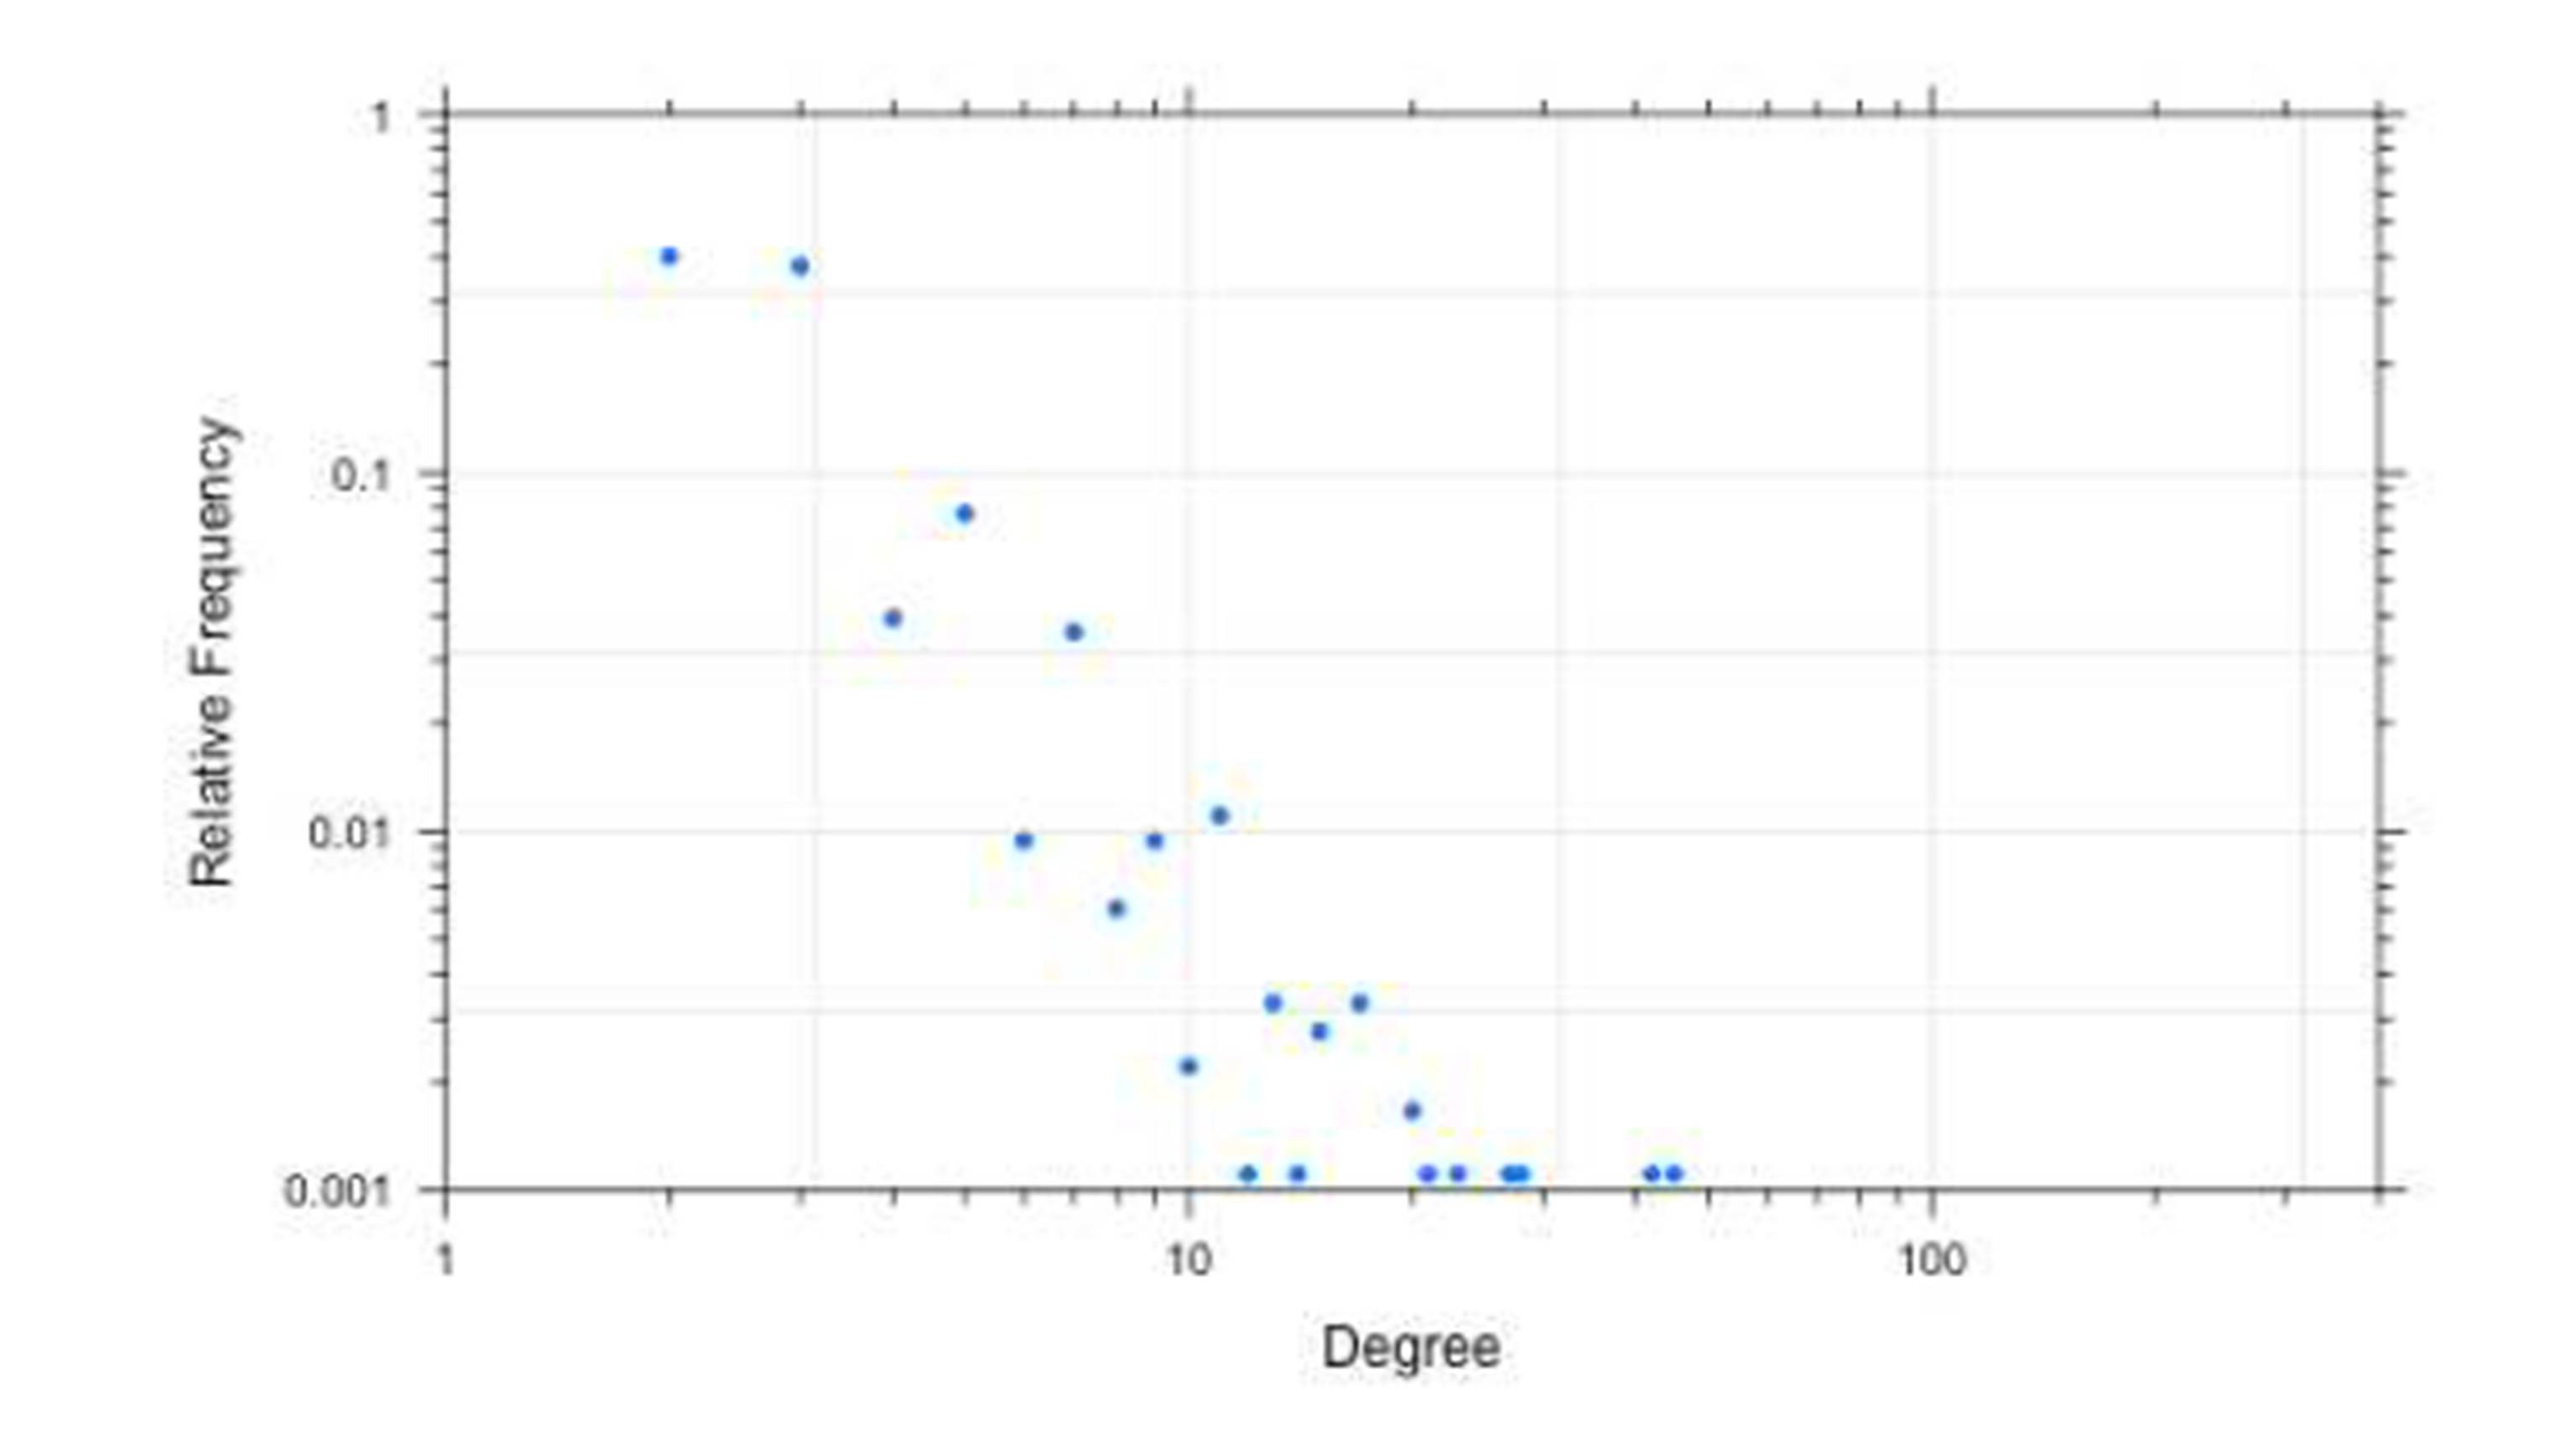
Figure 4: Degree distribution
The degree distribution (Fig. 4) is a relative frequency distribution showing the relative frequency of tying wishes of each member. Thanks to the very few highly connected members, it is shown on a log-log plot. We consider members who have made twenty or more tying wishes as hubs. Degrees of the two largest members appear on the far right.
The density of the overall network is 0.001. It is a sparse network like most of the real-world networks. Tying wishes exclusive to Ps and Drs are even sparser (Fig. 2). The average clustering coefficient or “measuring triangles” is 0.022. Note that clustering is measured by making the network undirected, which is not uncommon in network science (Albert and Barabási 2002). This clustering value is somewhat higher than the clustering of a random network of the same number of nodes (1808) and edges (3256). There is less clustering between Ps and none among Drs (Table 1).
In general, a directed network can form seven distinct closed triangles (i.e. Node A (and/or B) requests node B (and/or A) to approve of a tie, Node B (and/or C) requests Node C (and/or C) to approve of a tie, and Node C (and/or A) requests Node A (and/or C) to approve of a tie (Ahnert and Fink 2008). For this particular directed network, we detected 33 closed triangles and 78191 open triangles (i.e. any one of the third edge is missing). Thus, the fraction of closed triads is just 0.000422, which suggests there is hardly any triadic relations. These triadic relations take place all together within the giant WCC.
A closed triangle of directed network edges does not necessarily imply fully reciprocal tying wishes (Madhavan et al. 2004). A deeper investigation reveals that only fifteen of these thirty-three closed triangles comprise fully reciprocal triadic relations. All of these fifteen closed triangles take place between twenty-one Ps and three Drs.
The maximal hub (a Dr member) participates directly in sixteen triadic tying wishes. No closed triangles are detected solely between Drs and only fourteen closed triangles are detected between Ps six of which are fully reciprocal.
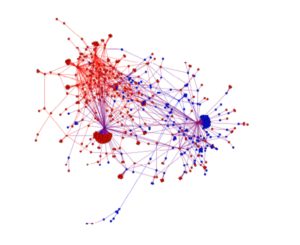
Figure 5: Graph of the giant strongly connected component (SCC) of the
Overall tying network
Tie Network
On the whole, 68% of the tying wishes are reciprocated. 75% of the tying wishes between patients and physicians are reciprocated, whereas only 34% of them are reciprocated among patients, and 78% are reciprocated among physicians. The tie network focuses on those tying requests that are reciprocated. Table 2 lists the basic characteristics of the network of ties.
The same layout algorithms help us visualize the tie network. While Fig. 6 is a functional visualization to see the decrease in the number of P nodes, Fig. 7 demonstrates that this decrease is accompanied, to a large extent, by a decrease in the number of edges between Ps. To be able to make a one-to-one comparison between Fig. 3 and Fig. 7, we preferred to represent the tying interactions as a directed network having two edges between each pair of connected vertices, one in each direction (Newman 2003).
Table 2: Summary of SNA measures for the overall tie network and two of its related networks

A tie edge signifies a bilateral agreement with reciprocal right to send an unlimited number of messages. We separated the tie network from the tying network simply by removing single size SCCs (Nuutila and Soisalon-Soininen 1994). The search for these members revealed that there are 216 such occurrences. The size of the tie network thus obtained is 888 nodes less than the size of the tying network. Furthermore, we determined that 84% of the nodes that we eliminated from the tying network are Ps. Accordingly, 691 of 1644 Ps and 289 of 431 Drs established ties within three months of data taking. The presence of Ps is down five percent (from 76 to 69%); hence Ds are up from 24 to 31% in comparison with the tying network. Moreover, the number of edges is down 32% (from 3256 to 2202).
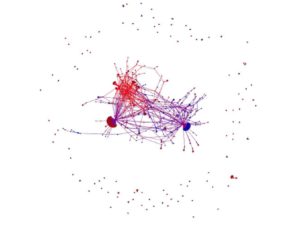
Figure 6: The Force Atlas 2 layout algorithm puts tied nodes in close proximity.
The two maximal hubs are quite visible on the left and right of the central giant component (GC) (see Fig 6.). Small-sized connected components are placed on the outer rim. Blue nodes correspond to Drs and red nodes indicate Ps.
The undirected tie network of Fig. 6 has N = 920 platform members as nodes and L = 1101 established ties between them as edges. In consequence, the average degree of ties is 2.4, indicating that a common member interacts with two to three other members. It is due to the existence of hubs, the majority of members have engaged in only one tie. To be more specific, 638 members have engaged in only one tie, 136 of them in two ties, and the surviving 27 of the 34 hubs of the tying network have more than ten ties. Two of these hubs are especially notable for their high tie-degrees with 169 and 127 ties (see Fig. 6), as we have already stated in the tying network. Equivalently important is the disappearance of the seven hubs. First of all, all of these hubs are Ps. Second of all, five of them are absent because of the fact that they did get approval of around 90% of their tying wishes. Clearly, there is a difference between Drs and Ps in terms of fulfilling the tying wishes.
The average path length between all pairs of nodes within the tie network is 3.940 and maximal distances vary between graph diameter of 11 and graph radius of 1. The 90-percentile effective diameter of the network is down to 4.91 as compared to 5.71 of the tying network. In just three months of interactions, ninety percent of platform members are “less than five people apart” should they wish to communicate with each other.
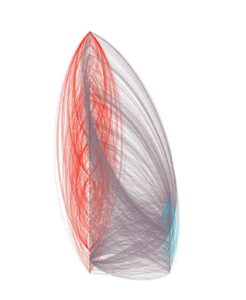
Figure 7: The overall tie network by the customized layout
In this undirected network model of ties, the giant SCC of the previous model becomes a giant component (GC) (see Fig. 5). 74% of all nodes and 87% of all tying edges belong to the GC (the central part of Fig. 6). Also, all of the twenty-seven hubs are situated within the GC. It is a remarkable fact that 97% of all ties within the tie network are dyadic in nature. These results are encouraging enough to merit further investigation.
Discussion
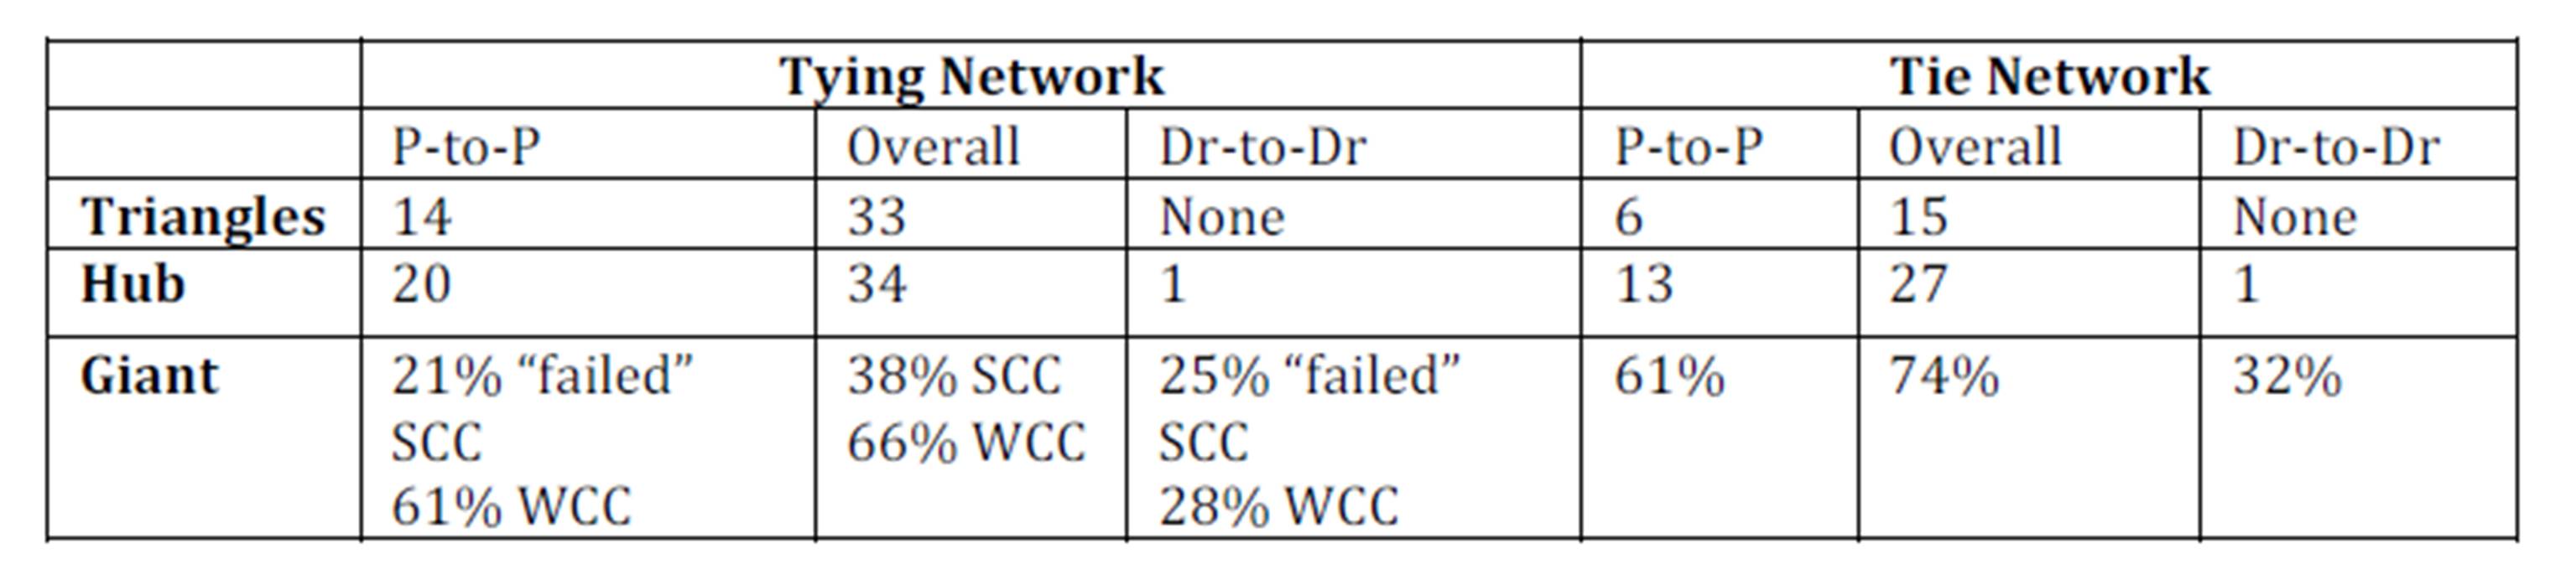
The tying network and the tie network examined exhibit essential structural properties that characterize most real-world networks (e.g. WWW, Power Grid, Movie actors etc.) including degree distribution, giant components and hubs, small-world phenomenon, and peculiar dyadic-triadic relations (Strogatz 2001). Thus, we contend that the ties (that is, connectivity of individuals) on the platform are not established by chance or randomly, but consequences of conscious choices of members. Table 3 summarizes key findings of structural properties of both tying and tie networks.
Small-World of Patients and Physicians
The effective diameters of tying and tie networks are 5.71 and 4.91, respectively, suggesting that 90 percent of those people using the tying feature of the platform need at most five intermediaries to reach each other. The networks examined are a good example of small world. It appears that whoever starts establishing new ties enters into this small world where the majority of the people are only five handshakes from anybody else. But, notice that the members (patients and physicians) do not know how far apart they are, so they are not aware of being so close to others. Knowing of this fact may have a different meaning to various actors. For platform managers, this piece of information is essential to better understand the distance among members hence is critical to manage the platform effectively. Regarding members, they may not be aware of the fact that they are part of a giant component. In some social networks platforms (e.g., LinkedIn), members are notified for how far apart they are and who the intermediary is while requesting or approving a tie. Consequently, one needs to examine the effects of patients’ and/or physicians’ awareness of small-world on the use of platform and henceforth the tie relations.
Now, we shall turn our attention to other structural properties. We consider two relevant mechanisms to discuss the connectivity of individuals in these ever growing networks examined: preferential attachment in complex networks (Barabási 2009, Newman 2001) and homophily (as opposed to heterophily) in social relations in general (McPherson et al. 2001) and in tie formation in particular (Centola and van de Rijt 2014). The idea of preferential attachment is used to explain how a new member is added to a small world network as it grows. That is, when networks are subject to growing, a new member may prefer to attach themself to some attractive members than the other members for some reasons. The notion of homophily (which is opposite of heterophily) is adopted to indicate that people in a network tend to be socially tied to others who are similar to themselves than would be expected by random choice (Coleman 1958, Matook et al. 2013, Rogers and Bhowmik 1970).
Table 3: Summary of key findings for the tying and tie networks

Technically, growth and preferential attachment result in “the rich get richer” process, leading to the emergence of hubs. In our context, there is a subtlety to this argument. It is the premise of the preferential attachment, that highly connected nodes acquire more links than those that are less connected. But, this cannot directly explain why some members attract more attention as the tying/tie networks grow; because no one knows who highly tied is. Yet, one needs to take into account a piece of related information: some of the members come to prominence both on the platform and on the Web via the “my questions” feature and these members become “the rich” of the growth. People choose “the rich” members to maintain ties and these choices are based on their homophilous preferences. The “rich” of the growth and preferential attachment mechanism are not the ones who are highly connected, but the ones who come to prominence both on the platform and on the Web via the “my questions” feature and share similar characteristics with other members.
Essentials of Dyadic and Triadic Relations
Small groups are often represented as triangles (indicating triadic relations) and measured by clustering coefficient. Recall that clustering coefficient is extremely low (0.022 and 0.027 for the tying and tie networks, respectively) and similar values have been observed in some real networks (Newman 2001). Low clustering simply means that there exist hardly any triadic relations; in other words, dyadic relations prevail in the overall network.
More specifically, the number of triangles in the tying and tie networks deserves further examination (see Table 3). The number of triadic relations of tying and tie networks is 33 and 15, respectively. Eighteen attempts at forming triadic relations fail mainly because ten patients and one physician never approve any of the tying wishes. This might be due to the fact that those ten patients want to preserve their anonymity.
There exist only fourteen triangles in P-to-P tying network, six of which made their way through the transition into the P-to-P tie network (see Table 3). As it happens, all of these six triangles are formed as a result of tying wishes made for seven patients who turn out to be the ones who never fulfill tying wishes. Consequently, six triadic relations remain in the P-to-P tie network. As we have already stated, one can relate these failures of triad formations mostly to health taboos (Moyer-Gusé et al. 2011, Newman et al. 2011, Wentzer and Bygholm 2013, White and Dorman 2001) or patients’ choice to stay anonymous. This observation implies that triadic relations among patients on such an interactive health platform are rare. Other reasons may include, for example, the presumption that patients having similar health related issues might hesitate to exchange messages indefinitely. After all, the idea of exchanging an indefinite number of messages with another patient may not be as appealing as with a physician (Bosslet et al. 2011).
There are only fifteen closed triangles in the overall network. We have detected that most of these triads are located around one physician who has engaged in triadic relations with eight patients. According to the time stamps, in all these eight triadic ties, this physician is involved in the initiation of the first tie, and in four of them, in the initiation of the first two ties. Furthermore, the node representing this physician is the largest hub of the network, as it happens. Established triadic relations around the same physician can mostly be ascribed to the personality of the physician. The relative position of this physician in the network is in stark contrast to that of the second highly tied member, representing a patient who has engaged in only one triadic relation. This is a peculiar case in that even if one can speculate some reasons such as marketing purpose or spam, it is hard to understand why that patient prefers to maintain strong ties with physicians. We shall further examine this case with the discussion of hub-and-spoke character.
Dyadic relations are present mostly between physicians and patients, moderately among patients, less among physicians. There can be several reasons for this. Establishment of dyadic relations can be examined from physicians and patients’ perspectives. From physicians’ point of view, preferring dyadic relations with patients might be due to reaching potential patients. Due to industry dynamics and national regulations, physicians have the opportunity to work full-time and part-time in state, university and private hospitals. Thus, physicians might prefer dyadic relations to create public awareness not only for the sake of the public but also to increase their public impression. This may eventually help them improve their career advancement opportunities.
From the patients’ point of view, dyadic relations are naturally expected due to motivation for medication advice seeking in the platforms or considered as comfortable means to establish relations with physicians (Bosslet et al. 2011). The tie network provides patients with seamless communication with preferred physicians and/or patients. Selectively accessing physicians can be associated with exclusive communications, which in turn call for trust aspect of the established ties.
As indicated in relevant studies, medical specialties are informally ordered in a hierarchy (Album and Westin 2008), so in relations. The very idea of hierarchy can be considered another factor for avoiding dyadic relations among physicians. Given regulated dynamics of the health sector, competition among physicians is expected. So, physicians may not be willing to share their connections with others to lose potential patients.
Lack of dyadic relations among physicians is worth noticing. Recall that only 75 out of 431 physicians in the tying network and 59 out of 289 physicians in the tie network exhibit dyadic relations. The fact that there are a few of reciprocated tying wishes among Drs may suggest that they are reluctant to establish ties with their peers. The underpinning of this reluctance can be related to heterophily, as (Mascia et al. 2011) findings indicate that homophily in some characteristics, such as “years since graduation”, “number of publications”, and “managerial role” reduce physicians’ propensity to collaborate. Another reason would be physicians’ perception on health information platforms, which is already acknowledged (Bosslet et al. 2011) that the majority of the physicians surveyed (68%) in the US concerning attitudes toward online social networks did not agree that it was ethically acceptable to interact with patients on OSN, either for social or patient-care reasons. This suggests that for further research one should take into account physicians’ perceptions on OSN with respect to ethics and/or professional use while examining reciprocations among physicians. One can further argue that platform may serve physicians as an effective channel to attract patients. We share similar contentions of the scholars that physicians may not prefer to establish relations on online health platforms due to professional ethics (Bosslet et al. 2011).
Hub-and-Spoke Character: Tying and Tie Choices of Physicians and Patients
The networks in the present study exhibit a hub-and-spoke character typical of real networks (Gastner and Newman 2006). Scholars studying complex networks (Albert and Barabási 2002, Barabási 2009) assert that growth and preferential attachment mechanisms model the formation of hub-and-spoke networks. But, in our case, we believe that not only preferential attachment but also homophilous tie formation work constructively in the creation of hubs.
Regarding the patients-to-patients (P-to-P) interactions within the tying network, patients have no channels or means of becoming aware of other patients other than the on-site “my questions” feature or search engines. Enquiring about health issues via the “my questions” feature brings patients to immediate center of homophilous attention. In many cases, making such enquiries result in homophilous reciprocated tying wishes, thus the emergence of patient hubs. Therefore, homophilous tying wishes explain formation of 20 P-to-P hubs, as shown in Table 3. The more a patient uses the “my questions” feature the more s/he attracts homophilous attention. So, in the P-to-P context homophily has an explanatory power of examining hubs and their various sizes. On the other hand, despite physicians’ visibility on the site, the lack of hubs on the Dr-to-Dr tying and tie networks can be explained by heterophily.
34 hubs of the overall tying network (see Table 3) can be explained by the joint action of preferential attachment and homophily, which more than doubles hubs in the P-to-P tying network. Visibility of physicians is important but may not be enough to attract patients (that is, preferential attachment); an equally important factor would be matching of health issues and physicians specialties (that is, homophily).
The same complex dynamics of joint action is applicable to understand hub formation in the tie network. Moreover, health taboos (Moyer-Gusé et al. 2011, White and Dorman 2001) are to be incorporated in this complexity to explain the decrease in the number of hubs (from 33 to 15) in the transition to tie network or lack of motivation for initiating social relations (Newman 2001). We distinguish between heterophily and taboo by a combination of a large number of tying wishes disapproved. Ten patients never approved a total of nearly 50 tying wishes (not even wishes of physicians in one case) thus selected to remain anonymous to the entire community. We believe that “my questions” channel turned patients’ attention to these members, but health taboos prevented them from approving their tying wishes. Therefore, taboos should explain the fact that only sixteen of twenty-three hubs of the tying network survived in the transition from the tying network to the tie network (as shown in Table 3).
Since the primary goal of the platform is to help patients interact with physicians by making their presence as prominent as possible, it is not surprising to see that the largest hub in the present networks is a physician.
The second largest hub is a patient, which appears to be a special case (anomaly, misuse) because the patient did not send any tying wishes to other patients but more than hundred tying wishes to physicians. We cannot ascribe this hub formation to preferential attachment and/or homophily. It is striking to see the physicians approve the tie request of that patient without knowing the fact that hundred of requests are sent to physicians. This shows how committed the physicians are to engage in the patients-physicians interactions.
Tying Via Giant Component
Emergence of a giant component is another typical property of real networks. The networks examined exhibit this property clearly. The hubs account for less than three percent of the tying and tie networks. All hubs are situated in the respective giant components. Every four of five members are tied along with these giant components. A close examination of giant component of the P-to-P tie network shows that such giant is exclusively present.
In the P-to-P tying network, the giant component is of a weak type (i.e., weakly connected component, 61%). Even the largest SCC fails to be called a giant because it accounts for only 21% of the P-to-P tying network. The main mechanism behind the formation of this giant has to be homophily which is explained above. This giant fails to be of a strong type (i.e., strongly connected component) because of heterophily or taboos. The reader should notice that we are excluding the effects of physicians’ homophily, which may also play an important role for the weakness of a connected component. Undeniably, there exists homophily among patients, which results in a GC in the P-to-P tie network.
In the overall tying network, we have two giant components (see Table 3). The failed SCCs of P-to-P and Dr-to-Dr networks, 21% and 25% respectively, leave their places to a “stronger” SCC as physicians and patients interact, giving rise to a 38% SCC in the tying and a 74% SCC in the tie network. Physician-patient homophily plays a key role in the formation of a giant SCC as physicians willingly respond to the tying wishes of patients. No giant components are present in Dr-to-Dr networks, which is simply due to heterophily.
Conclusion
In this research, we demonstrate that essential structural properties that characterize most real networks in network science can contribute considerably to our understanding of interactive health platform. We assert that the networks representing the ties feature examined are not randomly established, but consequences of consciously made tie choices of physicians and patients.
We observed that the patient-physicians tie network is a small world where people are only five hands shakes away from each other. Thanks to the rules of the platform feature, people live in a small world without being aware of it. Knowing this piece of information should contribute to managing the platform more effectively. This brings up a novel question: what would be the effects of knowing the presence of small world on physicians and patients?
We consider preferential attachment and homophily as two relevant mechanisms to understand underpinning of tying and tie choices in the interactive health network subject to growth. This research let us see that mechanisms of network growth and preferential attachment may not always be explicit. The mechanisms are found to be functioning differently than proposed in the literature. It is this functioning that guides us to employ the mechanisms to explain how hub-and-spoke character is realized in the networks. The platform hides the “rich” (the ones who are highly tied), but their presence are is reflected by search engines on the Web and via the “my questions” feature on the platform. This brings up another interesting question: what would be the effects of choice support related platform features on the growth of interactive health networks?
Physicians and patients tend to have reciprocated tying wishes with each other. We emphasize that heterophily and health taboos are essential factors to explain the differences between the tying and tie networks. We contend that health taboos can cause the elimination of triads and hubs while heterophily explains the absence of otherwise expected dyadic ties. As a result dyads dominate the overall network. The very nature of hub-and-spoke character is prominent in this interactive health platform.
We also observe a number of special cases where patients may not be willing to sacrifice anonymity on the platform, which result in lack of ties among patients. We also contend that physicians are more committed to establishing ties with patients as compared to patients’ commitment in establishing ties among their peers.
Further work with a larger data set is needed to deepen our understanding of the evolutionary nature of the interactions. Further incorporation of time stamps is needed to explore the dynamics of the network so as to identify critical changes in the network at a local and global scale. That is, it would be essential to identify key influencers, their roles and information passing behaviors by employing centrality measures such as betweenness, closeness, and brokerage roles.
For comparison purposes and other aspects of the health information platform, one can examine other types of the interactions (questions and answers network, messages network) that may reveal information use patterns similar to the findings of (Moss and Elias 2010). Another potential research area is the analysis of modularity or formation of communities and cliques to articulate social identity development in online health platforms. Thanks to advances in social network analysis, the endeavor for a better understanding of the structure and dynamics of health actors’ interactions will illuminate the future state of health social networks.
References
1. Ahnert, S. and Fink, T. (2008) Clustering signatures classify directed networks. Physical Review E, 78(3), pp. 036112.
Google Scholar
2. Albert, R. and Barabási, A.-L. (2002) Statistical mechanics of complex networks. Reviews of modern physics, 74(1), pp. 47.
Publisher – Google Scholar
3. Album, D. and Westin, S. (2008) Do diseases have a prestige hierarchy? A survey among physicians and medical students. Social science & medicine, 66(1), pp. 182-188.
Publisher – Google Scholar
4. Barabási, A.-L. (2009) Scale-free networks: a decade and beyond. science, 325(5939), pp. 412.
Google Scholar
5. Bastian, M., Heymann, S. and Jacomy, M. (2009) Gephi: an open source software for exploring and manipulating networks. ICWSM, 8, pp. 361-362.
Google Scholar
6. Bosslet, G. T., Torke, A. M., Hickman, S. E., Terry, C. L. and Helft, P. R. (2011) The patient—doctor relationship and online social networks: Results of a national survey. Journal of general internal medicine, 26(10), pp. 1168-1174.
Google Scholar
7. Broder, A., Kumar, R., Maghoul, F., Raghavan, P., Rajagopalan, S., Stata, R., Tomkins, A. and Wiener, J. (2000) Graph structure in the web. Computer networks, 33(1), pp. 309-320.
8. Centola, D. and van de Rijt, A. (2014) Choosing your network: Social preferences in an online health community. Social science & medicine.
Google Scholar
9. Chambers, D., Wilson, P., Thompson, C. and Harden, M. (2012) Social network analysis in healthcare settings: a systematic scoping review. PloS one, 7(8), pp. e41911.
Google Scholar
10. Coleman, J. S. (1958) Relational analysis: the study of social organizations with survey methods. Human Organization, 17(4), pp. 28-36.
Google Scholar
11. Creswick, N. and Westbrook, J. I. (2010) Social network analysis of medication advice-seeking interactions among staff in an Australian hospital. International Journal of Medical Informatics, 79(6), pp. e116-e125.
Google Scholar
12. Dunn, A. G. and Westbrook, J. I. (2011) Interpreting social network metrics in healthcare organisations: A review and guide to validating small networks. Social science & medicine, 72(7), pp. 1064-1068.
Publisher – Google Scholar
13. Effken, J. A., Carley, K. M., Gephart, S., Verran, J. A., Bianchi, D., Reminga, J. and Brewer, B. B. (2011)
Using ORA to explore the relationship of nursing unit communication to patient safety and quality outcomes. International Journal of Medical Informatics, 80(7), pp. 507-517.
Publisher – Google Scholar
14. Gastner, M. T. and Newman, M. E. (2006) The spatial structure of networks. The European Physical Journal B-Condensed Matter and Complex Systems, 49(2), pp. 247-252.
Publisher – Google Scholar
15. Granovetter, M. S. (1973) The strength of weak ties. American journal of sociology, pp. 1360-1380.
Google Scholar
16. Johnson, S. L., Faraj, S. and Kudaravalli, S. (2014) Emergence of Power Laws in Online Communities: The Role of Social Mechanisms and Preferential Attachment.
Google Scholar
17. Kleinberg, J. (2000) The small-world phenomenon: An algorithmic perspective. in Proceedings of the thirty-second annual ACM symposium on Theory of computing: ACM. pp. 163-170.
Publisher – Google Scholar
18. Leskovec, J., Kleinberg, J. and Faloutsos, C. (2007) Graph evolution: Densification and shrinking diameters. ACM Transactions on Knowledge Discovery from Data (TKDD), 1(1), pp. 2.
Google Scholar
19. Madhavan, R., Gnyawali, D. R. and He, J. (2004) Two’s company, three’s a crowd? Triads in cooperative-competitive networks. Academy of Management Journal, 47(6), pp. 918-927.
Publisher – Google Scholar
20. Mascia, D., Cicchetti, A., Fantini, M. P., Damiani, G. and Ricciardi, W. (2011) Physicians’ propensity to collaborate and their attitude towards EBM: A cross-sectional study. BMC health services research, 11(1), pp. 172.
Publisher – Google Scholar
21. Matook, S., Brown, S. A. and Rolf, J. (2013) Forming an intention to act on recommendations given via online social networks. European Journal of Information Systems.
22. McPherson, M., Smith-Lovin, L. and Cook, J. M. (2001) Birds of a feather: Homophily in social networks. Annual review of sociology, pp. 415-444.
Publisher – Google Scholar
23. Milgram, S. (1967) The small world problem. Psychology today, 2(1), pp. 60-67.
Google Scholar
24. Moss, J. and Elias, B. (2010) Information networks in intensive care: a network analysis of information exchange patterns. in AMIA Annual Symposium Proceedings: American Medical Informatics Association. pp. 522.
Google Scholar
25. Moyer-Gusé, E., Chung, A. H. and Jain, P. (2011) Identification with characters and discussion of taboo topics after exposure to an entertainment narrative about sexual health. Journal of Communication, 61(3), pp. 387-406.
Publisher – Google Scholar
26. Newman, M. E. (2001) Clustering and preferential attachment in growing networks. Physical Review E, 64(2), pp. 025102.
Publisher – Google Scholar
27. Newman, M. E. (2003) The structure and function of complex networks. SIAM review, 45(2), pp. 167-256.
Google Scholar
28. Newman, M. E., Watts, D. J. and Strogatz, S. H. (2002) Random graph models of social networks. Proceedings of the National Academy of Sciences, 99(suppl 1), pp. 2566-2572.
Publisher – Google Scholar
29. Newman, M. W., Lauterbach, D., Munson, S. A., Resnick, P. and Morris, M. E. (2011) It’s not that i don’t have problems, i’m just not putting them on facebook: challenges and opportunities in using online social networks for health. in Proceedings of the ACM 2011 conference on Computer supported cooperative work: ACM. pp. 341-350.
Publisher – Google Scholar
30. Nuutila, E. and Soisalon-Soininen, E. (1994) On finding the strongly connected components in a directed graph. Information Processing Letters, 49(1), pp. 9-14.
Publisher – Google Scholar
31. Reggiani, A., Nijkamp, P. and Cento, A. (2010) Connectivity and concentration in airline networks: a complexity analysis of Lufthansa’s network. European Journal of Information Systems, 19(4), pp. 449-461.
Publisher – Google Scholar
32. Rogers, E. M. and Bhowmik, D. K. (1970) Homophily-heterophily: Relational concepts for communication research. Public opinion quarterly, 34(4), pp. 523-538.
Publisher – Google Scholar
33. Sillence, E., Briggs, P., Harris, P. R. and Fishwick, L. (2007) How do patients evaluate and make use of online health information? Social science & medicine, 64(9), pp. 1853-1862.
Publisher – Google Scholar
34. Strogatz, S. H. (2001) Exploring complex networks. Nature, 410(6825), pp. 268-276.
Publisher – Google Scholar
35. Wasserman, S. (1994) Social network analysis: Methods and applications, Cambridge university press.
Google Scholar
36. Watts, D. J. and Strogatz, S. H. (1998) Collective dynamics of ‘small-world’networks. Nature, 393(6684), pp. 440-442.
Google Scholar
37. Wentzer, H. S. and Bygholm, A. (2013) Narratives of empowerment and compliance: Studies of communication in online patient support groups. International Journal of Medical Informatics, 82(12), pp. e386-e394.
Publisher – Google Scholar
38. White, M. and Dorman, S. M. (2001) Receiving social support online: implications for health education. Health education research, 16(6), pp. 693-707.
Publisher – Google Scholar