Introduction
Malnutrition is a frequent problem in patients with chronic renal failure, especially those on maintenance hemodialysis [Bossola et al, 2005]. There are a number of studies which have linked an increased risk of morbidity and mortality in hemodialysis (HD) patients to nutritional status using biochemical and clinical indicators [Fedje et al, 1996, Araujo et al, 2006]. For example, Fouque et al have reported that[Fouque et al, 2008] an increased risk of mortality in hemodialysis subjects are associated to low measurements of serum albumin [Leavey et al, 1997; Pifer et al, 2002], normalized protein nitrogen appearance (nPNA) [Shinaberger et al, 2006], body mass index (BMI) [Leavey et al, 1997], subjective global assessment (SGA) [Pifer et al, 2002], serum prealbumin , serum creatinine [Goldwasser et al, 1993], low protein [Shinaberger et al, 2006] and low energy intake [Araujo et al, 2006]. There are several objective methods for assessing the nutritional status of HD patients. This includes anthropometric measurements, biochemical measures, collection of dietary data (using 24 hour food recall, food frequency) and use of malnutrition inflammation score (MIS) which is a practical and inexpensive method that relies on clinical judgment accrued from grading scales calculated from a brief history and physical examination [Kalantar-Zadeh et al, 2001].
Although, studies reports on various parameters such as SGA and anthropometric measurements, associations between dietary intakes, somatic status and biochemical measures in HD subjects are not addressed 20, 21, 22. Moreover there is a need for a study which can be the basis for further studies using cost effective disease specific food formulations in improving the observed nutrient deficits and other variables which relate to malnutrition in renal subjects in a developing country like India.
With this background, the objective of the study was to assess the nutritional needs and relationships of various nutritional parameters (anthropometric and biochemical measures (MIS) and dietary intake) in patients undergoing hemodialysis.
This is a first prospective nutrition intervention study from India which has focused on comprehensive evaluation of somatic, biochemical, dietary and MIS variables in hemodialysis subjects.
Methods
The subjects included in this cross sectional observatory study were chronic hemodialysis patients (N-72) consecutively selected during a seven month study period (March 2009-September 2009) from three major hospitals in Mysore city viz; CSI Holdsworth Mission Hospital, Vikram Hospital and JSS Hospital. All the three hospital has a well equipped center for dialysis.
Patients undergoing hemodialysis who had been referred by the nephrologist and who were willing to participate in the study were considered. All the patients were clinically stable and on dialysis since > 6 months. Subjects with diabetes mellitus or any other metabolic disorders were excluded.
It is a known fact that subjects with diabetes mellitus comprise a significant percentage of the dialysis population but they were excluded because this study is conducted prior to a major study which includes intervention of a disease specific food formulation for renal patients without diabetes mellitus. Moreover the nutritional considerations vary between renal subjects with and without diabetes mellitus on maintenance hemodialysis.
Ethical Issue
Clearance from the human ethical committee of the University and respective hospitals was obtained. Written consents were obtained from the subjects selected for the study.
Procedure
The subjects were reviewed on the day of dialysis. All patients received 4 hours hemodialysis per session 2times/week. The assessments were measured after the dialysis session in all the subjects.
Assessment
– Personal details and disease history- A structured questionnaire was prepared to note the following:
Subjects’ personal details like age, religion, socio-economic status, education were noted. The patient’s were also asked to give details on their disease history which included the cause of renal failure, number of years on dialysis, current physical problems and their personal habits like smoking, consumption of alcohol, any form of physical exercise before and after hemodialysis commenced.
– Dietary Intake -. Dietary intakes were recorded using a 24 hour diet recall on three different days including a weekend. Optimal energy and protein intakes were calculated using the recommended nutritional parameters for patients undergoing hemodialysis according to the National Kidney Foundation (NKF)-K/DOQI guidelines [NKF, 2001] and the energy, protein, calcium, sodium, potassium and phosphorus intake deficits were observed.
Anthropometric measurements- height, weight, mid upper arm circumference (MUAC), waist and hip measurements and skin fold thickness (biceps, triceps, subscapular and iliac crest) were measured pre dialysis using standard procedures [Jelliffe, 1996; Durnin & Womersley, 1974]. The four site skinfold thickness were measured using skinfold calipers (beta technology incorporated; USA). All these measurements were performed by the same observer on the side of the body that did not have any vascular access for hemodialysis. Indices like BMI, ideal body weight (IBW) and mid upper arm muscle circumference (MUAMC) and waist to hip ratio were calculated [Jelliffe, 1996]. The midpoint of normal BMI (Ideal BMI) was taken in to account to derive the IBW of the study group.
IBW= Height (Ht)2 x IBMI.
All the measurements and indices were compared to standard values for Asian Indians [Misra et al, 2009; Kathrotia et al, 2010]. Malnutrition Inflammation Score and laboratory parameters like serum albumin and TIBC/serum ferritin were assessed at the same time as the other data by the same assessor.
– Biochemical measurements- recent biochemical reports (not less than 1 month) like urea, creatinine, hemoglobin, potassium, sodium, calcium, phosphorus, total protein and total cholesterol were obtained from the medical records. Serum albumin was analyzed by bromocresol green dye method and TIBC was analyzed colorimetrically using diagnostic kits in the fasting state for the purpose of the study.
Statistical Analysis
Results of the anthropometric measures, biochemical measures and dietary intake are expressed as means ± standard deviations. Students t-test was performed for significant difference of P≤0.01 of somatic, biochemical variables and MIS between males and females by SPSS v.17. Pearson correlations were also conducted between various parameters in the study.
Results and Discussion
Subject Demographic
A total of 72 hemodialysis patients (49 males and 23 females) of mean age 44±15years were selected during the study. It was observed that majority of the subjects (68%) belonged to nuclear type while 32% belonged to joint families. Majority of the subjects (44%) did not have basic education. Many of them were involved in various kinds of business whereas some others were jobless and dependent on their children or relatives. Majority of the subjects fell in the low income group. 66% of the subjects were involved in some form of physical exercise (e.g., morning walks, yoga) but only 19% continued after the disease commenced. 16 subjects had the habit of smoking before the disease occurred whereas only 1 subject continues smoking at present. Similarly the number of subjects who consumed alcohol reduced from 11 to nil. Hypertension was the main cause for the disease in 83% of the subjects, 5% chronic glomerulonephritis and for the rest it was an unknown etiology. The number of patients who were on dialysis for less than a year was 12, 38 for 1-4 years, 17 for 5-10 years and 2 subjects for more than 10 years. It was found that 24% had a family history of de iabetes, 32% of hypertension and 5% of renal failure.
Somatic status
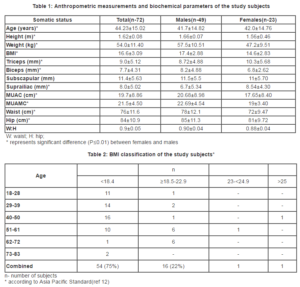
The anthropometric measurements of the subjects are given in Table 1. The table shows significant gender differences in all the parameters (P≤0.01) except waist: hip ratio (W: H) and subscapular skinfold thickness. In the present study, it was observed that 75% were underweight, 22% were normal and 3% fell in the overweight category of the revised BMI classification according to Asia Pacific standards (Table 2). Men had significantly higher BMI (P≤0.05) when compared to women. SFT was measured at biceps, triceps, sub scapular and supra iliac sites All the SFT measures were significantly (P≤0.01) higher in females when compared to males. Females had significantly lower (P≤0.01) MUAC and MUAMC than males.
Biochemical status
Table 3:
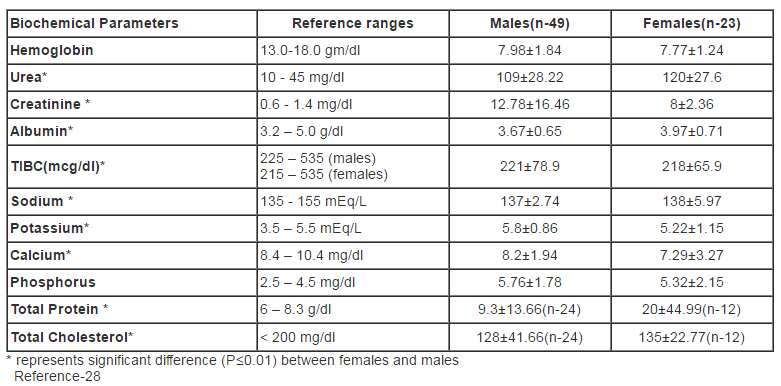
includes the biochemical parameters that were measured in the study subjects during the study period. It was noticed that both males and females had low hemoglobin levels (7.98±1.84 — males) (7.77±1.24 — females). Both the genders had higher mean levels of urea (males:109mg/dl, females:120mg/dl) and creatinine (males:12.78mg/dl, females:8mg/dl). Cholesterol levels were below normal ranges (< 200mg/dl) with 128 mg/dl in males and 135mg/dl in females. Total protein was comparatively higher than reference ranges in both males (9.3g/dl) and females (20g/dl). The phosphorus levels were slightly higher than normal levels (2.5—4.5mg/dl) in males (5.76mg/dl±1.78) and females (5.32mg/dl±2.15). Potassium levels were significantly higher (P≤0.01) in males (5.8 mEq/L) compared to females (5.22 mEq/L). Serum albumin and TIBC were within the reference ranges of 225 — 535mcg/dl (males) and 215 — 535mcg/dl (females).
In all the biochemical measurements there was a significant difference (P≤0.01) observed between males and females except haemoglobin and phosphorus levels. Creatinine, TIBC, potassium and calcium levels were significantly higher (P≤0.01) in males whereas urea, albumin, sodium, total protein and cholesterol were significantly higher (P≤0.01) in females.
Table 3: Biochemical parameters of the study subjects
Food Frequency
The frequency of various foods consumed by the subjects were also recorded when the 24 hour recall was conducted. The overall food frequency of the subjects revealed that rice and wheat were the commonly consumed cereals. Pulses, particularly red gram dhal were used daily by 66% of the subjects especially in the preparation of sambar (Lentil curry with vegetables). Black gram dhal was consumed weekly once by 73% of the subjects in the preparation of ‘dosa’ and ‘idli’(fermented cereal-pulse based Indian foods). Green leafy vegetables were consumed very rarely as it involved time consuming cleaning process. Other vegetables and roots and tubers especially those used in sambar preparation like carrots, radish, potato, beans and tomatoes were consumed daily by many subjects. Refined vegetable oil was used by majority of the patients compared to clarified butter (ghee). Fruits were consumed less frequently (weekly once). Many of the subjects consumed egg twice a week and this pattern was not only limited to the non vegetarians. Majority of the subjects were not in the habit of snacking deep fried products, aerated drinks and other commercial or bakery products.
Prevalence of Malnutrition using MIS
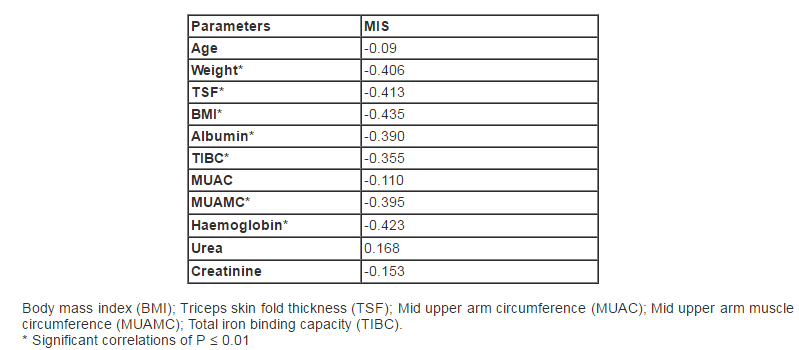
MIS is a comprehensive and quantitative scoring system modified from the conventional subjective global assessment. The components of MIS consists of weight change, dietary intake, gastro intestinal (GI) symptoms, functional capacity, co-morbidity including number of years of dialysis therapy, subcutaneous fat and signs of muscle wasting, body mass index (BMI), serum albumin, and total iron binding capacity (TIBC) [Kalantar-Zadeh et al, 2001]. According to Kalantar-Zadeh et al [2001] MIS has 10 components, each with four levels of severity, from 0 (normal) to 3 (severely abnormal). The sum of all 10 components ranges from 0 (normal) to 30 (severely malnourished); a higher score reflects a more severe degree of malnutrition and inflammation. MIS classified patients into 72% mild-moderately malnourished (score 7-21), 15% severely malnourished ( score 22-30) and 13% normal ( score 0-6). Correlations were attempted between MIS and other nutritional parameters (Table 4). There was a significant negative correlation between MIS and weight, BMI, fat and protein status (triceps skinfold, MUAC and MUAMC). There was also a significant negative correlation between MIS and hemoglobin, albumin and TIBC and age. Significant correlation between MIS and age has been reported in an earlier study [Kalantar-Zadeh et al, 1999].
Table 4: Pearson’s correlation between nutritional parameters and malnutrition score
Daily Intake
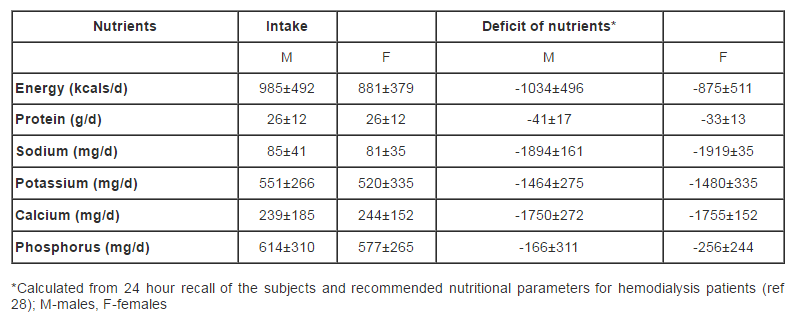
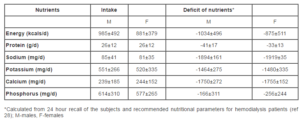
The daily food intake in all the patients was assessed by 24 hour food recall which was conducted on two weekdays and a weekend. The menu of the food consumed remained the (mainly plain rice, sambar, dosa, idli, roti (flat Indian bread)) in most of the subjects as they were on a strictly restricted diet on a HD and non HD day. The food intake of the subjects were recorded using a set of household measures, relevant to Indian cuisine, were used to determine the portion size of different menu items consumed by the subjects. Raw ingredients for the cooked items were derived by standardizing different menu items and preparatory methods. Food consumed by each subject was converted to its raw weight. Food group intake data was translated into energy and other nutrients (carbohydrate, protein, fat) and micronutrients (calcium, phosphorus, sodium, potassium) by using food composition tables [Gopalan et al, 1994]. The actual intake, recommended intake and the deficit of nutrients of the study population is given in Table 5. The mean daily energy intake (DEI) was found to range in between 11kcals and 22kcals/kg/d (both males and females). The mean energy consumption was found to be 985±492 kcals/day for males and 881± 379 kcals/day for females which was quite low when compared to the recommended intake. The average intake of proteins was also low (26g/day±12) for both males and females compared to the actual requirement of proteins. The mean dietary protein intake (DPI) of the subjects ranged between 0.3 and 0.5g protein/kg/day (both males and females). The DPI of patients in this study is relatively low when compared to other studies which report a DPI ranging between 0.94 and 1.0g protein/kg/day [NKF, 2001; Ikizler et al, 1996]. There was also a low consumption of sodium, potassium, calcium and phosphorus (Table 5). As anticipated, there was a positive correlation between energy and protein intake(r=0.886, P≤ 0.01).
Table 5: Daily intake and deficit of nutrients in the study population (N-72, males-49, females-23)
Discussion
Anthropometric measures of subcutaneous fat and muscle wasting can be useful in monitoring nutritional status even when no change is observed in dry weight [Beutler et al, 1997]. In the present study, it was observed that majority of the patients were underweight according to BMI, which clearly indicates the presence of malnutrition. It was noticed that age of the subjects positively correlated with their BMI (r=0.424, P≤0.05). It is reported that ESRD patients treated with HD with higher BMI have increased survival over a 1-year period and vice versa [Abbot et al, 2004]. It is important to evaluate SFT at four separate sites. Measurement at just one site is not accurate, since response to malnutrition at the different sites varies [Oe et al, 1998]. Therefore measurements of SFT on the triceps, biceps, subscapular and supra iliac sites were conducted. Higher SFT measures in females may be due to increased amount of fat in females than males. Mid-upper arm circumference (MUAC) is a measure that estimates total body muscle protein. By assessing MUAC and triceps skinfold, the mid-arm muscle circumference can be evaluated. Gender differences in nutritional parameters were also observed in the present study. Low MUAC, MUAMC, waist circumference and triceps skinfold for both the males and females were below standard values indicating low protein and fat status in both the genders. Lower MUAC and MUAMC in females may be due to lesser amount of muscle mass in them. The general measure of central obesity is by measuring the waist and hip in centimeters and arriving at waist to hip ratio (WHR). As mentioned earlier, the mean waist to hip ratio in males was 0.9 ±0.04 and 0.88±0.04 in females. We have used 0.90 in men and 0.80 as the standard cut-offs for WHR [Gupta et al, 2002].
Both males and females were found anemic as indicated by their haemoglobin (Hb) levels. Anemia is an almost universal finding in patients with end-stage renal disease. [Eckardt, 2001]. Inadequate intake of green leafy vegetables and other natural sources of dietary iron were reported by the subjects, which can be one of the reason for lower levels of Hb. We have observed higher urea, creatinine levels in both males and females. A number of studies have reported that patients with late referral to nephrologists had higher serum concentrations of creatinine and urea compared with those referred earlier [Ifudo et al, 1996]. High lean body mass also leads to increased creatinine and urea levels [Alvestrand & Gutierrez, 1996]. The cholesterol levels were lower than the reference range of < 200 mg/dl for both males and females. Reports suggests that low serum cholesterol levels were associated with an increased risk of death, suggesting that a low energy intake, reflected by a low serum cholesterol level, might be a risk factor for increased mortality [Fedje et al, 1996]. It is also reported that higher phosphorus levels seen in hemodialysis patients can lead to vascular wall stiffness and resistant hypertension [Huang et al, 2008]. In the present study, both males and females had phosphorus levels slightly on the higher side of normal values. The study population had a higher serum phosphorus levels compared to reference ranges. Serum phosphorus levels may vary based on the quality and quantity of phosphate binders. Dialysis also maintains serum phosphorus. However, reports indicate that majority of patients undergoing dialysis combined with dietary phosphorus restriction have hyperphosphatemia which may lead to resistant hypertension [19]. As reported by various studies, serum phosphorus levels of 7- 9.5 mg/dL are considered high in hemodialysis subjects (lowrie andlew, Chertow GM, Lowrie EG, Lew NL. Mineral metabolism and mortality in dialysis. J Am Soc of Nephr, 2000, 11, Abst A2958.). This implies that our study population had comparatively lower phosphorus levels which can be attributed to the consumption of low protein diets.
Serum potassium levels were maintained at normal levels in the study population. This may be due to the combined effect of low protein intake and hemodialysis.
In the present study, a negative correlation was observed between anthropometric measures and MIS. Similar observations have been reported by other researchers [Morais et al, 2005; Manandar et al, 2008]. This indicates that lower the BMI, weight, triceps and MUAMC higher is the MIS score and hence a stronger tendency towards malnutrition. A study by Tapiawala et al [2006] had reported that patients on hemodialysis had the highest percent of malnutrition. The researchers observed correlation between subjective global analysis (SGA) and anthropometric measures (SFT, MUAC and MUAMC) however, they did not provide correlation results between dietary intake and biochemical measures. Our study noticed correlation between MIS, anthropometric, biochemical and dietary intake data.
The DEI of both males and females was surprisingly very low and it is recommended that a DEI of 35kcal/kg/d is required to maintain nitrogen balance and body composition in patients treated with HD [Slomowitz et al, 1989]. Lower intake of proteins of the study population can be attributed to the fact that cereals constitute the major item of the foods consumed in the Indian diet when compared to protein rich foods like pulses, milk and its products. There are reports that show that the mean intake of all foods, except cereals is lower in Indians in the diseased as well as the normal population [Kusuma and Urooj, 2002; Puttaraj and Urooj, 2000]. It has been recommended that a DPI of approximately 1.2g/kg/day is needed to maintain nitrogen balance in majority of maintenance of HD (hemodialysis) patients [NKF, 2001]. Low DPI in HD patients was linked with worsened outcomes in a study [Acchiardo et al, 1990]. It is reported that a protein intake of <0.65 g/kg BW/day was associated with a high mortality rate and a high rate of hospitalization as compared to no mortality and hospitalization rate with a protein intake of 1.2 g/kg BW/day [Alvestrand and Gutierrez, 1996]. A study has reported that losses of approximately 1 to 2 g of protein into dialysate occurs with conventional hemodialyzers, and it may be higher with high-flux dialyzers [Kaplan et al, 1995]. Studies have reported energy intakes of 24-27 kcal/kg/d by MHD patients and that 80% of MHD patients studied consumed < 1g/kg/d of protein [Sharma et al, 2002]. In comparison to such studies our subjects were appallingly highly malnourished especially with reference to their dietary intake showing that they have a greater risk towards mortality. The deficit of micronutrients (Na, K, Ca and P) can be attributed to a very low dietary intake of subjects in our study population.
Association of anthropometric data with biochemical parameters of the study subjects
A negative correlation seen between urea levels and MUAC in all the HD patients may be attributed to the accelerated protein breakdown, especially from the muscle stores due to the catabolic effects of HD, anorexia or acidosis as reported in one study [Alvestrand and Gutierrez, 1996]. It was observed that age correlated significantly with serum albumin levels (r=0.08, P≤0.05) and with ideal body weight (r=0.242, P≤0.05) but not with serum transferrin (r = -0,011, P≥0.05). A study reports that there was an association found with age and IBW but not with serum albumin and serum transferrin [Kimmel et al, 2003]. Despite poor protein status, the serum albumin levels were within the reference range [NKF, 2001]. A study had shown that the serum albumin concentration is predictive of both albumin losses into dialysate, as well as production of C-reactive protein, which is associated with inflammation [Yeun and Kaysen, 1997].
Association between anthropometric measurements, biochemical parameters and dietary intake
An attempt was made in the study to relate the anthropometric measurements with dietary intake of energy, protein and iron. As expected, positive correlations were observed between energy intake and BMI (r=0.019, P=0.896 for males and r=0.179, P=0.424 for females), protein intake and MUAC (r=0.048, P= 0.809 for males and r=0.215, P=0.337 for females) and fat intake and SFT (r=0.099, P=0.409) in both subject groups. In addition, BMI correlated with serum albumin (r=0.080, P=0.506) and transferrin (r=0.057, P=0.657) respectively.
In the present study, the energy and protein intake positively correlated with serum albumin and transferrin levels. Recent data from the MDRD study in the United States have demonstrated that a reduction in protein and energy intake is associated with reductions in various nutritional parameters like body weight, fat mass, serum albumin and transferrin [Bergstrom, 1995]. The iron intake correlated positively with hemoglobin (r=0.206, P=0.083) and TIBC (r=0.064, P=0.594) levels of all the subjects. Similar associations were observed between dietary intake and serum levels of sodium and potassium. There was a positive correlation observed between protein intake and urea (r=0.204, P=0.115) and MUAC and creatinine levels (r=0.146, P=0.316 for males and r=0.144, P=0.522 for females). This explains the central role played by malnutrition as a risk factor in hemodialysis patients. In a survey of 12000 haemodialysis patients, it was found that low serum creatinine concentrations (a marker of scanty muscle mass) and low urea (indicating a deficient protein intake) were associated with a high risk of death [Alvestrand & Gutierrez, 1996].
Conclusion
The present cross sectional observatory study investigated the nutritional needs and the existence of malnutrition in an Indian hemodialysis population. Various parameters such as anthropometric measures, biochemical measures, dietary intake and malnutrition inflammation score had been utilized to measure the existence of malnutrition in renal subjects undergoing hemodialysis. Each measure clearly depicted the presence of wasting which was mainly attributed to a low dietary intake indicating the need for a supplement which could meet their nutritional requirements and consumed along with their daily diet.
Applications to Practice
It is well known that onset of malnutrition will accelerate disease progression in patients with renal disease. At first, nutritional need assessments has to be conducted on a regular basis, using various variables such as anthropometric, biochemical measures and dietary intake. Disease specific malnutrition scoring tests (for renal subjects) such as subjective global assessment and malnutrition inflammation score should be utilized to add strength to the observation. In order to meet the nutrient deficits as indicated by such cross sectional studies, a supplement should be formulated to meet their nutrient requirements. The formulation could be prepared from low cost renal specific feeds utilizing locally available ingredients such as cereals and pulses which constitute the daily diet of an average Indian. Moreover there is a need for such studies as there is little information about the nutritional status of Asian populations undergoing dialysis.
Limitations of the study
The present study is a cross-sectional study and relationships between various nutritional variables may exist but are not causative of malnutrition.
Support and Financial disclosure
The authors thank the University Grants Commission, New Delhi for the financial assistance provided to undertake the study
References
1. Abbot, K. C, Glanton, C.W, Trespalacious, F. C, Oliver, D.K, Orirtz, M.I, Agodoa, L.Y, Cruess, D.F. and Kimmel, P.L. (2004) ”Body mass index, dialysis modality, and survival: analysis of the United states renal data system dialysis morbidity and mortality wave II study,” Kidney International, 65 597-605.
Publisher – Google Scholar
2. Acchiardo, S. R, Moore, L. W. and Burk, L. (1990) ”Morbidity and mortality in hemodialysis patients,” ASAIO Trans, 36 M148-M151.
Google Scholar
3. Alvestrand, A. and Gutierrez, A. (1996)”Relationship between nitrogen balance, protein, and energy intake in haemodialysis patients,” Nephrology Dialysis Transplant, 11 130-133.
Publisher – Google Scholar
4. Araujo, I.C, Kamimura, M.A. and Draibe, S. A. (2006) “Nutritional parameters and mortality in incident hemodialysis patients,” Journal of Renal Nutrition, 16 27—35.
Publisher – Google Scholar
5. Bergstrom, J. (1995) “Nutrition and mortality in hemodialysis,” Journal of American Society of Nephrology, 6 1329-1341.
Google Scholar
6. Beutler, K. T, Park, G. K. and Wilkowski, M. J. (1997) “Effect of oral supplementation on nutrition indicators in hemodialysis patients,” Journal of Renal Nutrition, 7 77-82.
Publisher – Google Scholar
7. Bossola, M, Muscaritoli, M. and Tazza, L. (2005) “Variables associated with reduced dietary intake in hemodialysis patients,” Journal of Renal Nutrition, 15 244—252.
Publisher – Google Scholar
8. Durnin, JVGA, and Womersley J. (1974) “Body fat assessed from total body density and its estimation from skinfold thickness: measurements on 481 men and women aged from 16 to 72 years,” British Journal of Nutrition, 32 77-97
Publisher – Google Scholar
9. Eckardt, K. (2001) “Anaemia- in end-stage renal disease: pathophysiological considerations.,”Nephrology Dialysis Transplantation, 16 [supp 7] 2-8.
Publisher – Google Scholar
10. Fedje, L, Moore, L, and McNeely, M. (1996) “ A role for oral nutrition supplements in the malnutrition of renal disease,” Journal of Renal Nutrition, 6 198-202.
Publisher – Google Scholar
11. Fouque, D, Mc Kenzie, J, Mutsert, R, Azar, R., Teta, D, Plauth, M. and Cano, N. (2008) “Use of a renal-specific oral supplement by haemodialysis patients with low protein intake does not increase the need for phosphate binders and may prevent a decline in nutritional status and quality of life,” Nephrology dialysis transplant, 23 2902-2910.
Google Scholar
12. Goldwasser, P, Michel, M. A. and Collier, J. (1993) “Prealbumin and lipoprotein (a) in hemodialysis: relationships with patient and vascular access survival,” American Journal of Kidney Disease, 22 215—225.
13. Gopalan, C, Rama Shastri, B. V, Balasubramaniam, S. C. (1994) Habitual diets in India and their adequacy in nutritive value of Indian foods. Hyderabad, India, National Institute of Nutrition — Indian Council of Medical Research.
14. Gupta, R, Gupta, V. P, Sarna, M, Bhatnagar, S, Thanvi, J. and Sharma, V. (2002) “Prevalence of coronary heart disease and risk factors in an urban Indian population: Jaipur Heart Watch-2,” Indian Heart Journal, 54 56—66.
15. Huang, C. X, Plantinga, L. C, Fink, N. E, Melamed, M. L, Coresh, J. and Powe, N. R. (2008) “Phosphate levels and blood pressure in incident hemodialysis patients: a longitudinal study,” Advances in chronic kidney disease, 15 321-331.
Publisher – Google Scholar
16. Ikizler, T. A, Greene, J. H, Yenicesu, M, Schulman, G, Wingard, R.L. and Hakim, R. M. (1996) “Nutrition balance in hospitalized chronic hemodialysis patients,” Kidney International, 57 S53-S56.
17. Jelliffe, D.B. (1996) An assessment of nutritional status of the community. Monograph Series, 53, World Health Organization, Geneva.
18. Kalantar-Zadeh, K, Kleiner, M, Dunn, E, Lee, G. H. and Luft, F. C. (1999) “A modified quantitative subjective global assessment of nutrition for dialysis patients,” Nephrology Dialysis Transplant, 14 1732-1738.
Publisher – Google Scholar
19. Kalantar-Zadeh, K, Kopple, J. D, Block, G. and Humhreys, M. H. (2001) “A Malnutrition-Inflammation Score is correlated with morbidity and mortality in maintenance hemodialysis patients,” American Journal of Kidney Diseases, 38 1251-1263.
Publisher – Google Scholar
20. Kaplan, A. A, Halley,S. E, Lapkin, R. A. and Graeber, C. W. (1995) “Dialysate protein losses with bleach processed polysulphone dialyzers,” Kidney International, 47 573-578
Publisher – Google Scholar
21. Kathrotia, R.G, Paralikar, S.J, Rao, P.V. and Oommen, E. R. (2010) “Impact of different grades of body mass index on left ventricular structure and function,” Indian Journal of Physiology and Pharmacology, 54 149-156.
Google Scholar
22. Kimmel, P.L, Chawla, L. S, Amarasinghe, A, Peterson, R. A, Weihs, K. L, Simmens, S. J, Alleyne, S, Burke, H. B, Cruz, I. and Veis, J. H. (2003) “Anthropometric measures, cytokines and survival in hemodialysis patients,” Nephrology Dialysis Transplant, 18 326-332.
Publisher – Google Scholar
23. Kusuma, K. and Urooj, A. (2002) “Nutritional status & plasma lipid profile in selected Ischemic Heart Disease (Ihd) patients,” Journal of Human Ecology, 11 61-65.
24. Leavey, S. F, Strawderman, R. L. and Jones, C. A. (1998) “Simple nutritional indicators as independent predictors of mortality in hemodialysis patients”, American Journal of Kidney Disease, 31 997—1006.
Publisher – Google Scholar
25. Manandar, D. N, Chhetri, P. K, Pahari, L. R, Tiwari, R. and Chowdhary, S. K. (2008) “Nutritional assessment of patients under hemodialysis in Nepal Medical College Teaching Hospital”, Nepal Medical College Journal, 3 164-169.
Google Scholar
26. Misra, A, Chowbey, P, Makkar, B. M, Vikram, N. K, Wasir, J. S, Chadha, D, Joshi, S.R, Sadikot, S, Gupta, R, Gulati, S. and Munjal, YP. (2009) “Consensus Statement for Diagnosis of Obesity, Abdominal Obesity and the Metabolic Syndrome for Asian Indians and Recommendations for Physical Activity, Medical and Surgical Management”, Journal of the Association of the Physicians of India, 57 163-170.
Google Scholar
27. Morais, A. A, Silva, M. A. and Faintuch, J. (2005) “Correlation of nutritional status and food intake in hemodialysis patients”, Clinics, 60 185-92.
Publisher – Google Scholar
28. National Kidney Foundation: K/DOQI clinical practice guidelines for nutrition in chronic renal failure. (2001). American Journal of Kidney Disease, 37, suppl 2, S66-S70.
Publisher – Google Scholar
29. Ifudo, O, Dawood, M. and Homel, P. (1996) “Excess morbidity in patients starting uremia therapy without prior care by a nephrologist”, American Journal of Kidney Diseases, 28 841-845.
Publisher – Google Scholar
30. Oe, B, De Fijter, C. W. H, Oe, P. L, Stevens, P. and De Vries, P. M. J. (1998) “Four- site skinfold anthropometry (FSA) versus body impedence analysis (BIA) in assessing nutritional status of patients on maintenance hemodialysis: which method is to be preferred in routine patient care”, Clinical Nephrology, 49 180-185.
Google Scholar
31. Pifer, T. B, McCullough, K. P. and Port, F. K. (2002) “Mortality risk in hemodialysis patients and changes in nutritional indicators: DOPPS”, Kidney International, 62 2238—2245.
Publisher – Google Scholar
32. Sharma, M, Rao, M, Jacob, S. and Jacob, C. K. (2002) “A controlled trial of intermittent enteral nutrient supplementation in maintenance hemodialysis patients”, Journal of Renal Nutrition, 4 229-37.
Publisher – Google Scholar
33. Shinaberger, C. S, Kilpatrick, R. D. and Regidor, D. L. (2006) “Longitudinal associations between dietary protein intake and survival in hemodialysis patients”, American Journal of Kidney Disease, 48 37—49.
Publisher – Google Scholar
34. Slomowitz, L. A, Monteon, F. J, Grosvenor, M, Laidlaw, S. A. and Kopple, J. D. (1989) “Effect of energy intake on nutritional status in maintenance hemodialysis patients”, Kidney International, 35 704-711.
Publisher – Google Scholar
35. Tapiawala, S, Vora, H, Patel, Z, Badve, S. and Shah, B. (2006) “Subjective global assessment of nutritional status of patients with chronic renal insufficiency and end stage renal disease on dialysis”, Journal of the Association of the Physician of India, 54 923-926.
Google Scholar
36. Urooj, A. and Puttaraj, S. (2000) “Glycemic responses to cereal- based Indian food preparations in patients with non-insulin dependent diabetes mellitus and normal subjects”, British Journal of Nutrition, 83 483-488.
Publisher – Google Scholar
37. Yeun, J. Y. and Kaysen, G. A. (1997) “Acute phase proteins and peritoneal dialysate albumin”, Journal of Kidney Disease, 30 923—927.
Publisher – Google Scholar