Introduction
Since its first introduction to the mobile market in 1992, smart phones took the lead to become the users’ first choice in most markets globally. It is called smart phones because they combine computing capabilities in addition to their normal use as mobile phones.
Enhancements on smart phones are flourished since their first appearance such as their computing ability, screen resolution, camera, writing editor, 3G and 4G, GPS, diversity of networking options, and many more. Among the famous companies that entered into this market worldwide are: IBM, Palm, Microsoft (Window CE pocket PC operating systems), BlackBerry, Apple (iPhone), Android, and many others.
The expected number of mobile phone connections worldwide is more than 6 billion in 2012 (BBC, 2010) and will reach more than 7.8 billion in 2015 (Statista, 2014). According to Russel (2011), among this number, just 27 percent is accounted for smart phones, which is an indication that there are still much potential for more market share occupation by communication companies. Reports in 2014 show that shipments topped one billion for first time in 2013, and now represent 55% of overall mobile shipments (MacRumors, 2014). But, we should be little careful since not all reports are so enthusiastic; the numbers of 2013 and 2014 show a decline in smart phones shipments (Versace, 2013).
In general, the communication market is flourishing since more than a decade regardless of 2008 recession. For example, the biggest four companies in the US communication market, (Verizon, AT&T, Spring, and T-Mobile) reached the ceiling of 10 billion dollars in revenues in 2009 (Richtel, 2009). The same results can be said true in China and Japan and Western Europe. These results include all types of communication services such as MMS, SMS, IM, and so forth (O’Brien, 2009).
The 2008 crisis was globally strong that shocked every sector, crisis that is considered to the most devastating crash since 75 years (Altman, 2009). According to Altman (2009), Americans alone lost 14 trillion dollars from their savings and investments.
However, this crisis covered all sectors globally but the communication market was an exception. It stands strong against the worldwide financial shock. Kuwait communication was no exception. Its three major communication players (Zain est. in 1983, Wataniya est. in 1997, and Viva est. in 2007) had no difficulty to overcome the international crisis of 2008.
The competition among three companies in Kuwait communication market is very challenging. One important fact about mobile market is that this market specifically is mature and customers are highly knowledgeable, this is why those companies fight to keep and increase their market share in creative manners. According to Zhao and his teammates (2012), “As the market becomes more and more mature, value-added services become more homogeneous and completion for acquiring new customers and retaining existing customers becomes more intense. In this environment, customer satisfaction is a critical factor for mobile service providers to maintain or improve their market share and profitability” (Zhao et al., 2012).
The paper is composed of the following sections. First, we introduce the importance of our research. Second, we make a brief trip over literature review and important studies in the field. Third, discussion of the research model is introduced; followed by, fourth, the data collection, sample, and statistical discussion. Finally, we discuss the results and reach the findings of the study and conclusion.
Importance and Research Questions:
Kuwait communication market is mature. The consumers are using most advanced technologies and gadgets. iPhone and Android systems are considered very popular and used by all ages. Thus, Kuwaiti communication organizations are competing on services provided for smartphones (3G and 4G). Our research is concentrated therefore over the following questions: 1. What factors affect usages smart phones? 2. Does ease of use affect the intention to use smart phones? 3. Does usefulness of smartphones affect the behavioral intention their usages?
Literature Review
Behavior Theory and Technology Acceptance Model
There are varieties of publications in technology adoption. For example Theory of Reasoned Action (TRA) (Fishbein and Ajzen, 1975), the Innovation Diffusion Theory (IDT) (Rogers, 1983), the Technology Acceptance Model (TAM) and its related modifications and variations (Davis, 1989; Venkatesh and Davis, 2000; Venkatesh et al., 2003; Yi et al., 2006; Rouibah, 2008; Rouibah and Abbas, 2010), in addition to other theories that group more than one to create a new model (Kim and Garrison, 2009).
One important note should be made is that TAM is the only theory that developed and invented in the environment of information systems to be used and measure information technology acceptance compared to other theories that were created by people outside the field. For this reason it is considered one of the most successful theories in the field and this is why it has been applied and used in variety of applications and environments (Venkatesh & Davis, 2000; King & He, 2006; Rouibah, 2008; Rouibah and Abbas, 2011; Kim & Garrison, 2009; Liao et al., 2009; Mallat et al., 2009).
In 1989 when Davis introduced this theory (Davis, 1989; Davis et al., 1989), TAM took lot of concentration (See Venkatesh and Davis, 2000; Venkatesh et al., 2003; Yi et al., 2006; Rouibah, 2008; Rouibah and Abbas, 2010). All types of scholars verified the goodness of fit of the model (see for example Chen et al., 2011). Many extensions were introduced by researchers of TAM (Lopez et al., 2008; Rouibah et al., 2011; Liquat and Anjali, 2009; Lung and Peng, 2007; Koury et al., 2010). Researchers tried different versions of TAM extension by addition many external factors to the original form. Hong et al., (2002) asserted that extending original TAM to include the following five external variables will positively explain the model since they all influence individual perception: computer’s self-efficacy, knowledge of the search domain, relevance, terminology, and finally the screen design. However, Lewis et al. (2003) extended TAM model to include the external variables institutional factor, social factor, and individual factor. It is widely known that those applications and extension of TAM were validated and tested successfully (Hasan and Ahmed, 2007), Hsu and Lu (2007) had another point of view. They found that TAM has mixed and sometimes debatable and conflicting results.
Smart Phone and Acceptance Models
It is also true that TAM is used heavily in communication services and technologies. For example, Chen et al., (2009; 2011) adopted TAM to test application of smartphones in logistics in Taiwan. The model was used in two different forms (with and without self-efficacy) and found that self-efficacy is the only important factor that affects perceived ease of use construct.
M-net was the study of Shin (2007). He focused towards finding the motivators that affect users’ mobile Internet usage. Based upon 515 consumers’ responses, he found that users’ perceptions are significantly associated with their motivations towards using mobile Internet. Shin also found that perceived quality and perceived availability are two constructs that have significant effect on users’ extrinsic and intrinsic motivations (Shin, 2007).
Shin et al. (2011) used the Unified Theory of Acceptance and Usage Technology (UTAUT) to measure the behavior intention of using smartphones in ubiquitous learning (u-learning). The findings were consistent with previous studies and research that found satisfaction and confirmation are the two main predictors of intention.
In addition, there were plenty of publications and verifications of acceptance models towards using smartphones. For example, in m-commerce and online shopping (Chang and Chen, 2005; Rouibah and Abbas, 2010; Rouibah, Abbas, and Rouibah, 2011), sports and training (Taylor et al., 2011), m-net (Shin, 2007), mobile advertising (Koury et al., 2010), learning and teaching (Hashemi and Ghasemi, 2011; Shin et al., 2011), and many more.
Research Model
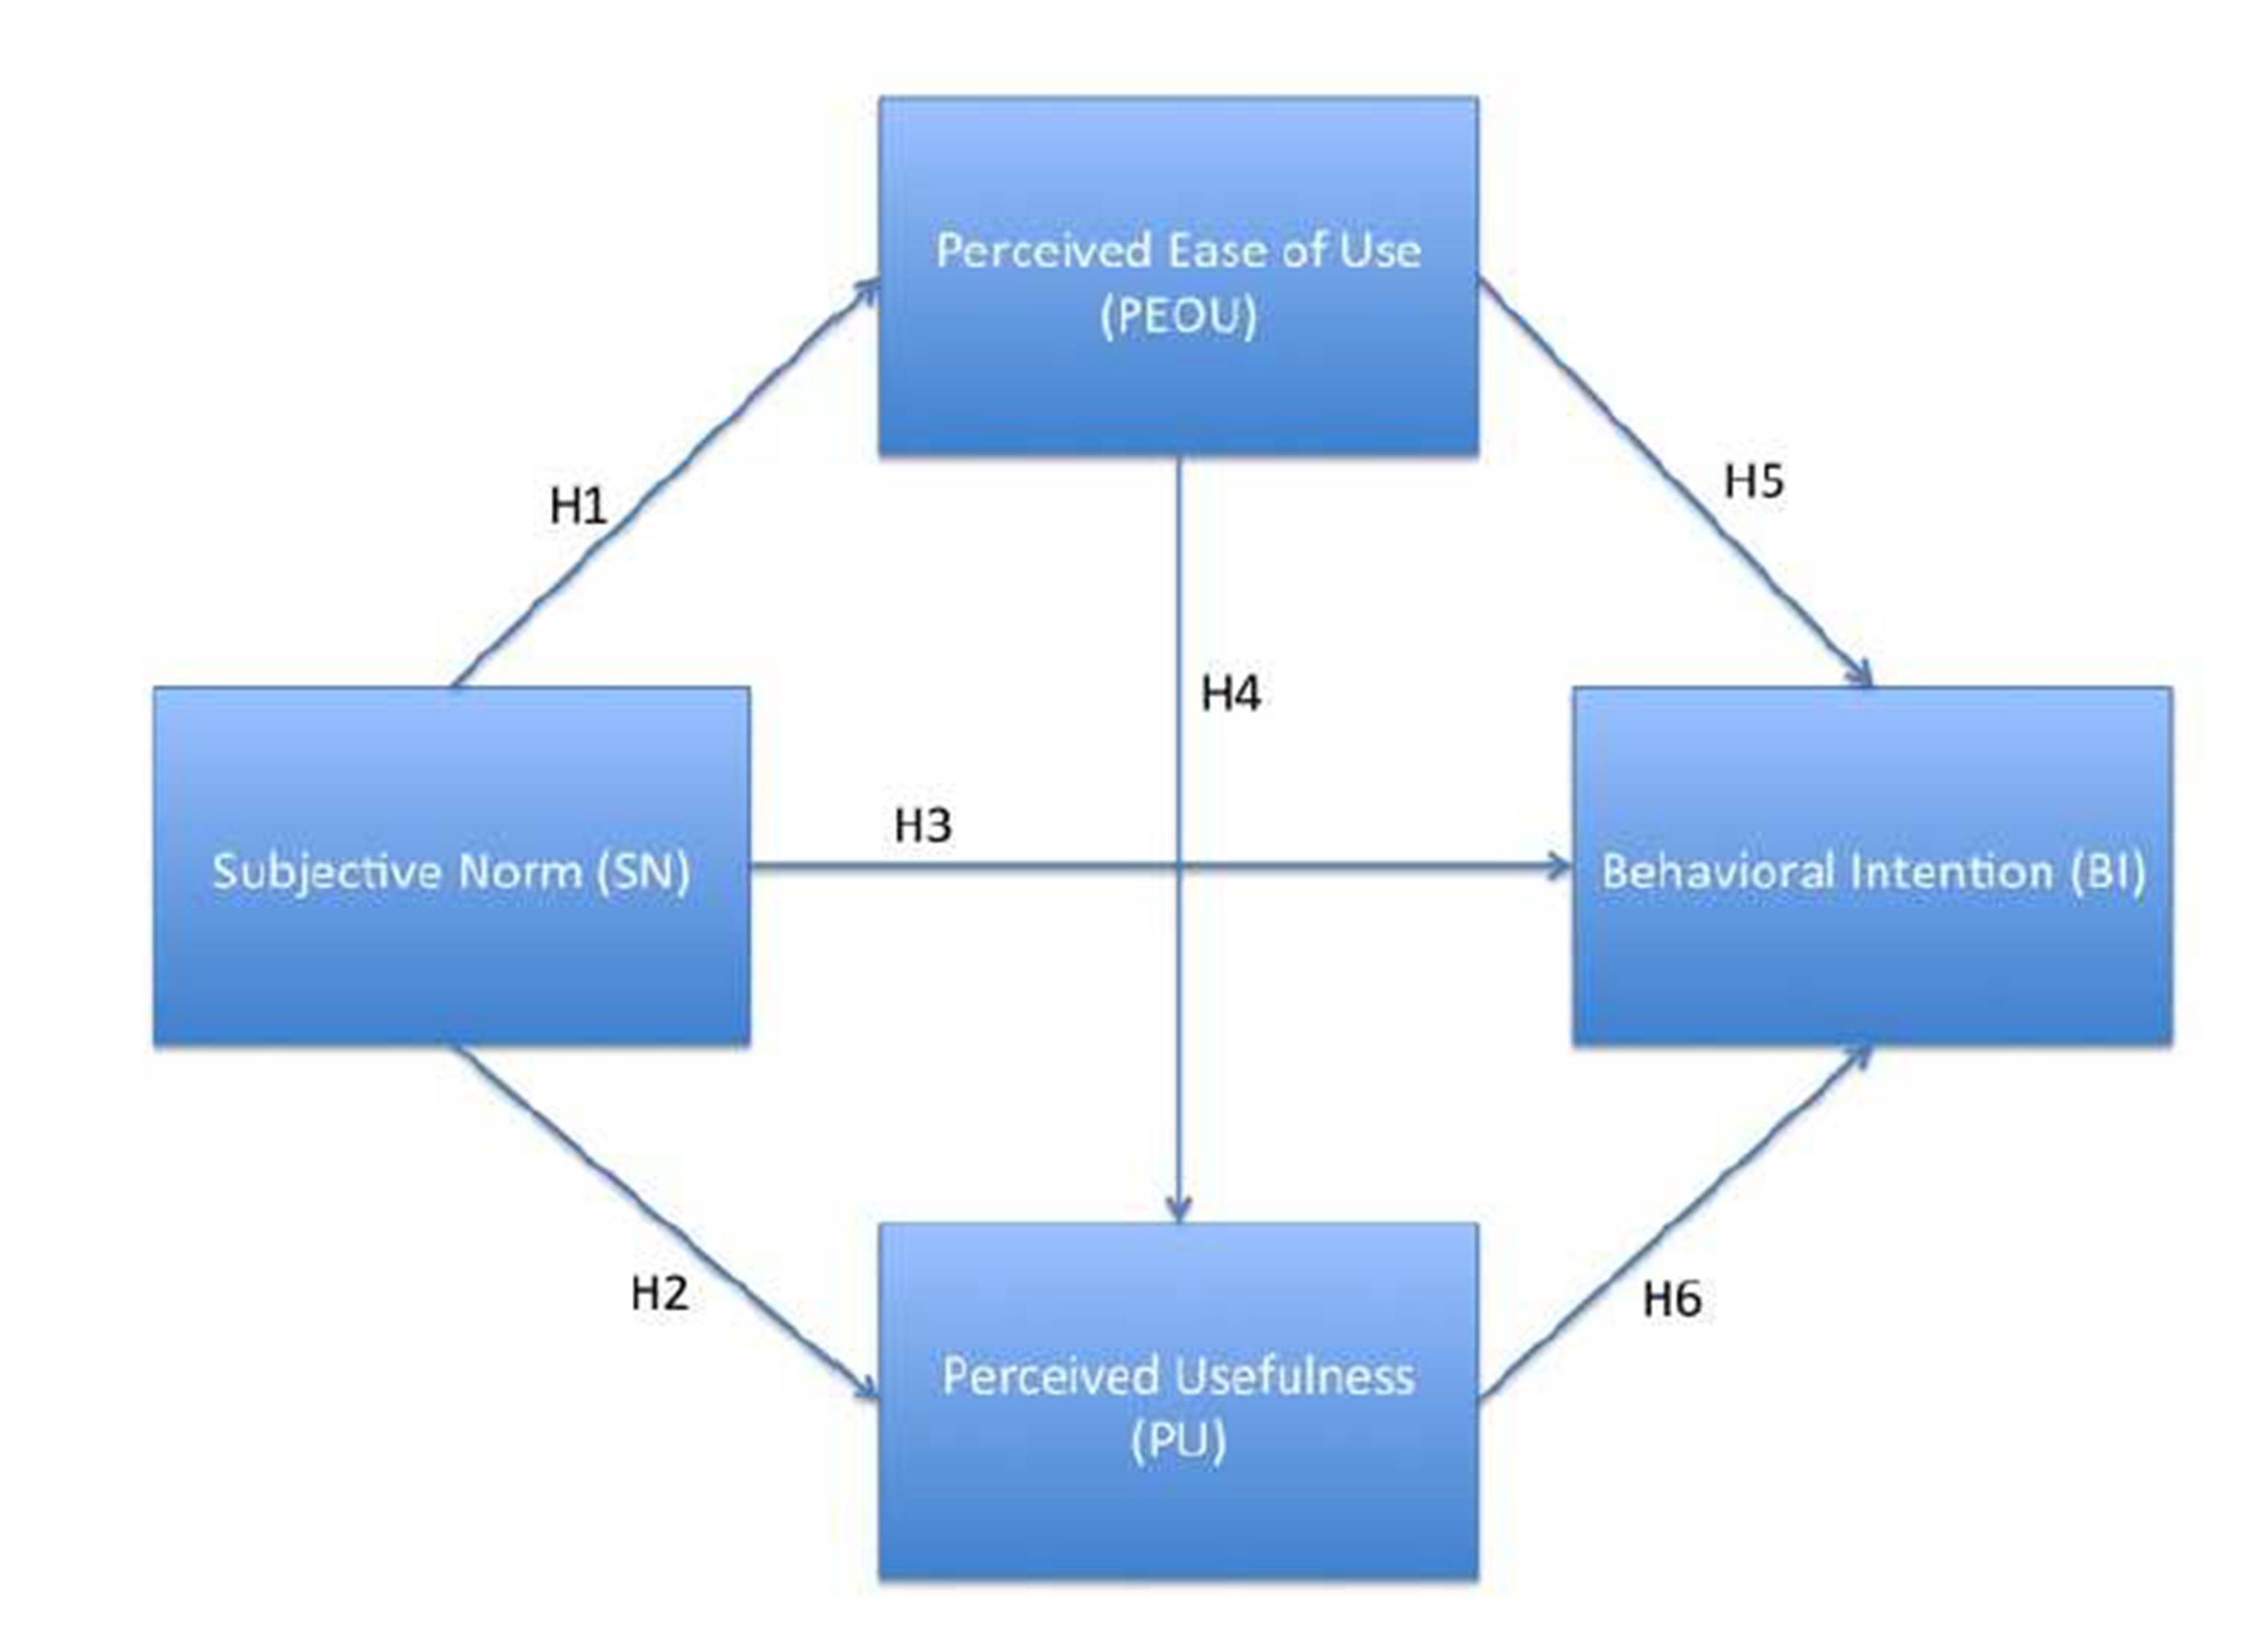
We modified the original TAM model to include the construct subjective norm (SN). Our developed research model is based upon the research of Venkatesh and Davis (2000) where developed an extension TAM 2. Their new model combines social factors and cognitive instrumental determinants into one model.
Subjective Norm (SN)
Kuwait belongs to Arab society. According to Hofstede’s dimensions, Arab (Kuwait) is categorized to be collectivist society. Accordingly, we assume that subjective norm (SN) plays sensitive role in such societies. Subjective norm (SN) is derived from Theory of Reasoned Action (TRA) where it is verified that it is major determinant of behavioral intention to use. In further developments of TAM, Venkatesh and Davis (2000) used subjective norm in TAM2 and scored important results. It is refer to “a person’s perception of what people important to him think he should or should not perform in accordance to a behavior in question” (Rouibah and Abbas, 2010). According to Venkatesh and Davis (2010), “the direct compliance effect of subjective norm is the case when an individual perceives that a social actor wants him to perform a certain behavior, and the social actor has the ability to reward the behavior or punish it in case of its absence”. We assume, thus, that users of smartphones adapt their attitude and behavior according to the groups that they belong to.
Prior studies found positive relationship between SN and perceived usefulness (PU) (Venkatesh and Davis, 2000; Yi et al., 2006; Schepers and Wetzels, 2007; Rouibah, 2008), and positive effect with behavioral intention (Venkatesh and Davis, 2000; Hung et al., 2003). Thus we hypothesis that:
– H1: Subjective norm (SN) is positively affects the perceived ease of use (PEOU).
– H2: Subjective norm (SN) positively affects the construct perceived usefulness (PU).
– H3: Subjective norm (SN) positively affects behavioral intention (BI) to use smart phones.
Perceived Usefulness (PU) and Perceived Ease of Use (PEOU)
The original work of TAM by Davis (1989) introduced the cognitive construct and established in TAM the relationship between the most important two factors in the model, i.e. perceived ease of use (PEUO) and perceived usefulness (PU). It is been tested and verified by plenty of studies that PEOU is major predictor of PU (King and He, 2006). According to literature (King and He, 2006; Bruner and Kumar, 2005; Hu et al., 1999; Igbaria and Livari, 1995; Shyu et al., 2011) users normally consider a technology is useful when they perceive it to be easy to use. PU is defined as “the degree to which a person believes that using a particular system would enhance his or her job performance” (Davis, 1989, p. 320). Consequently, it is the degree to which one believes that using smartphone enhances his performance for any purpose (personal, professional, social, or academic).
PEOU is defined by Davis (1989) as “the degree to which a person believes that using a particular system would be free of effort” (Davis, 1989, p. 320). Accordingly, we define perceived ease of use in the context of using smart phones as the degree to which a person believes that using a smart phone would free himself/herself from an effort (can be personal, social, academic, or professional) (Abbas, 2014).
Prior studies verified the positive influence over behavioral intention by both perceived usefulness and perceived ease of use (Shyu et al., 2011; Adams et al., 1992; Davis et al., 1992; Hu et al., 1999; Venkatesh and Davis, 1996; Venkatesh and Davis, 2000). Thus we state the following hypotheses:
– H4: Perceived ease of use positively affects perceived usefulness.
– H5: Perceived ease of use positively affects behavioral intention to use smart phones.
– H6: Perceived usefulness positively affects behavioral intention to use smart phones.
The research model is depicted in Figure 1

Research Method
Population Sampling and Data
Our collection data is a two-stage model. We first began the process by collecting pilot study data. The pilot samples are 30 of Arabic language speakers. According to piloty study and data, the questionnaire is updated and revised accordingly where many necessary changes were needed before beginning the next and final stage of data collection. Random samples of 450 smart phone users in the State of Kuwait were collected using stratified random sample.
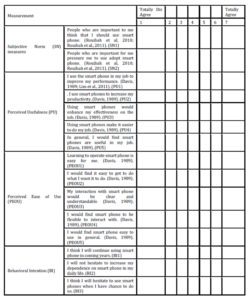
Measurements
The measurements are based upon previous studies. Since the publication in the field of technology acceptance is limited in this area, we modified study measurements from foreign studies and tailored them to fit our analysis.
The translation was the most critical step in using previous studies measurements since the translation cannot be word by word. The pilot study showed many variations of meaning between the two instruments (English vs. Arabic). This is why we modified the statements and measurements to be understandable and at the same reflect correctly the scientific meaning. For this purpose, we showed the new modified versions of the instruments to two of professional scientists in the field with Arabic and English capabilities to verify the translation and the scientific meanings of the instrument.
Sample Characteristics
Table 1 shows the demographics of sample: gender distribution tends to favor the female (57.1% vs. 42.9% for male). Among the sample, 92.1% were Kuwaiti nationality, 4.9% were non-Kuwaitis (Arabs or non Arabs).
Table 1: Study sample characteristics and distribution
Reliability and Validity
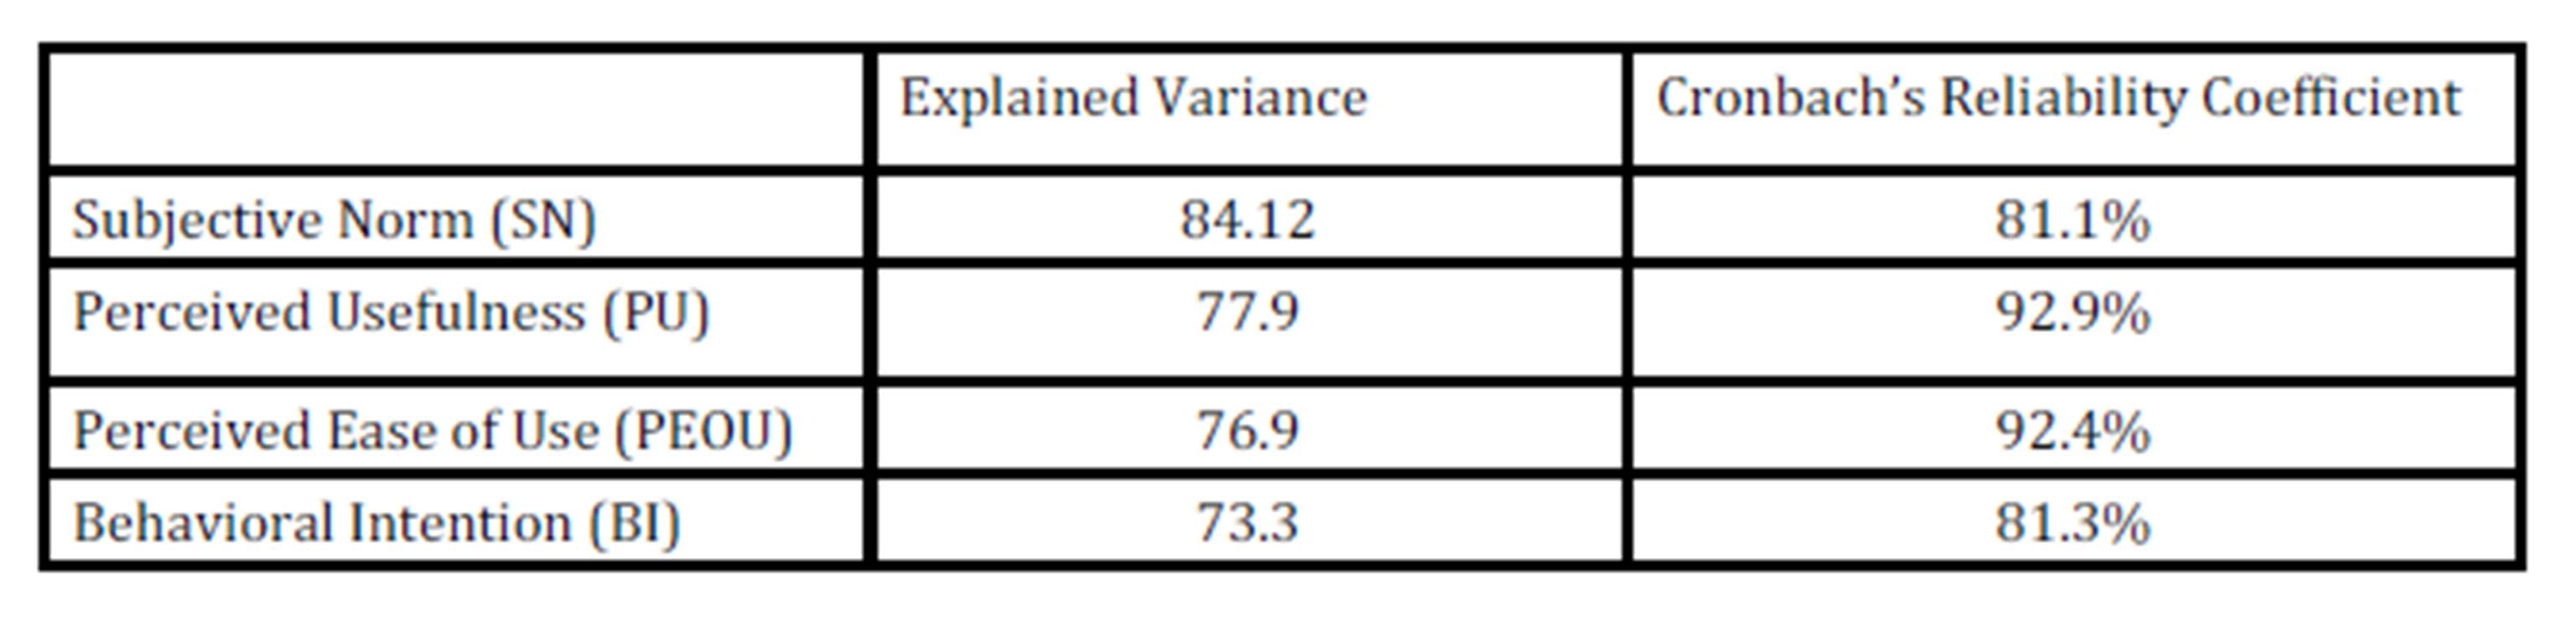
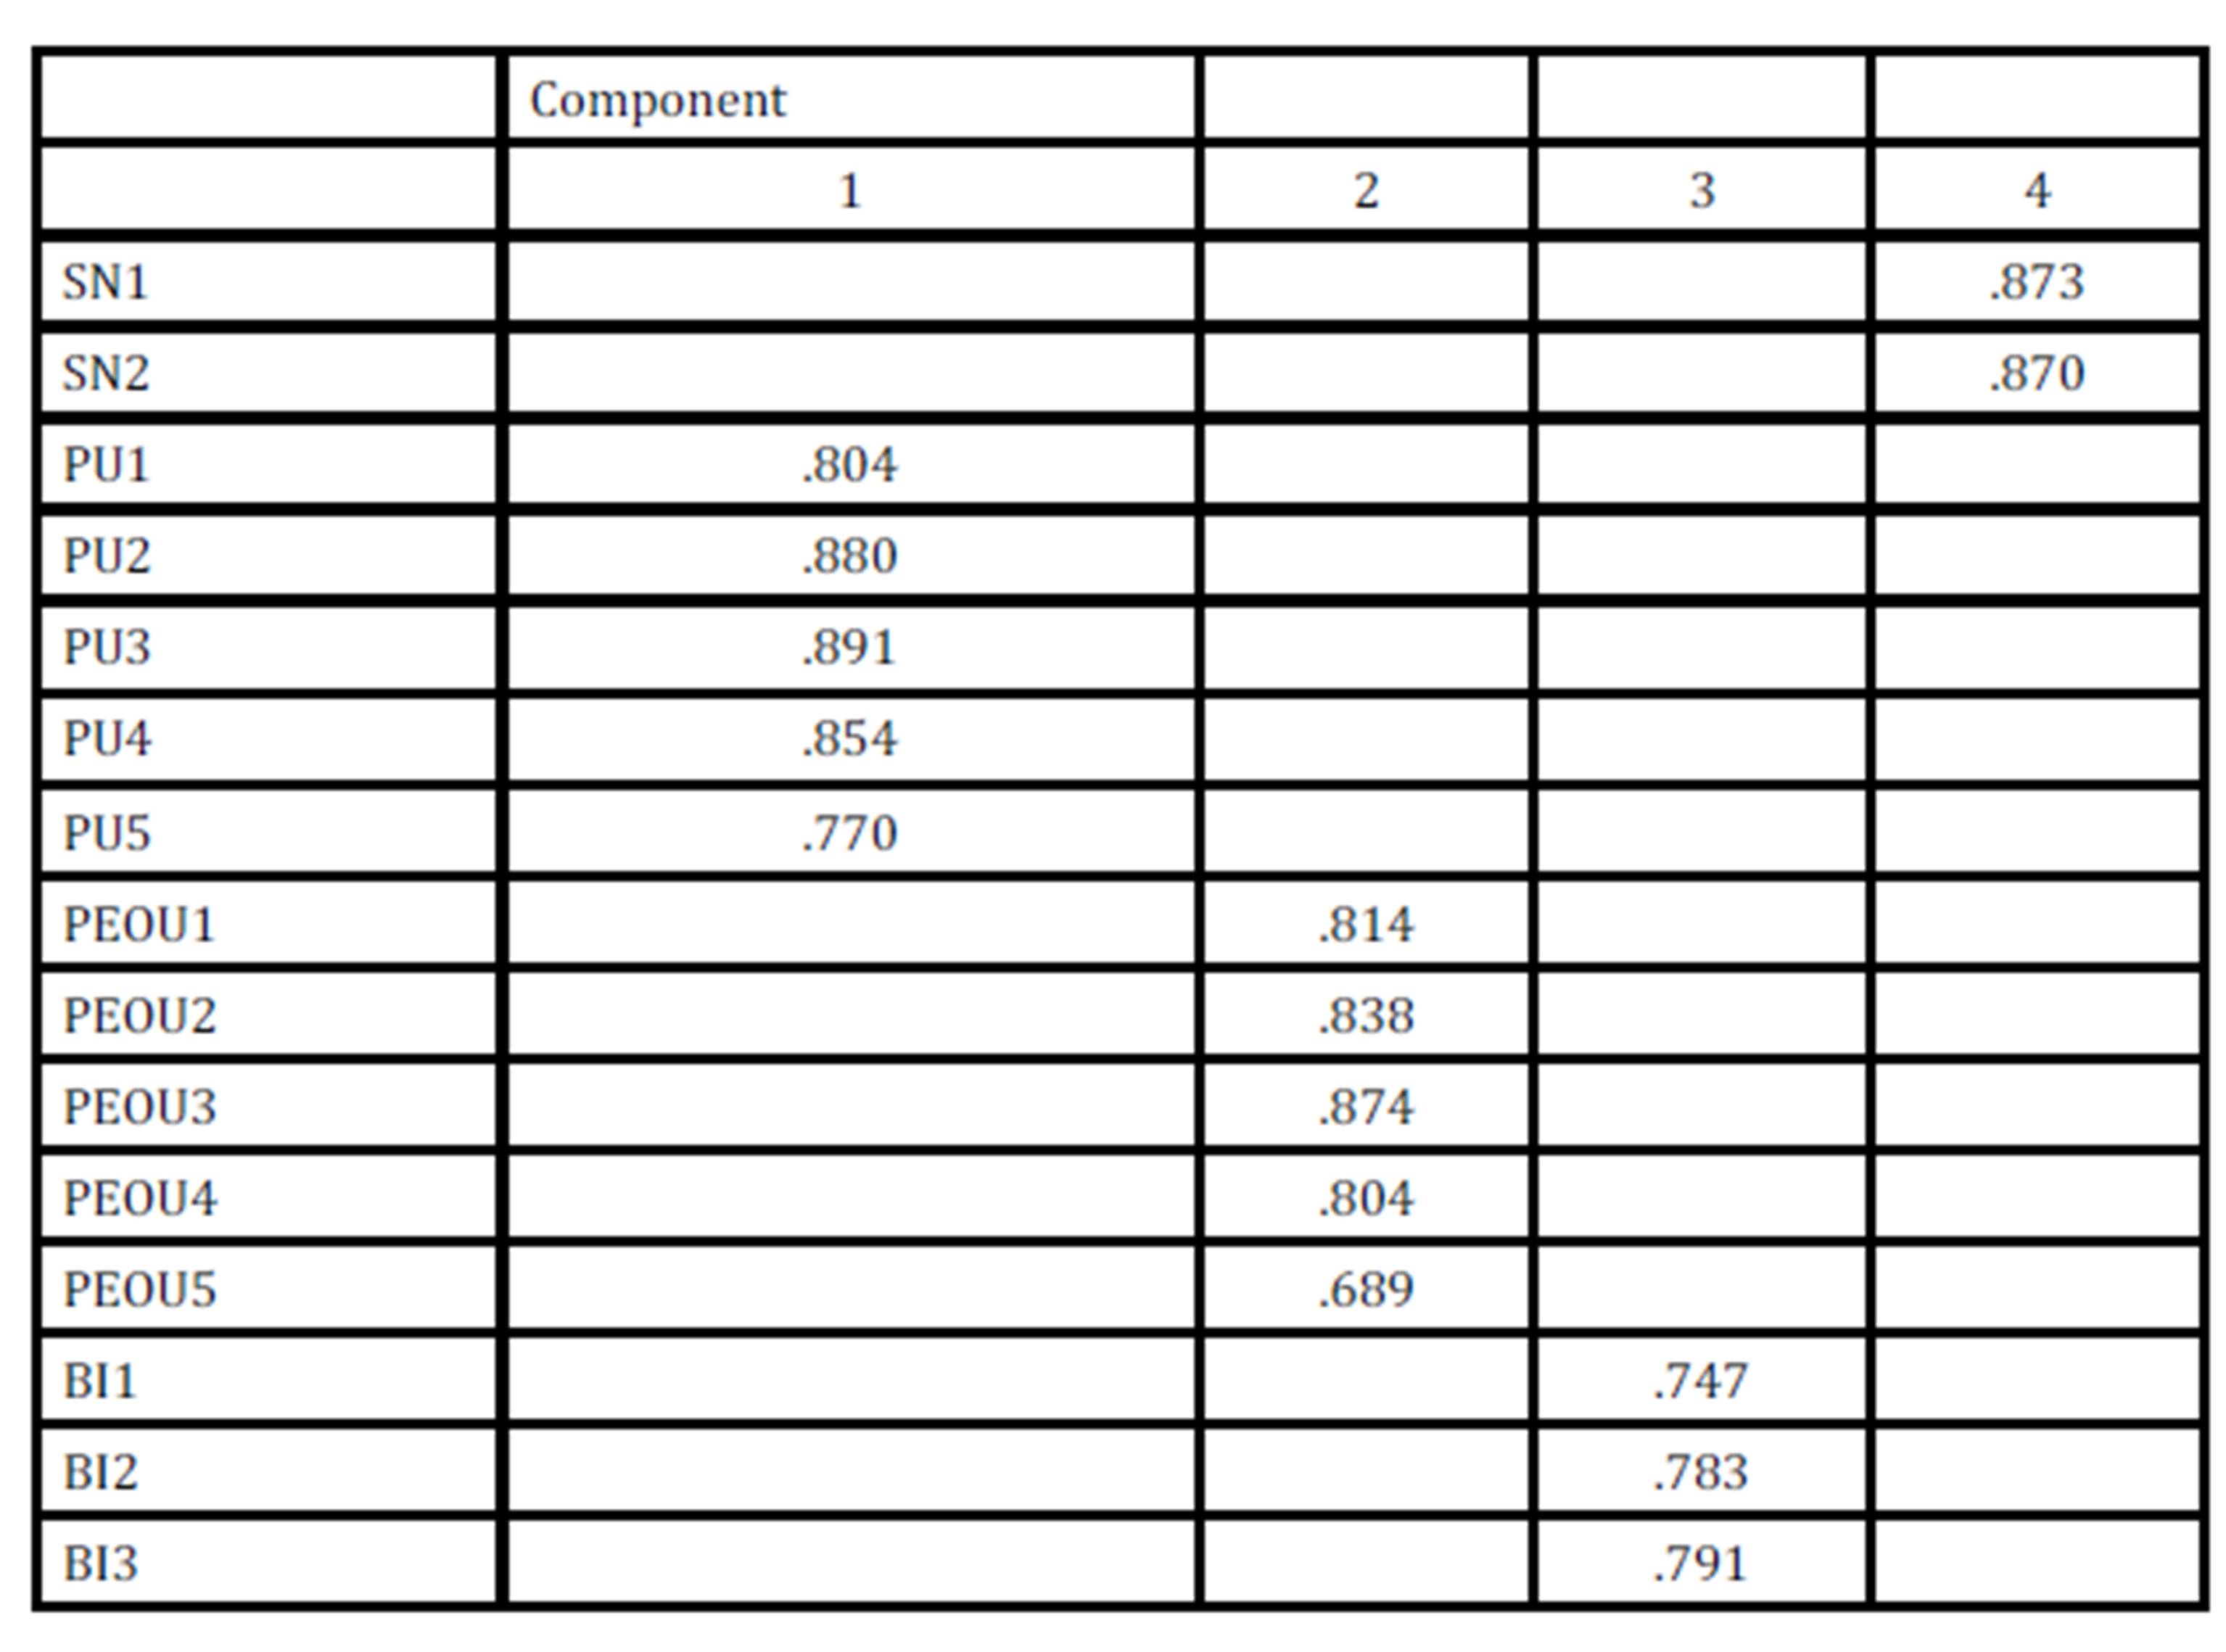
The overall Cronbach’s reliability coefficient Alpha is high (92.2%), which illustrates an acceptable consistency among instruments. The measurements that were used are more than those explained in the following table. Table 2 explains the Cronbach’s reliability Alpha coefficient and explained variance per each latent construct. Table 3 collects the factor loadings of study measurements.
Table 2: Cronbach’s reliability coefficients and explained variance of study latent constructs
The data were under many analyses and testing in order to build sound research model. We ran into different stages of discriminate validity test before going into further analysis. Finally, and after many rounds of pilot studies, we gathered our data that were found to be sound (see Table 3).
Table 3: Factor loadings of study measurements
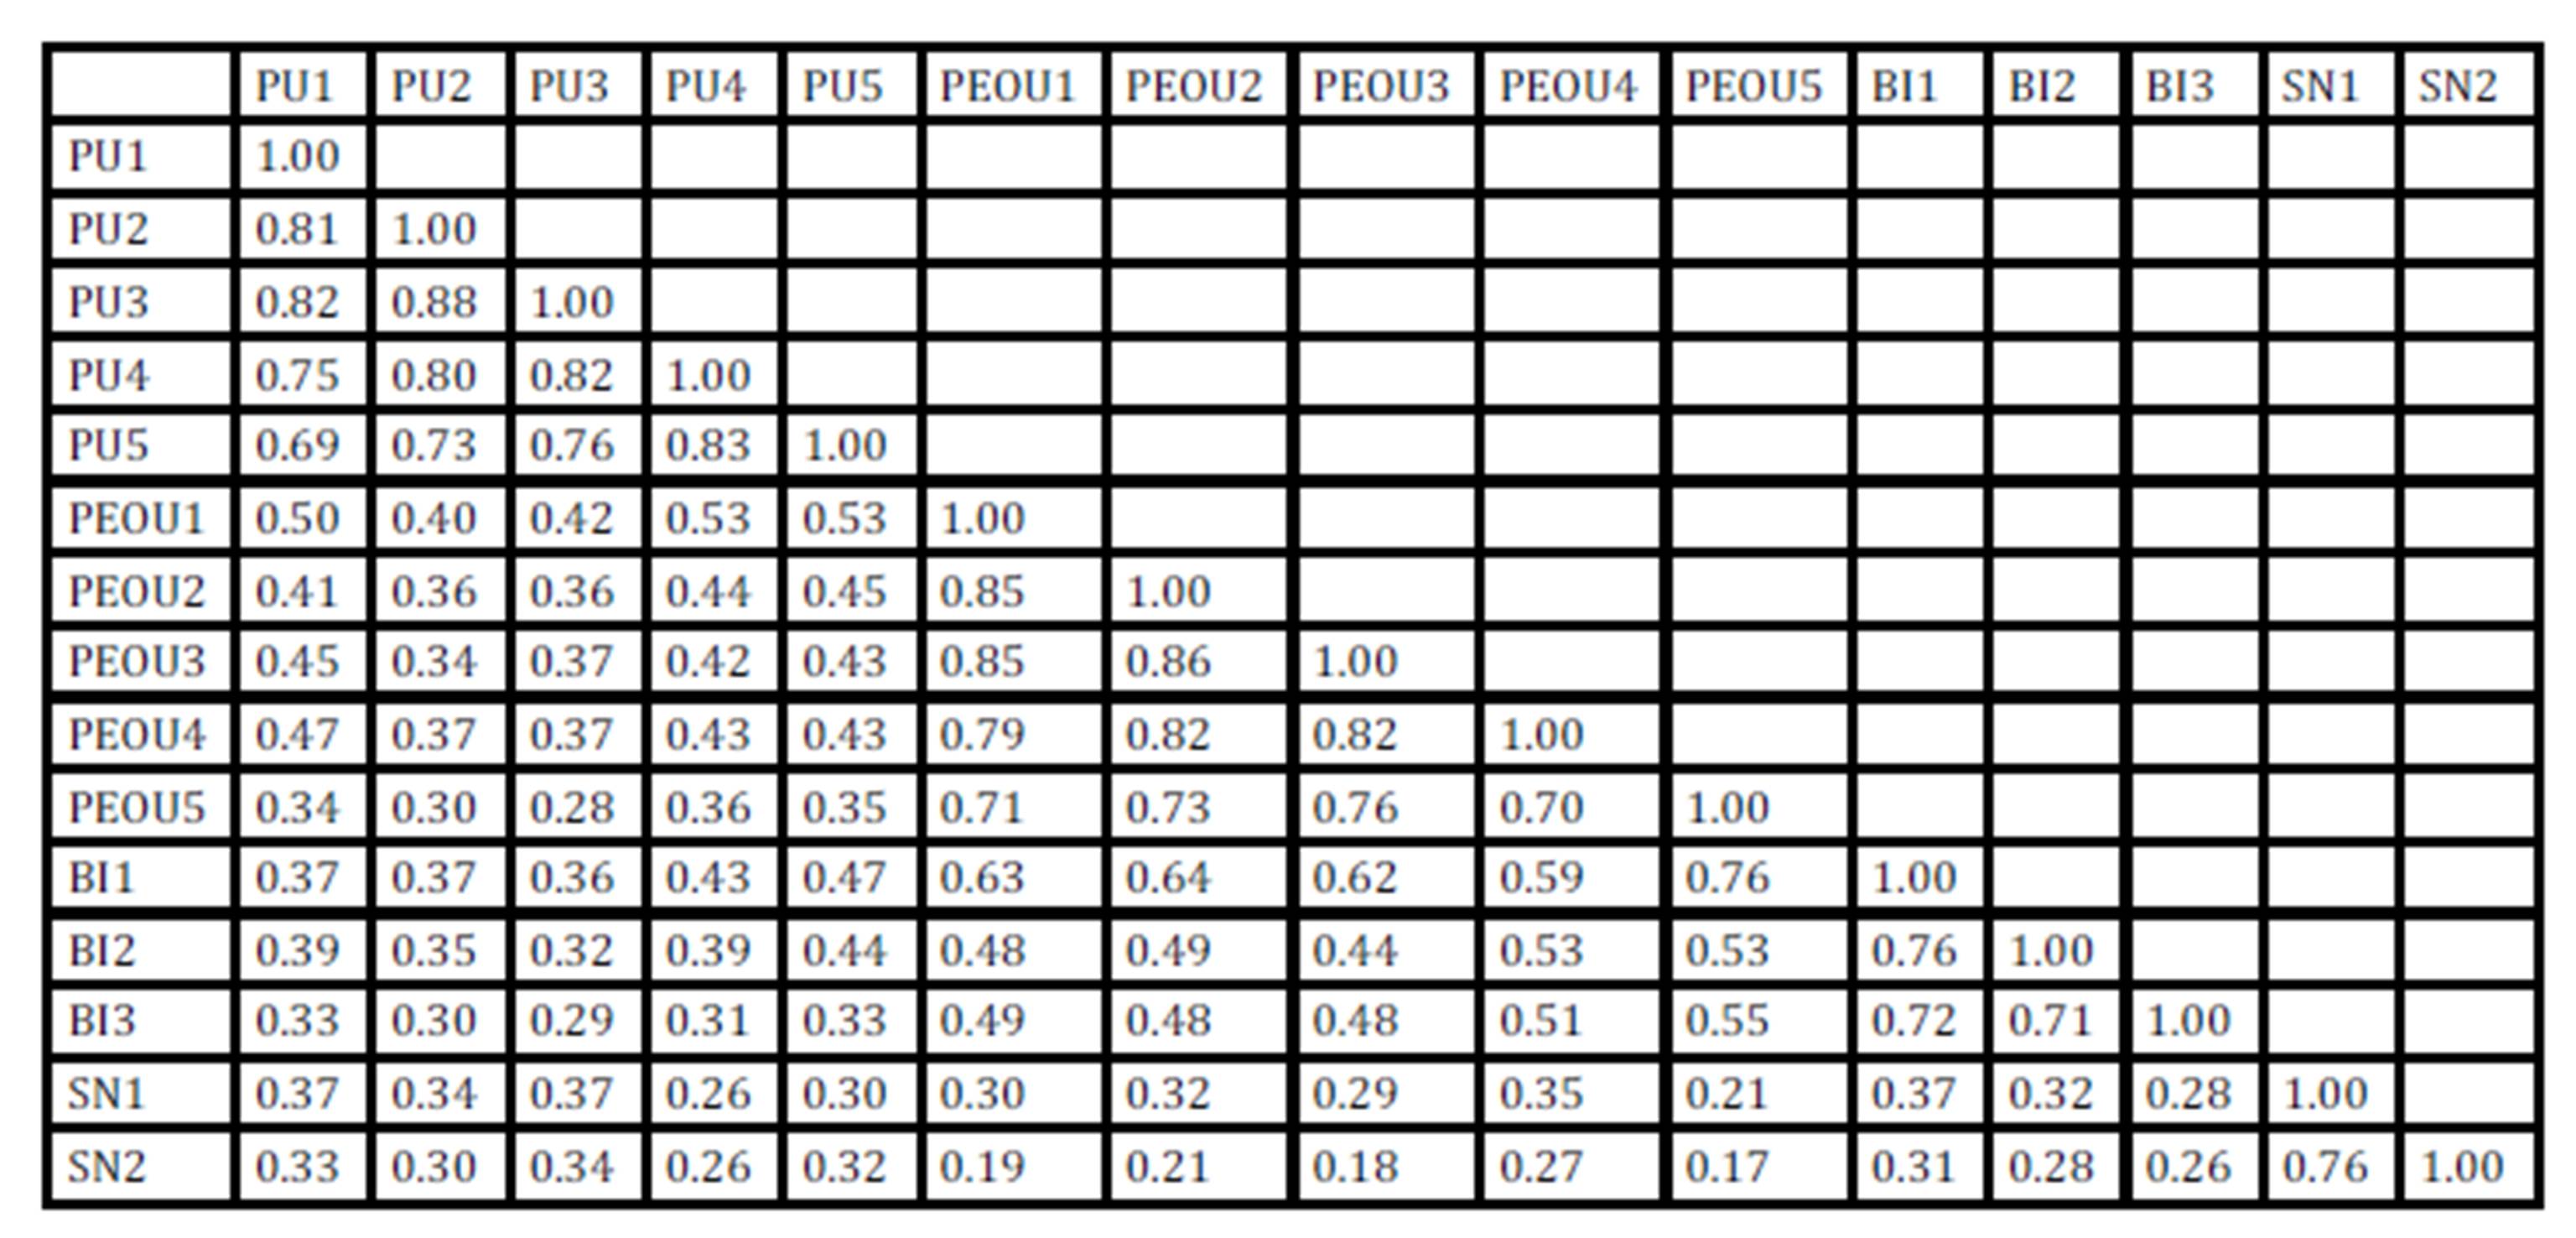
Table 4: Inter-construct correlations
Testing the Research Model
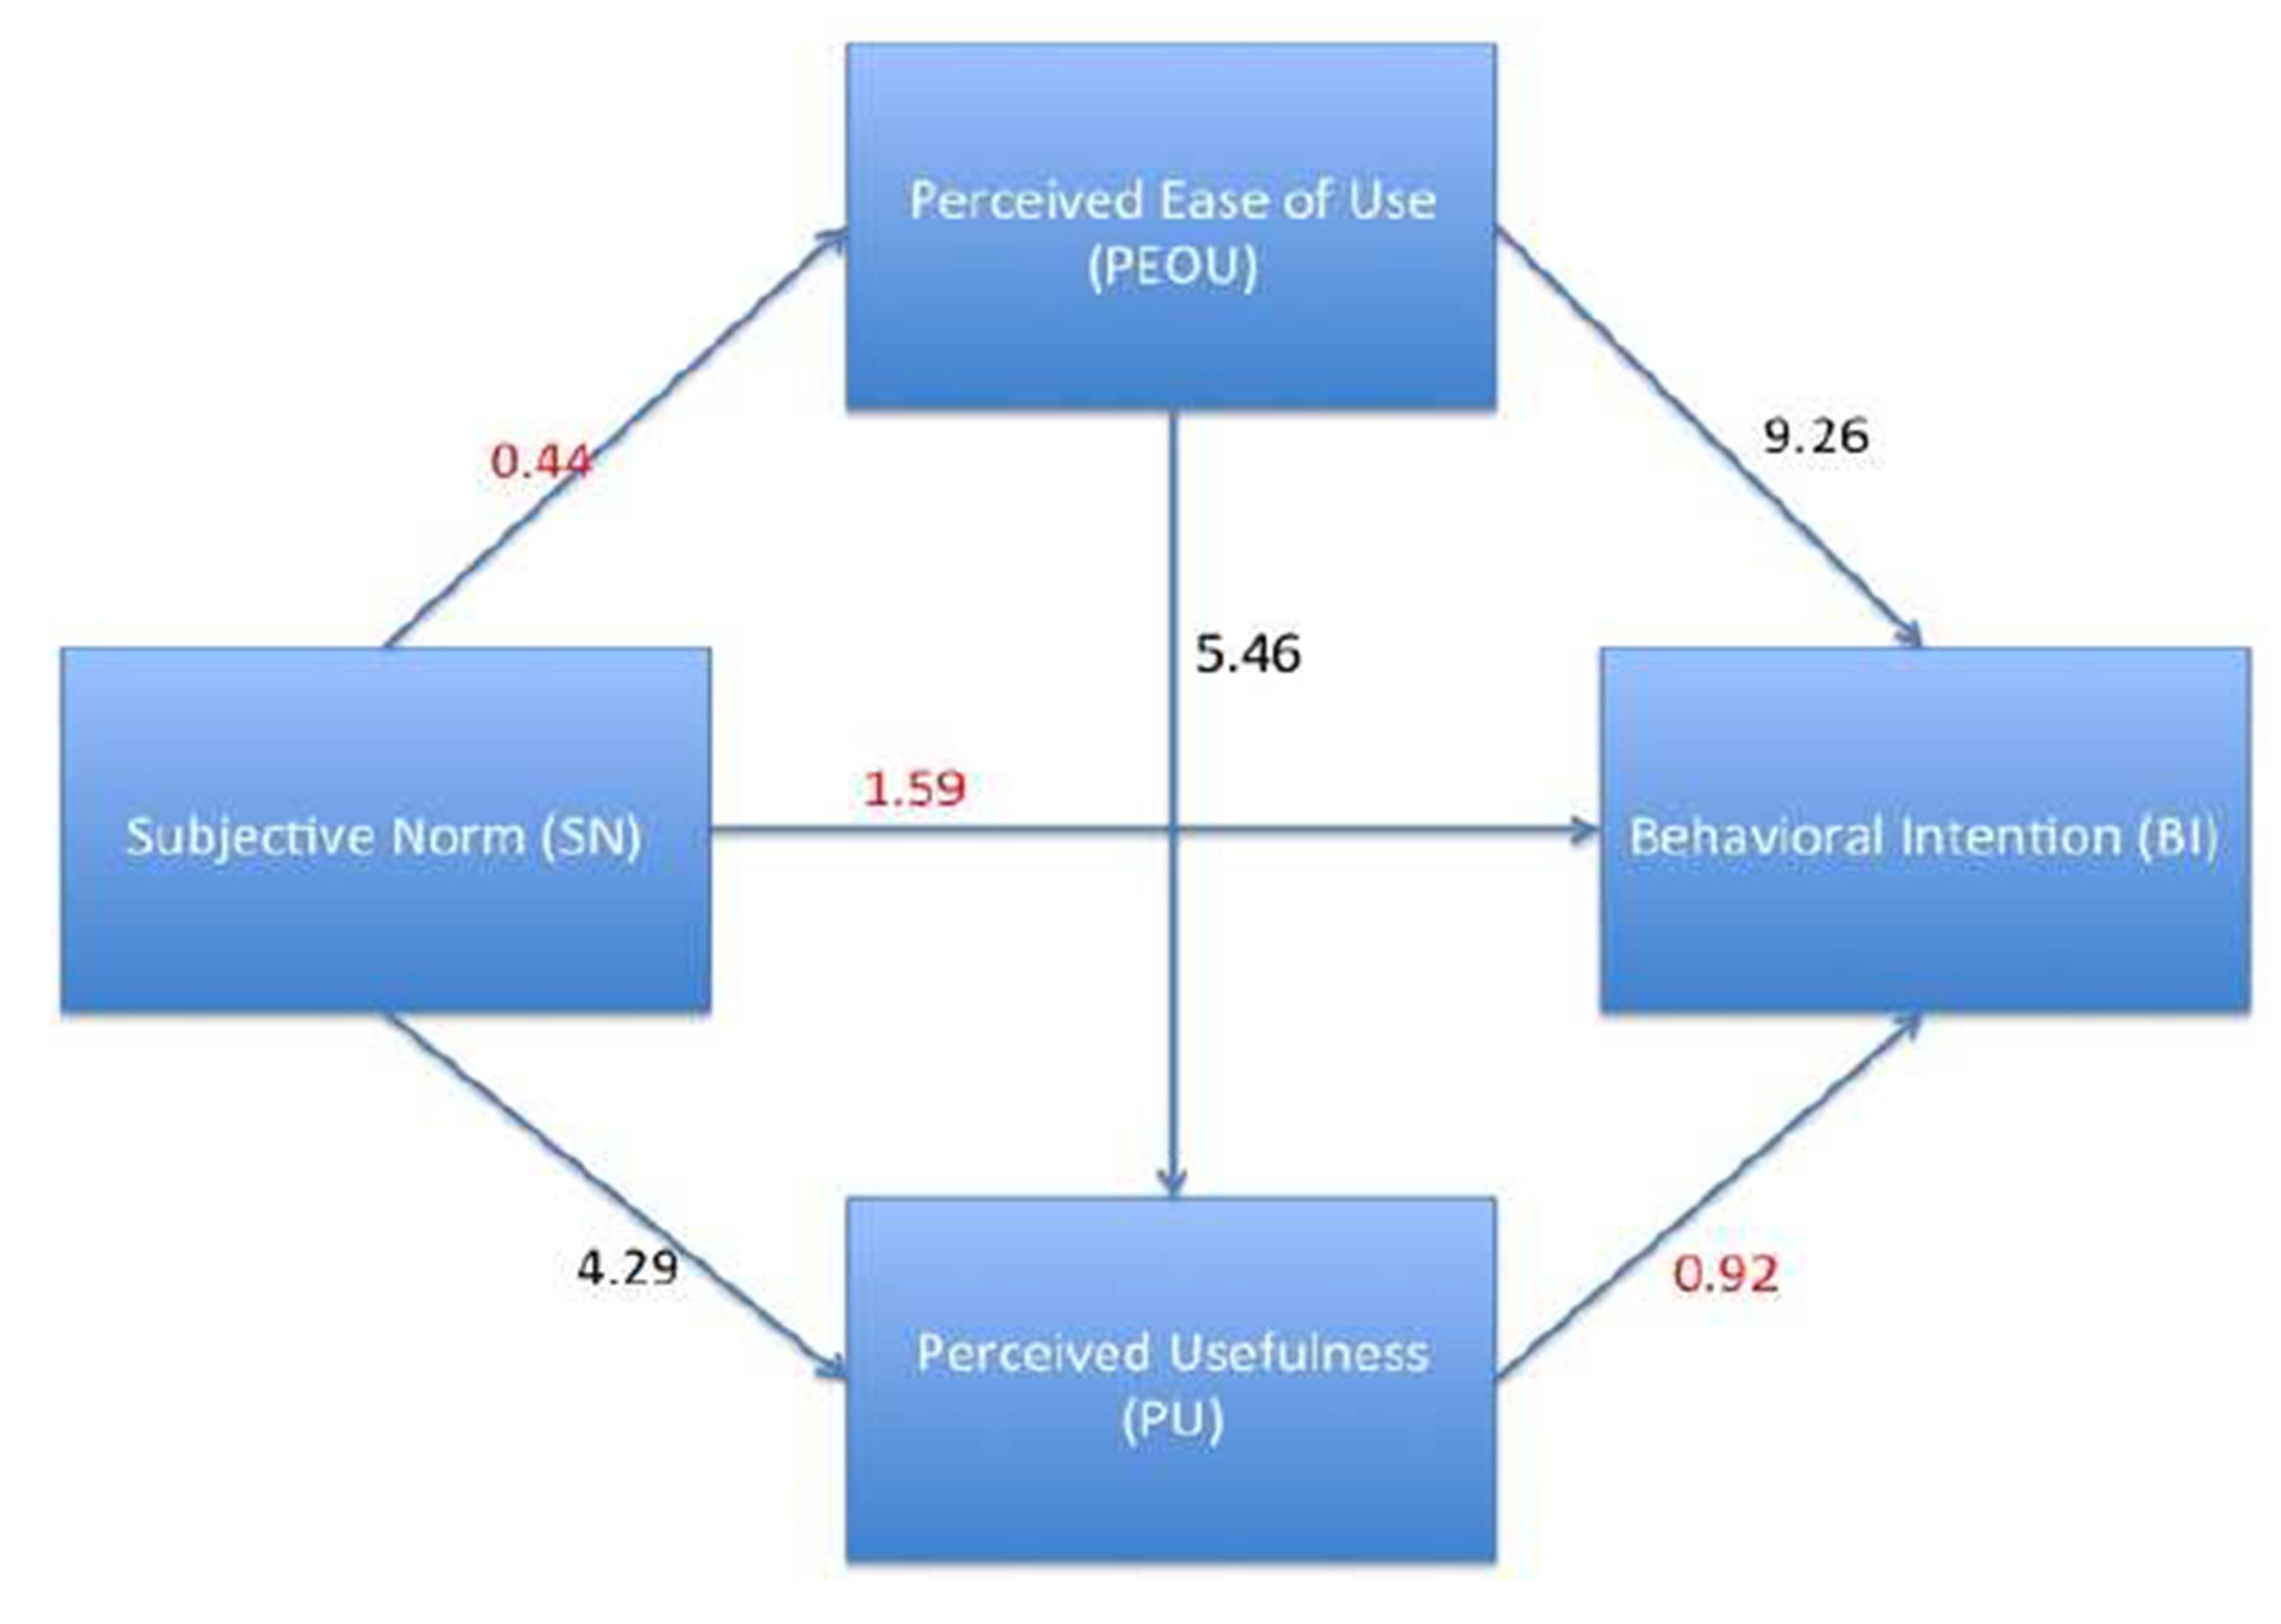
To identify the important and significance of our study relationships and the connections between study constructs, we used LISREL 8.54 software to run structured equation modeling, which verifies and tests the importance of influences between constructs. Figure 2 is the research model with path significance.
Figure 2: Results of Hypotheses Testing and Path Analysis
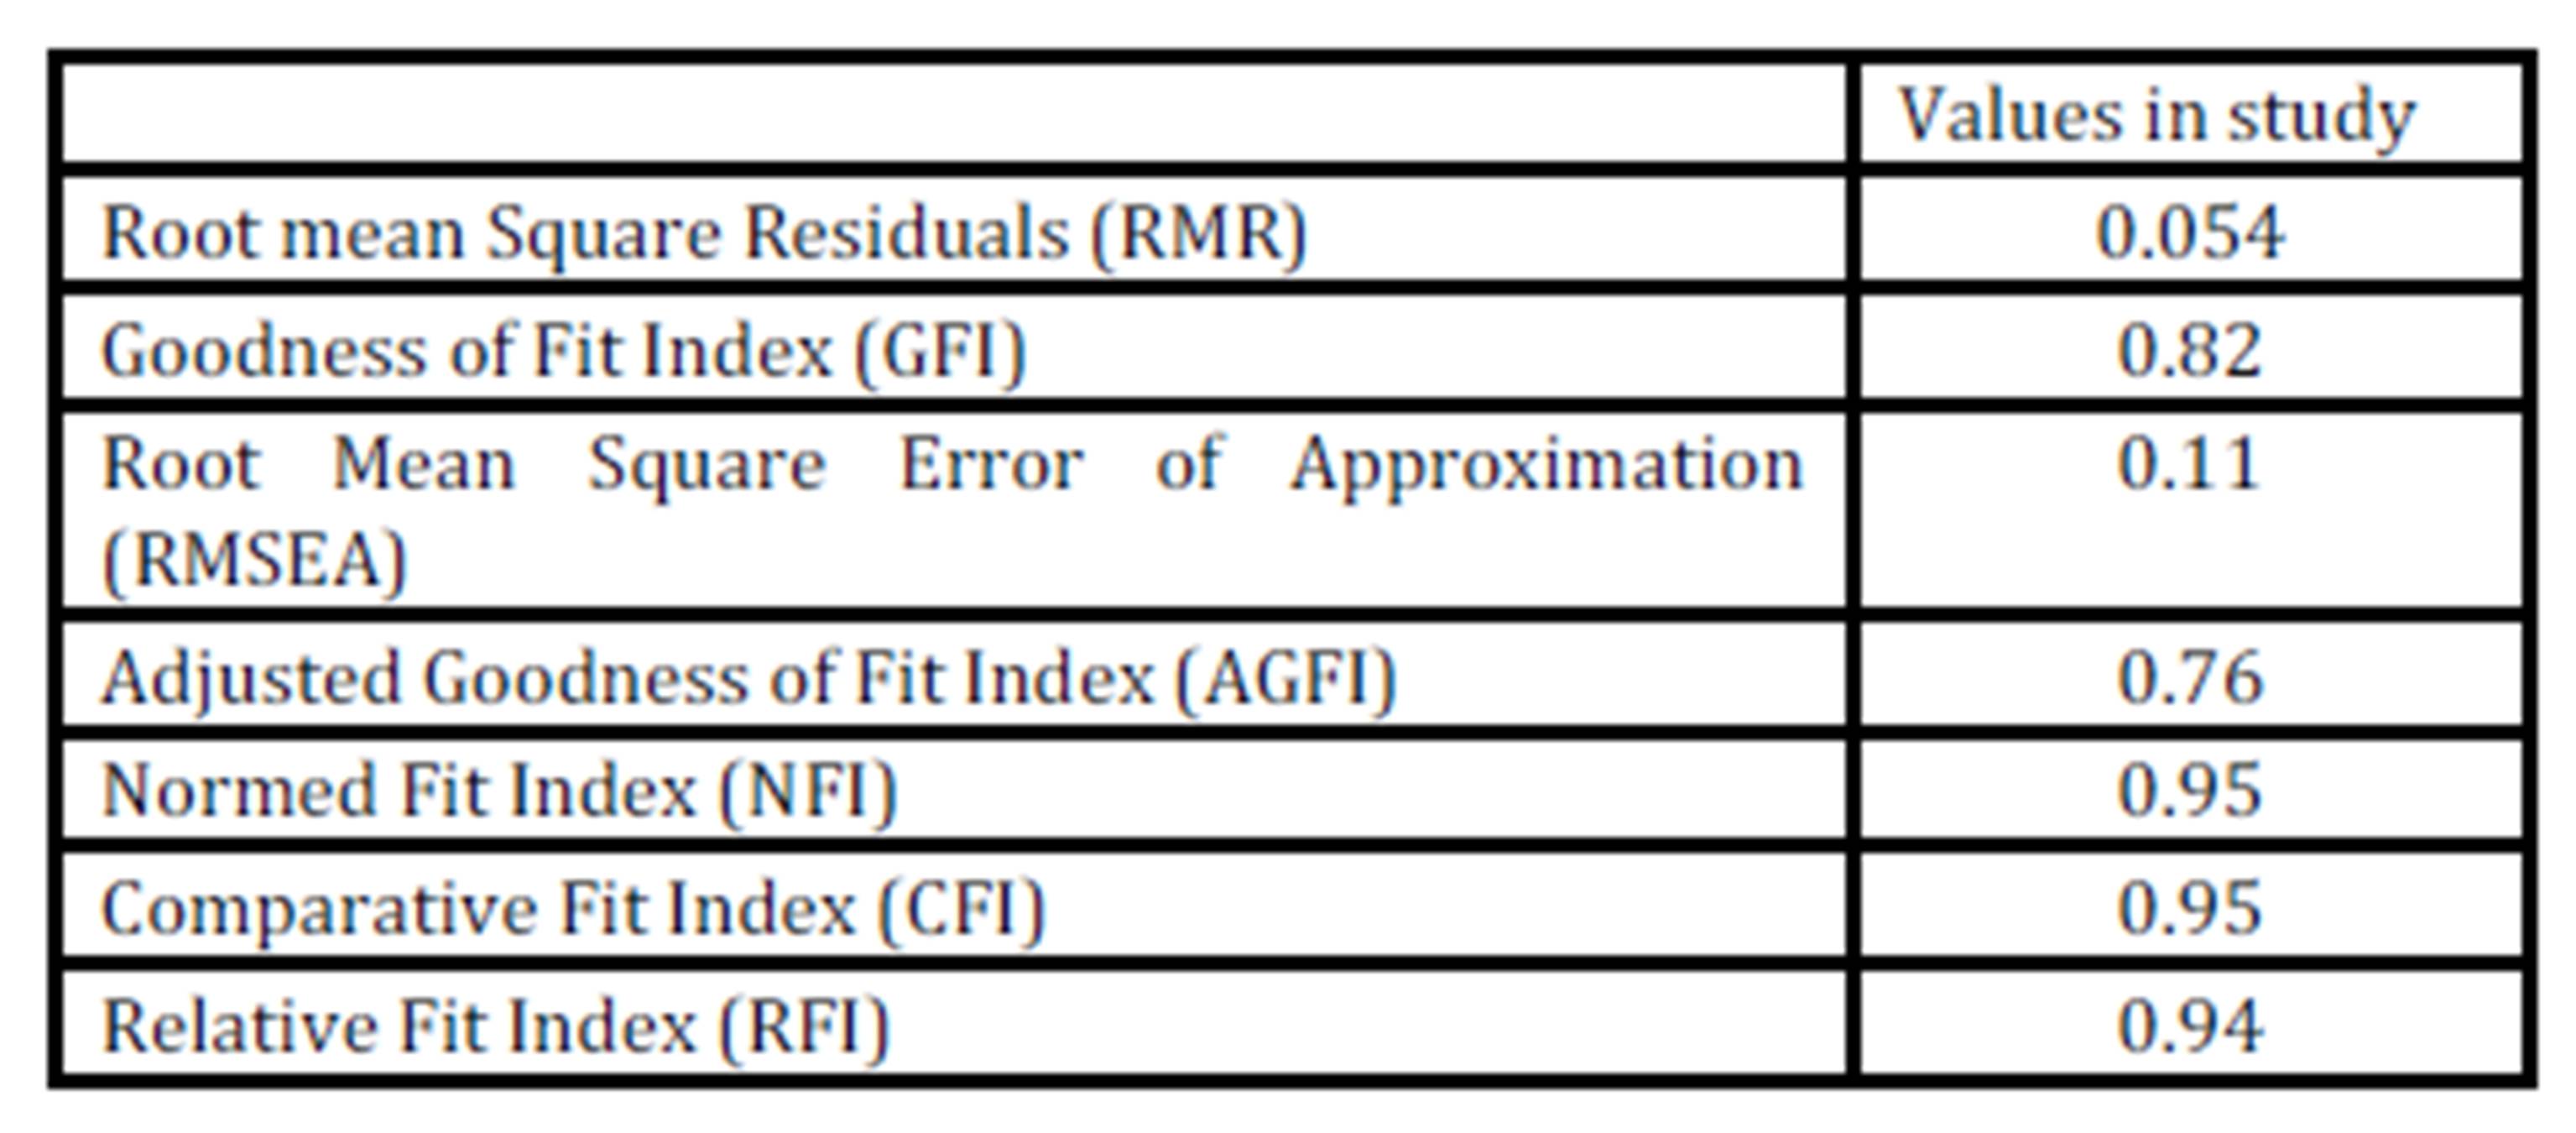
It is obvious from Figure 2 that results show some significant paths and effects between constructs. Table 5 views the results of structured of equation modeling (goodness of fit analysis).
Table 5: Goodness of fit statistics of the study
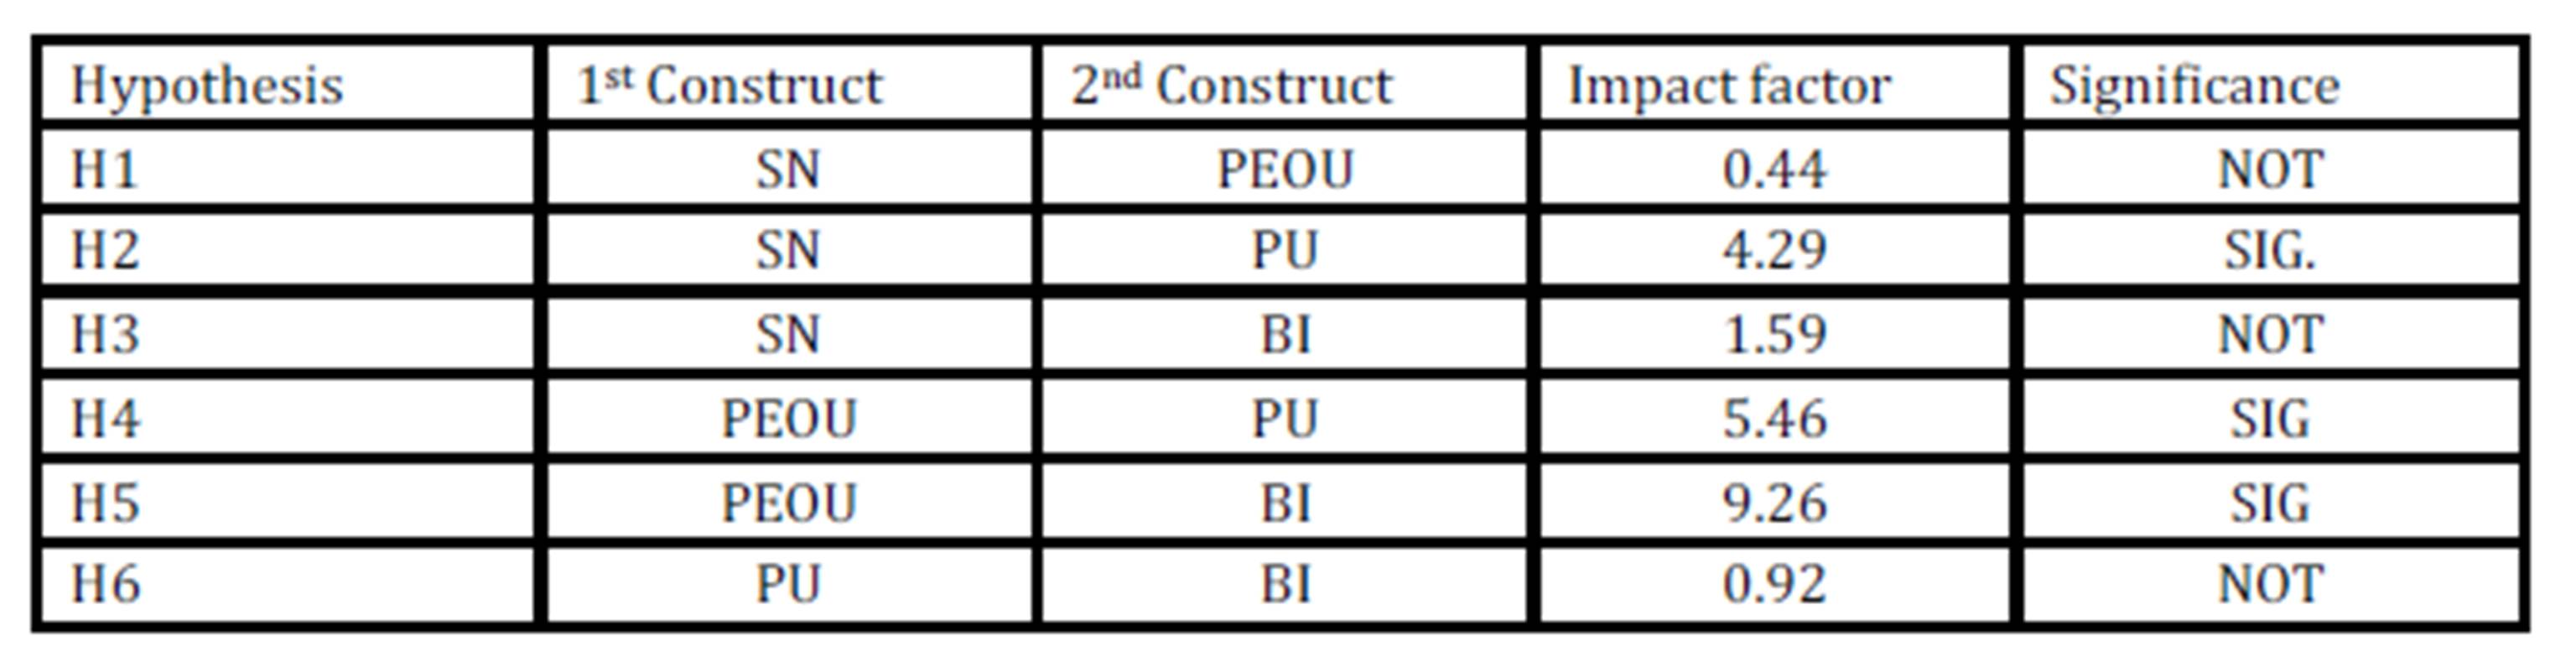
Results show that subjective norm has neither significant effect over perceived ease of use, nor on behavioral intention. The following table (Table 6) presents the study hypothesis and whether they were supported.
Table 6: Testing Study Hypotheses
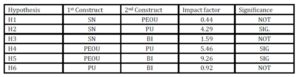
One of most important findings in our study is that perceived usefulness (PU) has no significant association with behavioral intention (H6). This is one interesting finding from our result.
Conclusion
We studied Kuwaiti mobile consumer market. The aim was to measure the Kuwaiti consumer market acceptance to use smartphones.
The study comes in alignment with prior studies, in that, significant associations were found. Subjective norm (SN) found to have positive association with perceived usefulness (PU). However, SN was also found not to have significant association with perceived ease of use (PEOU), and also no significance with behavioral intention (BI). PEOU affects positively and significantly over the behavioral intention and perceived usefulness constructs.
Notes
1This project is supported by Kuwait Foundation for the Advanced of Sciences (KFAS 2010-1103-05)
References
1. Abbas, Hasan. (2014). Antecedents of consumers’ behavioral intentions to use smartphones in Arab World. To be published soon.
2. Adams, D. A., Nelson, R. R., and Todd, P. A. (1992). Perceived usefulness, ease of use, and usage of information technology. A replication. MIS Quarterly, 16 (2), 227 – 247.
Publisher – Google Scholar
3. Altman, Roger. (2009). The great crash, 2008. Foreign Affairs, Januar/February, 2009.
Google Scholar
4. BBC News. (2010). Over 5 billion mobile phone connections worldwide. (March, 2014), http://www.bbc.co.uk/news/10569081.
5. Bowlby, J. (1969). Attachment and loss. Vol. 1: Attachment. New York: Basic Books.
6. Bruner, G. C., and Kuwar, A. (2005). Explaning consumer acceptance of handheld Internet devices. Journal of Business Research, 58 (5), 553 – 558.
Publisher – Google Scholar
7. Chen, Kuanchin, Chen, Jengchung V., and Yen, David C. (2009). The acceptance and diffusion of the innovative smart phone use: A case study of a delivery service company in logistics. Information & Management, 46(4), 241 – 248.
Publisher – Google Scholar
8. Chen, Kuanchin, Chen, Jengchung V., and Yen, David C. (2011). Dimensions of self-efficacy in the study of smart phone acceptance. Computer Standards & Interfaces, 33(4), 422 – 431.
Publisher – Google Scholar
9. Davis, F. D. (1989). Perceived usefulness, perceived ease of use, and user acceptance of information technology. MIS Quarterly, 13(3), 319 – 340.
Google Scholar
10. Davis, F. D., Bagozzi, R. P., and Warshaw, P. R. (1989). User acceptance of two theoretical models. Management Science, 36, 982 – 1003.
11. Davis, F. D., Bagozzi, R. P., and Warshaw, P. R. (1992). Extrinsic and intrinsic motivations to use computers in the workplace. Journal of Applied Social Psychology, 22 (14), 1111 – 1132.
Publisher – Google Scholar
12. Fishbein, M., and Ajzen, I. (1975). Belief, attitude, intention and behavior: An introduction to theory and research. Addison-Wesley, Reading: Massachusetts.
13. Hasan, B., and Ahmed, M. U. (2007). Consumer behavior in online game communities: A motivational factor perspective. Computer Human Behavior, 23 (3), 1642 – 1659.
14. Hashemi, Masoud, and Ghasemi, Babak. (2011). Using Mobile Phones in Language Learning/Teaching. Procedia Social and Behavioral Sciences, 15, 2947 – 2951.
15. Hofstede, G. (1980) Culture’s consequences: International differences in work-related values. Newbury Park, CA: Sage.
16. Hong, W. Thong, J. Y. I., and Wong, W. M. (2002). TAM, determinants of user acceptance of digital libraries: An empirical examination of individual differences and systems characteristics. Journal of Management Information Systems, 18 (3), 97 – 124.
Google Scholar
17. Hu, J., Chau, Y. K., Sheng, R. L., and Tam, K . Y. (1999). Examining technology acceptance model using physician acceptance of telemedicine technology. Journal of Management Information Systems, 16 (2), 91 – 112.
Publisher – Google Scholar
18. Hung, Shin-Yuan, Ku, Cheng-Yuan, and Chang, Chia-Ming. (2003). Critical factors of WAP services adoption: An empirical study. Electronic Commerce Research and Applications, 2, 42 – 60.
Publisher – Google Scholar
19. Igbaria, M., Iivari, J., and Maragahh, H. (1995). Why do individuals use computer technology? A Finnish case study. Information Management, 29 (5), 227 – 238.
Publisher – Google Scholar
20. King, S. and Garrison, G. (2009). Investigating mobile wireless technology adoption: An extension of the technology acceptance model. Information Systems Frontiers, 11 (3), 323 – 333.
Publisher – Google Scholar
21. King, W. R., and He, J. (2006). A meta-analysis of the technology acceptance model. Information Management, 43 (6), 740 – 755.
Publisher – Google Scholar
22. Koury, Sandra, Soroa, Yang, and Kenneth, C. C. (2010). Factors affecting consumers’ responses to mobile advertising from a social norm theoretical perspective. Telematics and Informatics, 27(1), 103 – 113.
Publisher – Google Scholar
23. Lewis, W., Agarwal, R., and Sambamurth, V. (2003). Sources of influence on beliefs about infomration technology use: An empirical study of knowledge workers. MIS Q, 27 (4), 657 – 678.
Google Scholar
24. Li, Dahui, Chau, Patrick Y. K., and Lou, Hao. (2005). Understanding individual adoption of instant messaging: An empirical investigation. Journal of the Association for Information Systems, 6 (4), 102 – 129. April, 2005.
Google Scholar
25. Liao, C., Palvia, P., & Chen, J. (2009). Information technology adoption behavior life cycle: Toward a Technology Continuance Theory (TCT). International Journal of Information Management, 29, 309 — 320. doi:10.1016/j.ijinfomgt.2009.03.004.
Publisher – Google Scholar
26. Liquat, Hosain, and Anjali, de Silva. (2009). Exploring user acceptance of technology using social networks. Jounral of High Technology Management Research, 20, 1 – 18.
Publisher – Google Scholar
27. Lopez, Carolina Nicolas, Molina, Castillo Francisco, Harry, Bouwman. (2008). An assessment of advanced mobile services acceptance: contributions from TAM and diffusion theory models. Information & Management, 45, 359 – 364.
Publisher – Google Scholar
28. Lung, Hsu Chin, and Peng, Lu Hsi. (2007). Consumer behavior in online game communities: A motivational factor perspective. Computers in Human Behavior. 23, 1642 – 1659.
Publisher – Google Scholar
29. MacRumors. (2014). Apple continues to lose smartphone share, gain mobile phone share in 4Q 3014. Jan. 28, 2014.
30. Mallat, N., Rossi, M., Tuunainen, K., & Öörni, A. (2009). The impact of use context on mobile services acceptance: The case of mobile ticketing. Information & Management, 46, 190—195. doi:10.1016/j.im.2008.11.008.
Publisher – Google Scholar
31. McAdams, D. P. and Bryant, F. B. (1987). Intimacy motivation and subjective mental health in a nationwide sample. Journal of Personality, Vol. 3, Iss. 55, 395 — 413.
Publisher – Google Scholar
32. O’brien, Kevin J. (2009). Turning the Masses onto Mobile Broadband. The New York Times, June 15, 2009.
33. Reis, H. T. and Patrick, B. C (1996). Attachment and intimacy: Component processes, Social Psychology: Handbook of Basic Principles, Higgins, E. T. and A. W., Kruglanski (eds), New York: Guilford Press, 523 — 563.
Google Scholar
34. Ritchel, Matt. (2009). U.S. Pulls Ahead in Mobile Data Revenue. The New York Times, May 11, 2009.
35. Rogers, E. M. (1983). Diffusion of Innovations. Free Press, NY.
36. Rouibah, K. (2008). Social usage of instant messaging by individuals outside the workplace in Kuwait: A structural equation model. IT & People, 21 (1), 34 – 68.
Publisher – Google Scholar
37. Rouibah, K, and Abbas, H. (2010). Effect of personal innovativeness, attachment motivation, and social norms on the acceptance of camera mobile phones: An empirical study in an Arab country. International Journal of Handheld Computing Research (IJHCR), 1 (4), 41 – 62. October-December, 2010.
38. Rouibah, Kamel, Abbas, Hasan, and Rouibah, Samia. (2011). Factors affecting camera mobile phone adoption before e-shopping in the Arab world. Technology in Society, 33, 271 – 283.
Publisher – Google Scholar
39. Russel, Jon. (2011). Smart phones account for just 27% of all mobile phones. Vision Mobile, http://thenextweb.com/mobile/2011/11/29/ report-smartphones-account-for-just-27-of-all-mobile-phones-worldwide/
40. Sarbaugh-Thompson, M. and Feldman, M. (1998). Electronic mail and organizational communication: Does saying Hi really matter? Organization Science, 9 (6), 685 – 698.
Publisher – Google Scholar
41. Shepers, J., and Wetzels, M. (2007). A meta-analysis of the technology acceptance model: Investigating subjetive norm and moderation effects. Information & Management, 44, 90 – 103.
Publisher – Google Scholar
42. Shin, Dong-Hee. (2007). User acceptance of mobile Internet: Implication for convergence technologies. Interacting with Computers, 19(4), 472 – 483. July, 2007.
Publisher – Google Scholar
43. Shin, Dong-Hee, Shin, Youn-Joo, Choo, Hyunseung, and, Beom, Khisu. (2011). Smartphones as smart pedagogical tools: Implications for smartphones as u-learning devices. Computers in Human Behavior, 27 (6), 2207 – 2214. November, 2011.
Publisher – Google Scholar
44. Shyu, Stacy Huey-Pyng, and Huang, Jen-Hung. (2011). Elucidating usage of e-government learning: A perspective of the extended technology acceptance model. Government Information Quarterly, 28, 491 – 502.
Publisher – Google Scholar
45. Statista. (2014). The Statistics Portal.
http://www.statista.com/statistics/277640/number-of-mobile-connections-worldwide-since-2007/. (March, 2014).
46. Taylor, Ken, Abdullah, Umran A., Helmer, Richard J. N., Lee, Jungoo, and Blanchonette, Ian. (2011). Activity classification with smart phones for sports activities. Procedia Engineering, 13, 428 – 433.
Publisher – Google Scholar
47. Venkatesh, V. and Davis, F. D. (1996). A model of the antecedents of perceived ease of use: Development and test. Decision Sciences, 27 (3), 451 – 481.
Publisher – Google Scholar
48. Venkatesh, V. and Davis, F. D. (2000). A theoretical extension of the technology acceptance model: Four longitudinal field. Management Science, 46, 186 – 204.
49. Venkatesh, V. Morris, M. G., and Ackerman, P. L. (2000). A longitudinal field study of gender differences in individual technology adoption decision making processes. Organization Behavior Human Decision Processes, 83, 33 – 60.
50. Venkatesh, V., and Ramesh. (2003). Understanding usability in mobile commerce. Communications of the ACM, 46 (12), 53 – 56.
Publisher – Google Scholar
51. Venkatesh, V., Morris, D., and Davis, F. (2003b). User acceptance of information technology: Toward a unified view. MIS Quarterly, 27, 425 – 478.
Google Scholar
52. Versace, Christoper. (2014). It had to happen! Smartphone shipments dip in 1Q 2013. Forbes, 21/01/2013.
53. Yi, M. Y., Jackson, J. D., Park, J. S., and Probst, J. C. (2006). Understanding information technology acceptance by individual professionals: Towards and integrative view. Information & Management, 43, 350 – 363.
Publisher – Google Scholar
54. Zhao, Ling, Lu, Yaobin, Zhang, Long, and Chau, Patrick Y. K. (2012). Assessing the effects of service quality and justice on customer satisfaction and the continuance intention of mobile value-added services: An empirical test of a multidimensional model. Decision Support Systems, (article in press). 1 – 12. 2012.
Publisher – Google Scholar
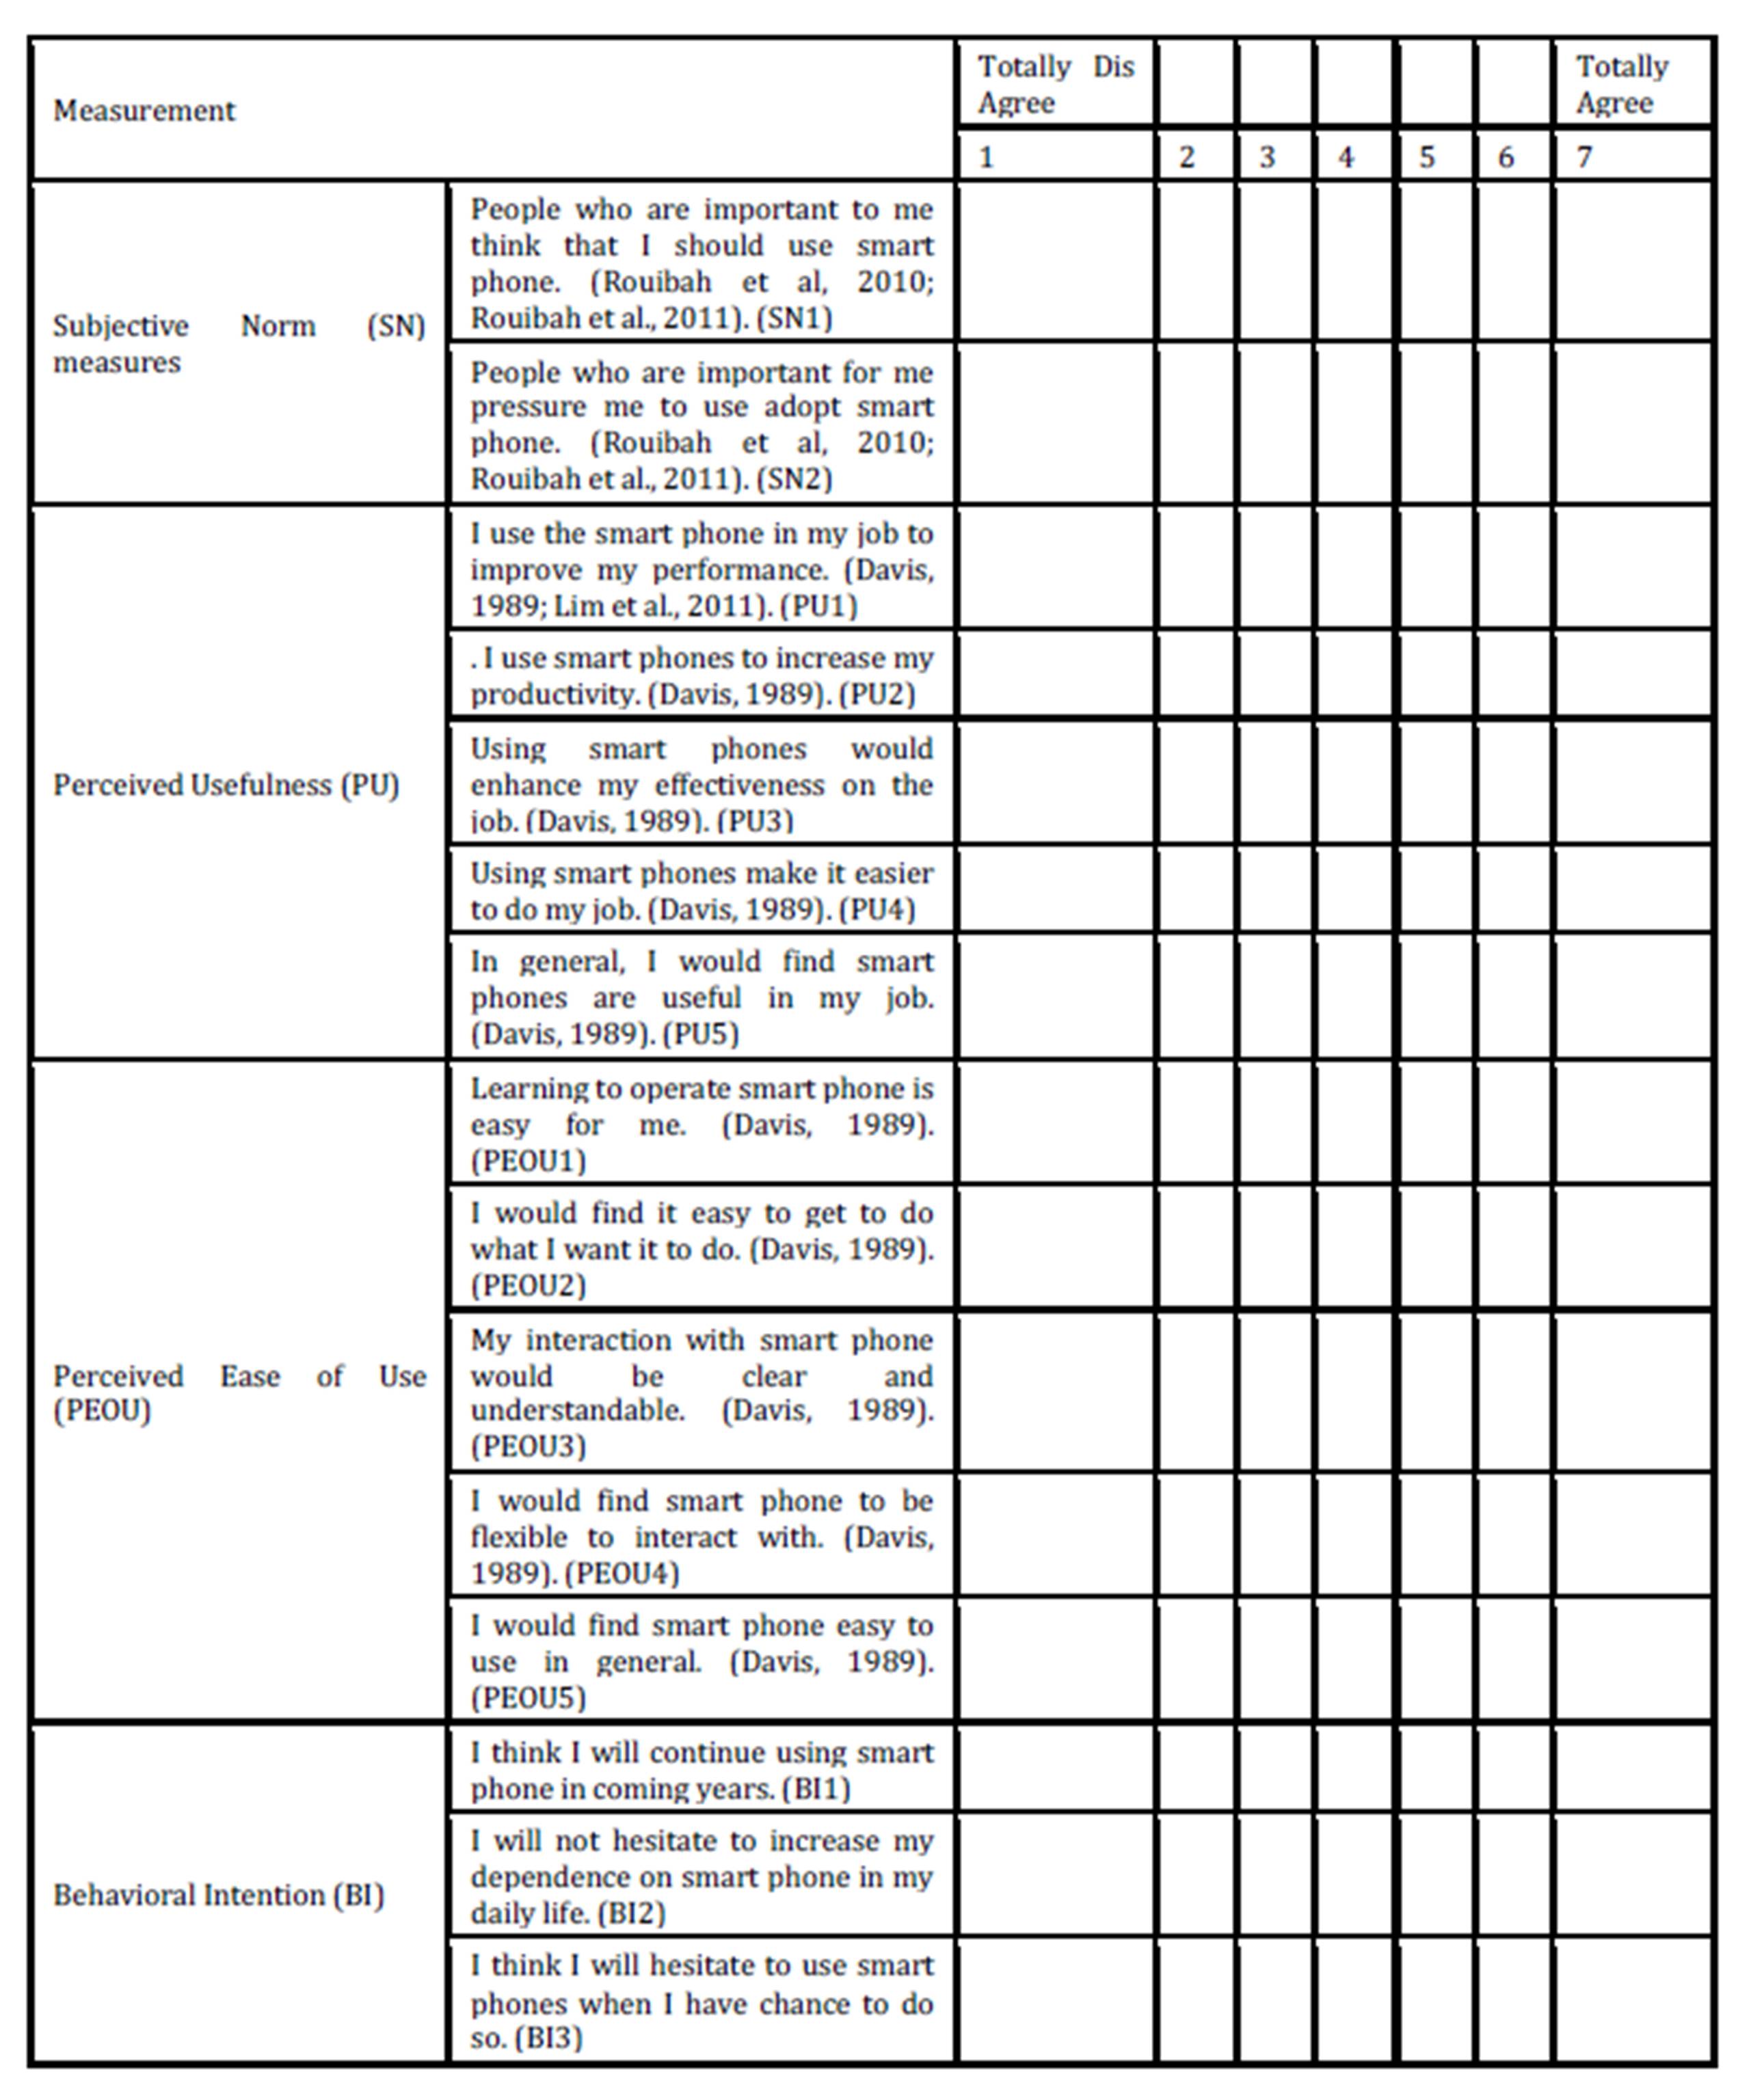
Appendix 1: Questionnaire