Introduction
The research comes within the studies on innovation, with a particular focus on inventive activities at the technological domain level. The aim of the paper is to investigate the innovation strategies adopted by bio-pharmaceutical companies, and relate them to context features, open innovation (OI) adoption and financial performances.
The technology of a firm is the result of its accumulated experience in design, production and problem solving. Companies’ existing body of knowledge is history dependent and affects their future technological development (Hung and Tang, 2008), allowing to recombine and integrate capabilities belonging to different knowledge domains. Actually, firms in industries featured by higher R&D intensity operate using a wide range of knowledge fields and vary in their technological diversity (Suzuki and Kodama, 2004); therefore, they carry out different innovation behaviors that lead to different innovation performances. This process is not static, with companies expanding their stock of knowledge over time (Miller, 2004). The dynamic evolution of capabilities is affected by the two different technological strategies pursued by firms, i.e. exploitation and exploration (March, 2006). The former refers to the creation of new capabilities through refinement, upscaling and standardization, improving existing product-market domains (He and Wong, 2004) and leading to short-term effects (Belderbos et al., 2010). The latter aims at producing a novel body of knowledge, with companies involved in experimental activities by identifying distant knowledge fields from outside their boundaries and transferring them inside (Miller et al., 2007) in order to achieve a long-term growth. Firms benefit from a balanced mix of such strategies, since their combination improves survival chances and financial performances (O’Reilly and Tushman, 2004).
When companies are unable to recombine and integrate their capabilities, they open up their R&D processes (Chesbrough, 2003). The OI paradigm is conceived on the idea that when the boundaries of the innovation funnel become permeable, firms are able to exploit and explore technologies by sharing their innovative processes with third parties, integrating into their business model various OI practices, such as collaboration, outsourcing, licensing, trading and incorporation (Michelino et al., 2015a). For instance, explorative strategies may be pursued both through R&D collaborations with partners possessing different capabilities (Dittrich and Duysters, 2007) and by incorporating knowledge from acquired firms (Ahuja and Katila, 2001).
The paper aims at:
- typifying innovation strategies of companies through the use of patent data;
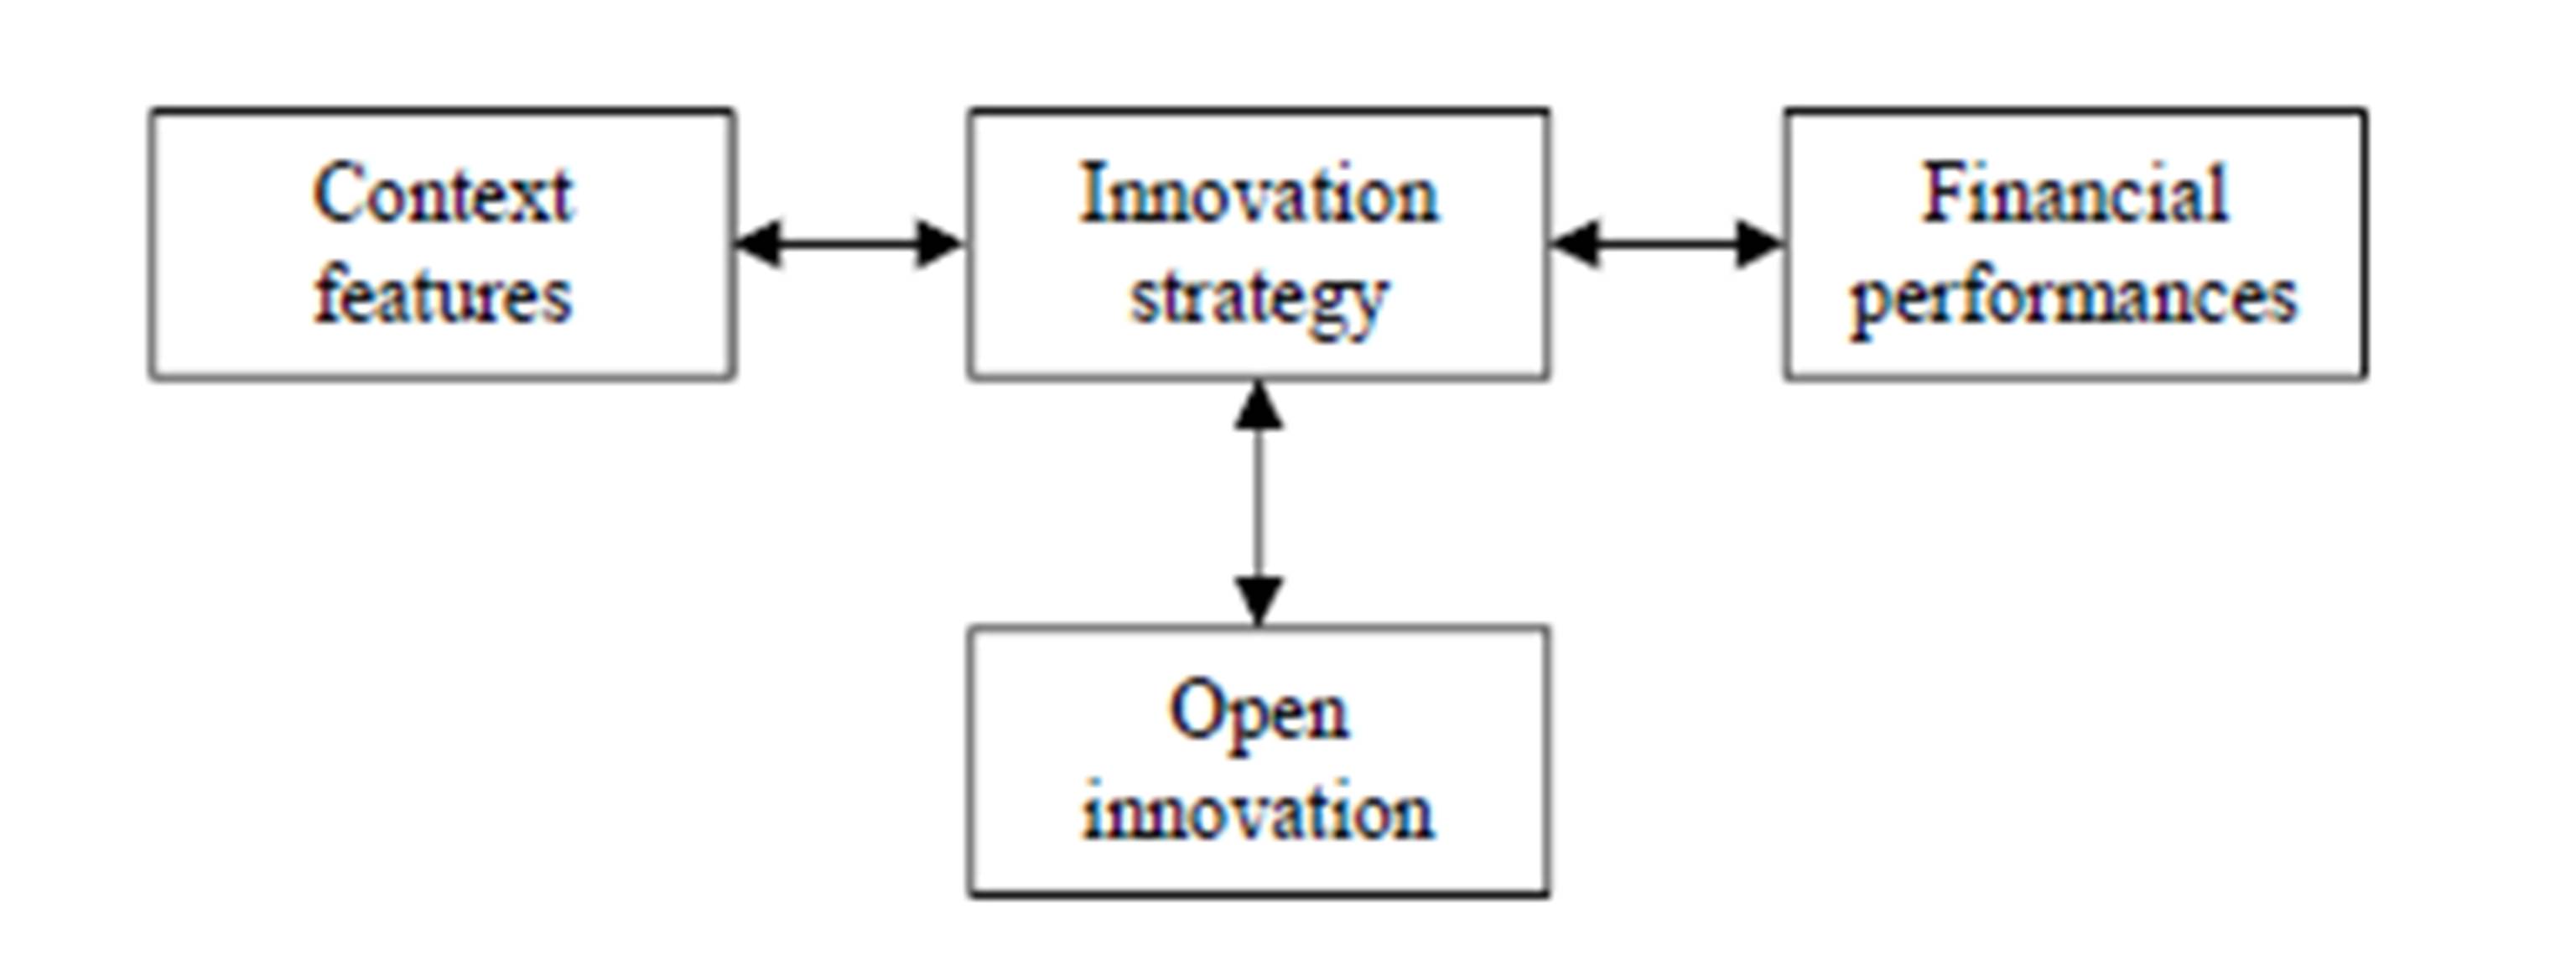
- relating innovation strategies to context features, OI adoption and financial performances (Figure 1).
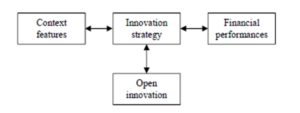
Figure 1: Innovation strategy: relationships with context features, OI and financial performances
The work is based on the analysis of a sample of 102 bio-pharmaceutical companies ranked by their investment in R&D, according to The EU Industrial R&D Investment Scoreboard.
In what follows, the theoretical and methodological framework for the characterization of innovation strategies and OI adoption is described. Afterwards, the results from the application to the bio-pharmaceutical companies are presented and discussed. Conclusions close the work.
Framework
Innovation strategy
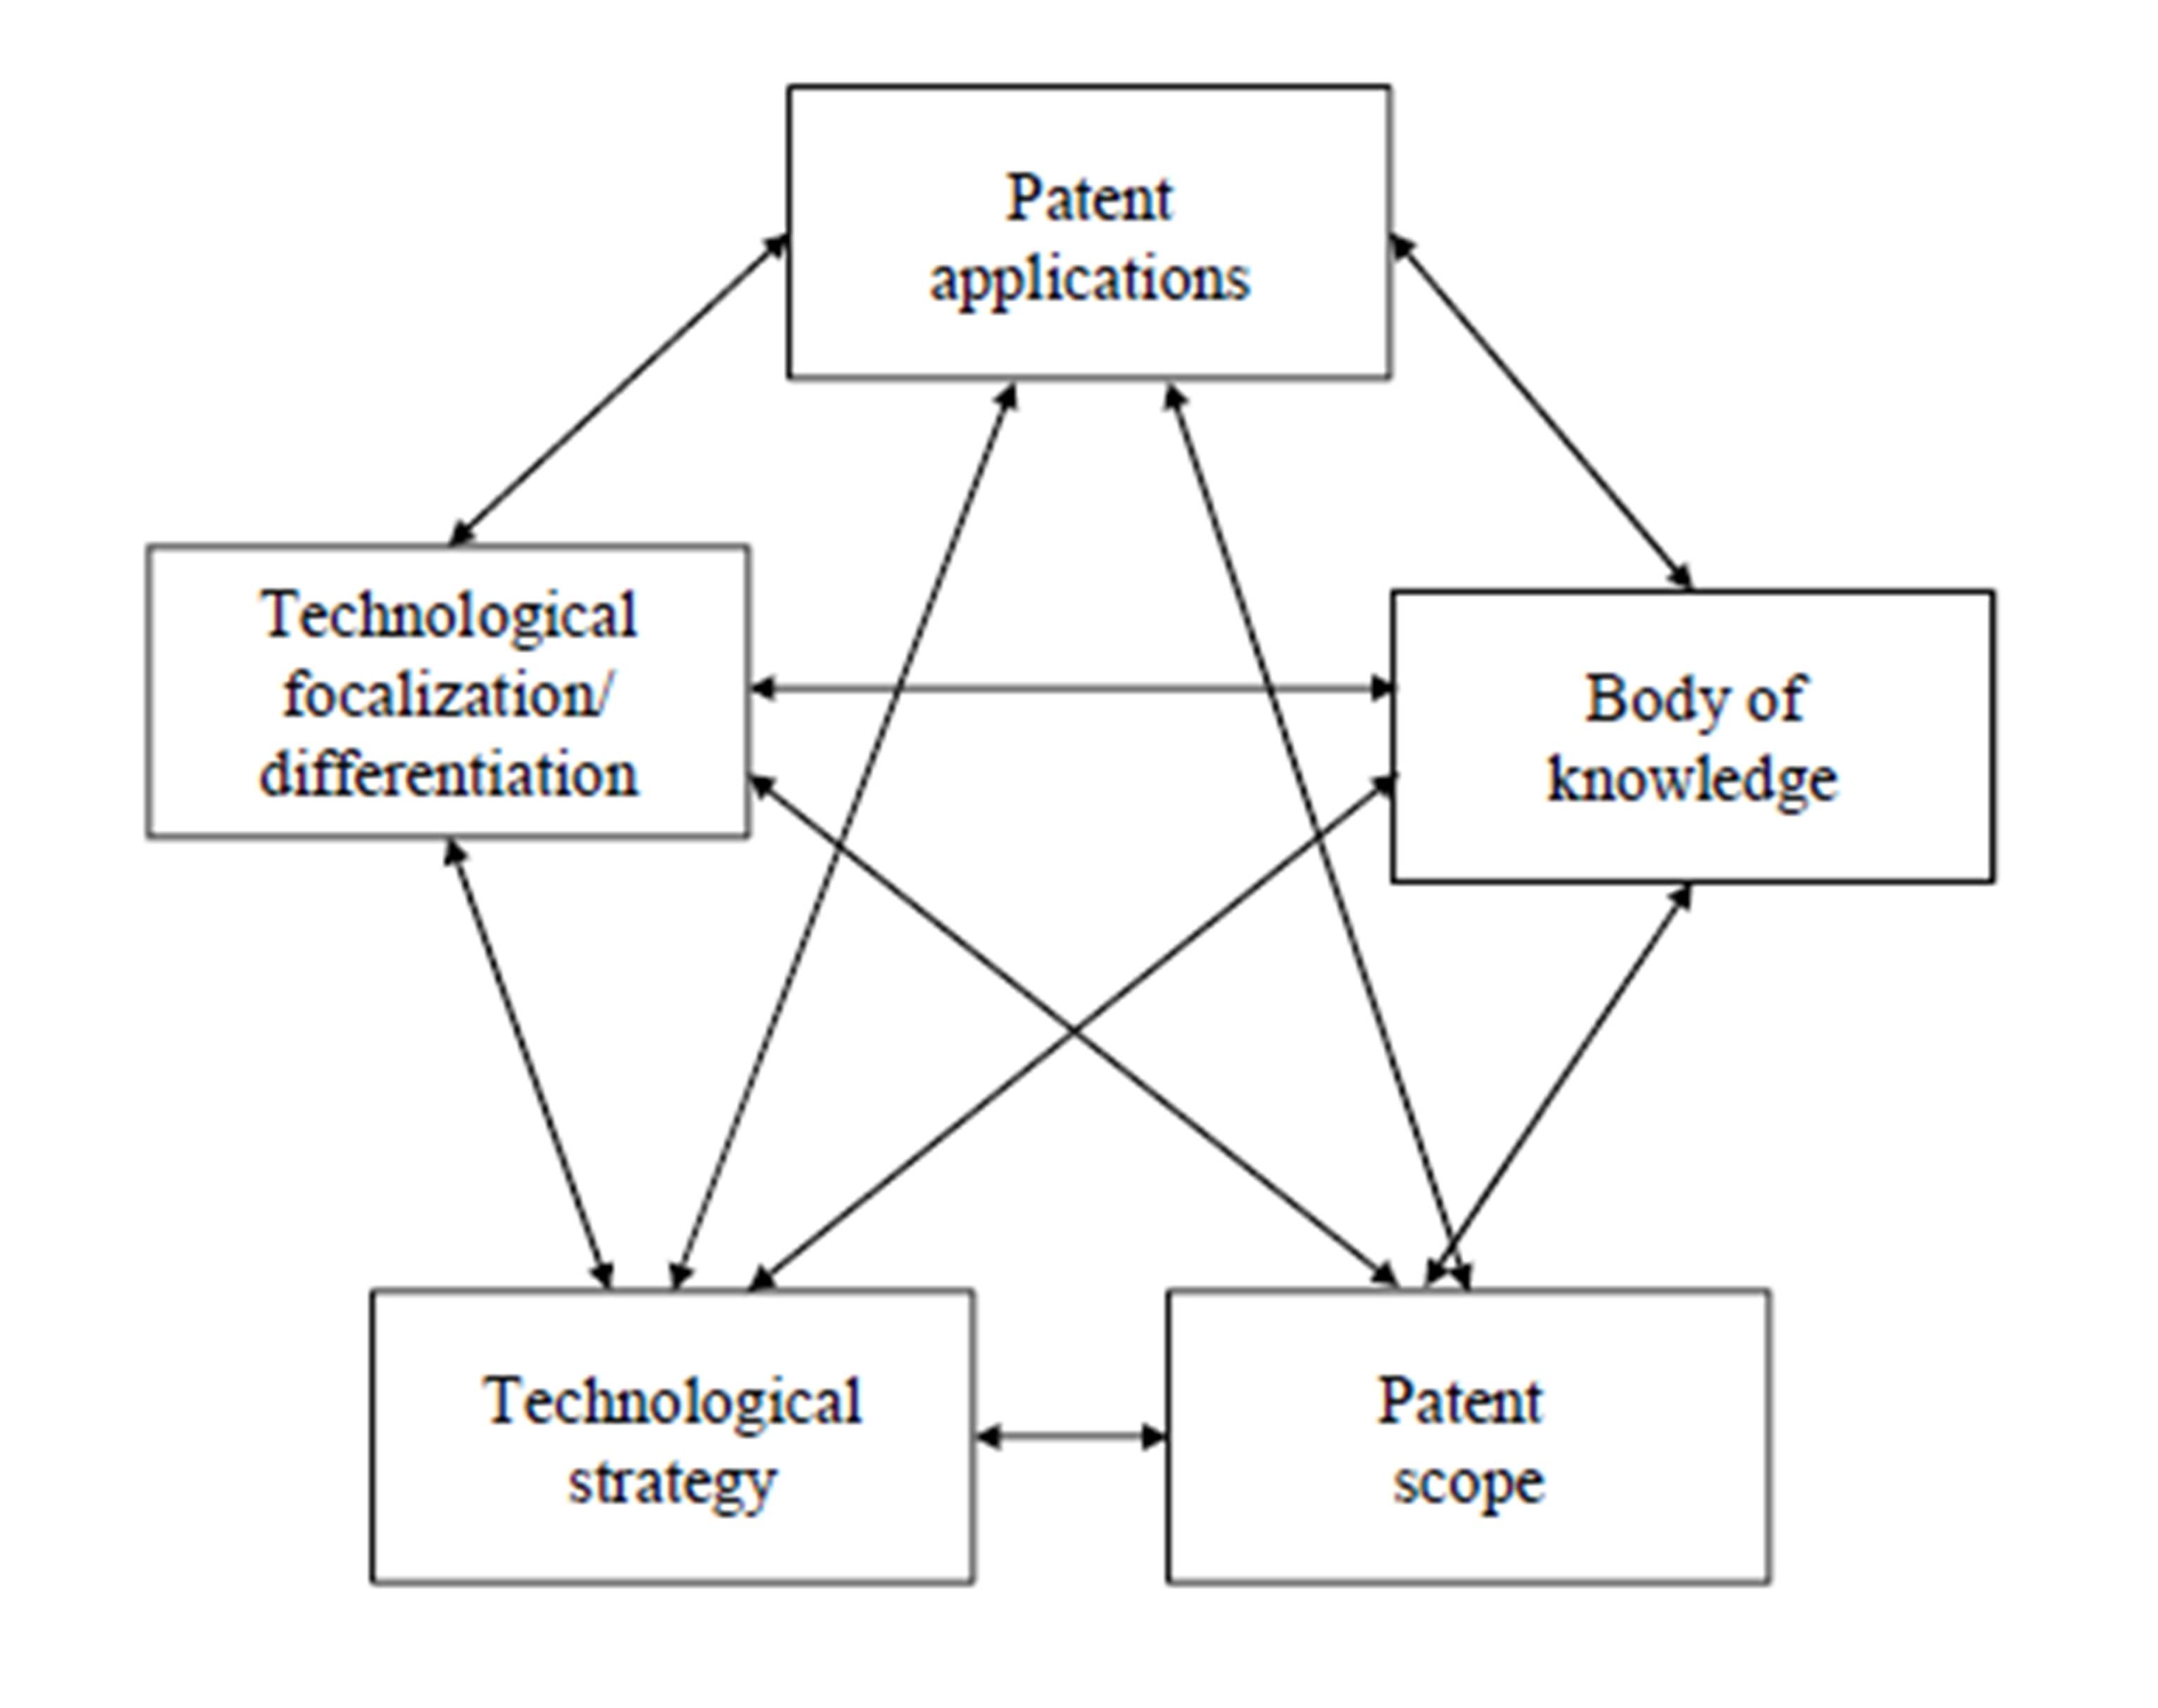
Innovation strategies are defined through the use of patent data as the combination of five elements: patent applications (PA), body of knowledge (BK), patent scope (PS), technological strategy (TS) and technological focalization/differentiation (TF/D) (Figure 2).
Patent applications is the number of patents filed by companies during the analyzed year, which provides information on their technological leadership, being the concrete manifestation of R&D efforts carried out in previous years. Actually, patent counts are commonly employed by scholars to identify firms’ potential innovativeness (Mazzucato and Tancioni, 2012).
Body of knowledge is the number of knowledge domains in which companies have patented in the year under investigation. In literature, knowledge domains are defined through International Patent Classification (IPC) codes disclosed in patent documents, which identify the belonging technological fields of an innovation (Graff, 2003; Sakata et al., 2009). Yet, we defined them through the analysis of Cooperative Patent Classification (CPC) codes: the CPC system was preferred to the IPC one since it allows to analyze patent applications with both the EPO and the USPTO as receiving office. Each CPC consists of a hierarchical symbol and we decided to cut the code at the second-last level of disaggregation in order to obtain the desired degree of generalization. Actually, the complete code identifies a specific component, but different components may be developed within the same knowledge domain, since the competencies required can be the same.
Patent scope is defined – consistently with Lerner (1994) – as the average number of CPC codes disclosed in patents filed in the analyzed year. It explains the interdisciplinarity of firm’s innovative activities: the higher the patent scope, the wider the number of technical fields affected by the invention.
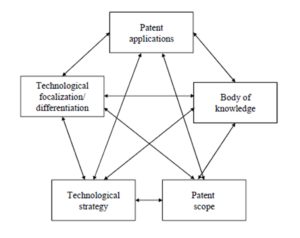
Figure 2: Innovation strategy: building blocks
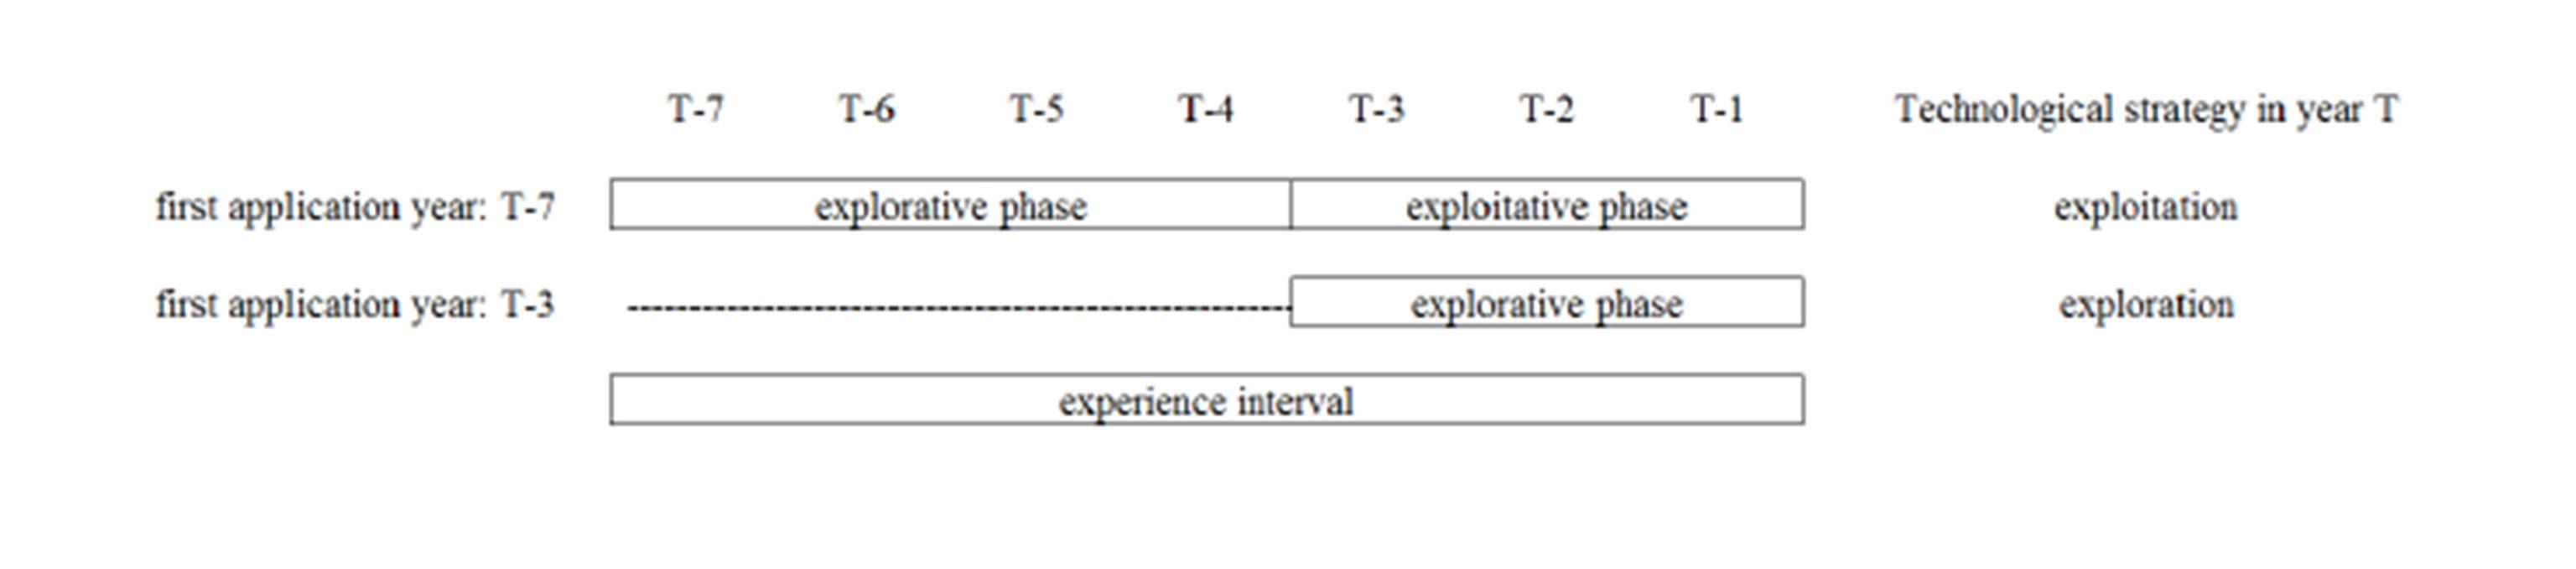
Technological strategies adopted by companies are described in terms of exploitation vs. exploration, the former based on the use of knowledge already belonging to the firm, the latter on the development of new knowledge. Gupta et al., (2006) suggested that, within a single knowledge domain, exploration and exploitation are mutually exclusive, whilst across different areas they are orthogonal; hence, high levels of exploitation (exploration) in a specific field may coexist with high levels of exploration (exploitation) in other ones. By analyzing technological strategies at the knowledge domain level, we evaluate for each technological field which strategy has been adopted. The linkage between exploration vs. exploitation strategies and knowledge domains was investigated by Belderbos et al., (2010), which defined innovation activities as explorative if they develop ideas situated in knowledge fields where the firm has not patented in the past five years, whereas exploitative ones refer to technologies developed in technological domains where the firm has patented in the previous five years. The five-year time span derives from the assumption that knowledge evolves rapidly and companies lose most of their technical experience if they abandon a knowledge domain for five years (Argote, 1999; Ahuja and Lampert, 2001; Fleming, 2001; Hall et al., 2005; Leten et al., 2007), with competencies previously accumulated resulting obsolete and forcing them to re-explore such technological field. Furthermore, when firms start to explore a new knowledge area, it remains relatively new until they accumulate experience in the search activity within it: such process requires time and resources; therefore a technological field keeps its explorative status for a period of three consecutive years (Belderbos et al., 2010). Yet, such time spans can be regarded as mean values applicable to all industries, while the bio-pharmaceutical one is featured by specific market, product and industrial structures. Actually, in this sector the development of a new drug can take more than five years: the lack of patent applications in a specific technological field in the previous five years does not necessarily imply the loss of knowledge, since an invention may be in the development phase. Hence, the experience interval should take into account the higher development time and, thus, we considered a seven-year time span. Regarding the exploration phase, the industry is featured by innovation processes deriving from basic search: the integral nature of the products forces companies to spend more time to make a technological area exploitable, thus we considered a four-year time span for the exploration period. Therefore, in year T, a CPC is labeled as exploitative only if the company has already patented innovation between T-5 and T-7, since it has certainly trespassed the explorative phase which requires four years (Figure 3).

Figure 3: Knowledge domains labeling
Technological focalization/differentiation is defined by distinguishing between inventions in core knowledge domains and those in non-core ones. High technological focalization implies that companies are focused on few core knowledge domains, whereas a low focalization is typical of firms having a wider range of non-core technological fields, i.e. carrying out a differentiation strategy. In particular, each CPC is defined as core if it is declared in at least 10% of the patents filed in the experience interval (seven years), non-core otherwise. The threshold of 10% is based on robustness tests. Indeed, by setting up the threshold to 15% for many companies no core knowledge domains were found, while by reducing it to 5% the majority of technological fields is labeled as core, preventing a good operationalization of the variable. The idea is built on the assumption that a technological field is core if its accumulation of knowledge in the experience interval generates a larger number of patent applications (Michelino et al., 2014).
Open innovation
OI is typified by two different dimensions: inbound and outbound (Chesbrough and Crowther, 2006). Yet, the most acknowledged measures for OI in literature – by defining the breadth and depth of external sources of knowledge (Laursen and Salter, 2006) – are only focused on its inbound dimension. Further, even if the adoption of OI practices is largely investigated (van de Vrande et al., 2009; Schroll and Mild, 2011), no focus is given to how such practices affect the business of companies in terms of costs, revenues and assets.
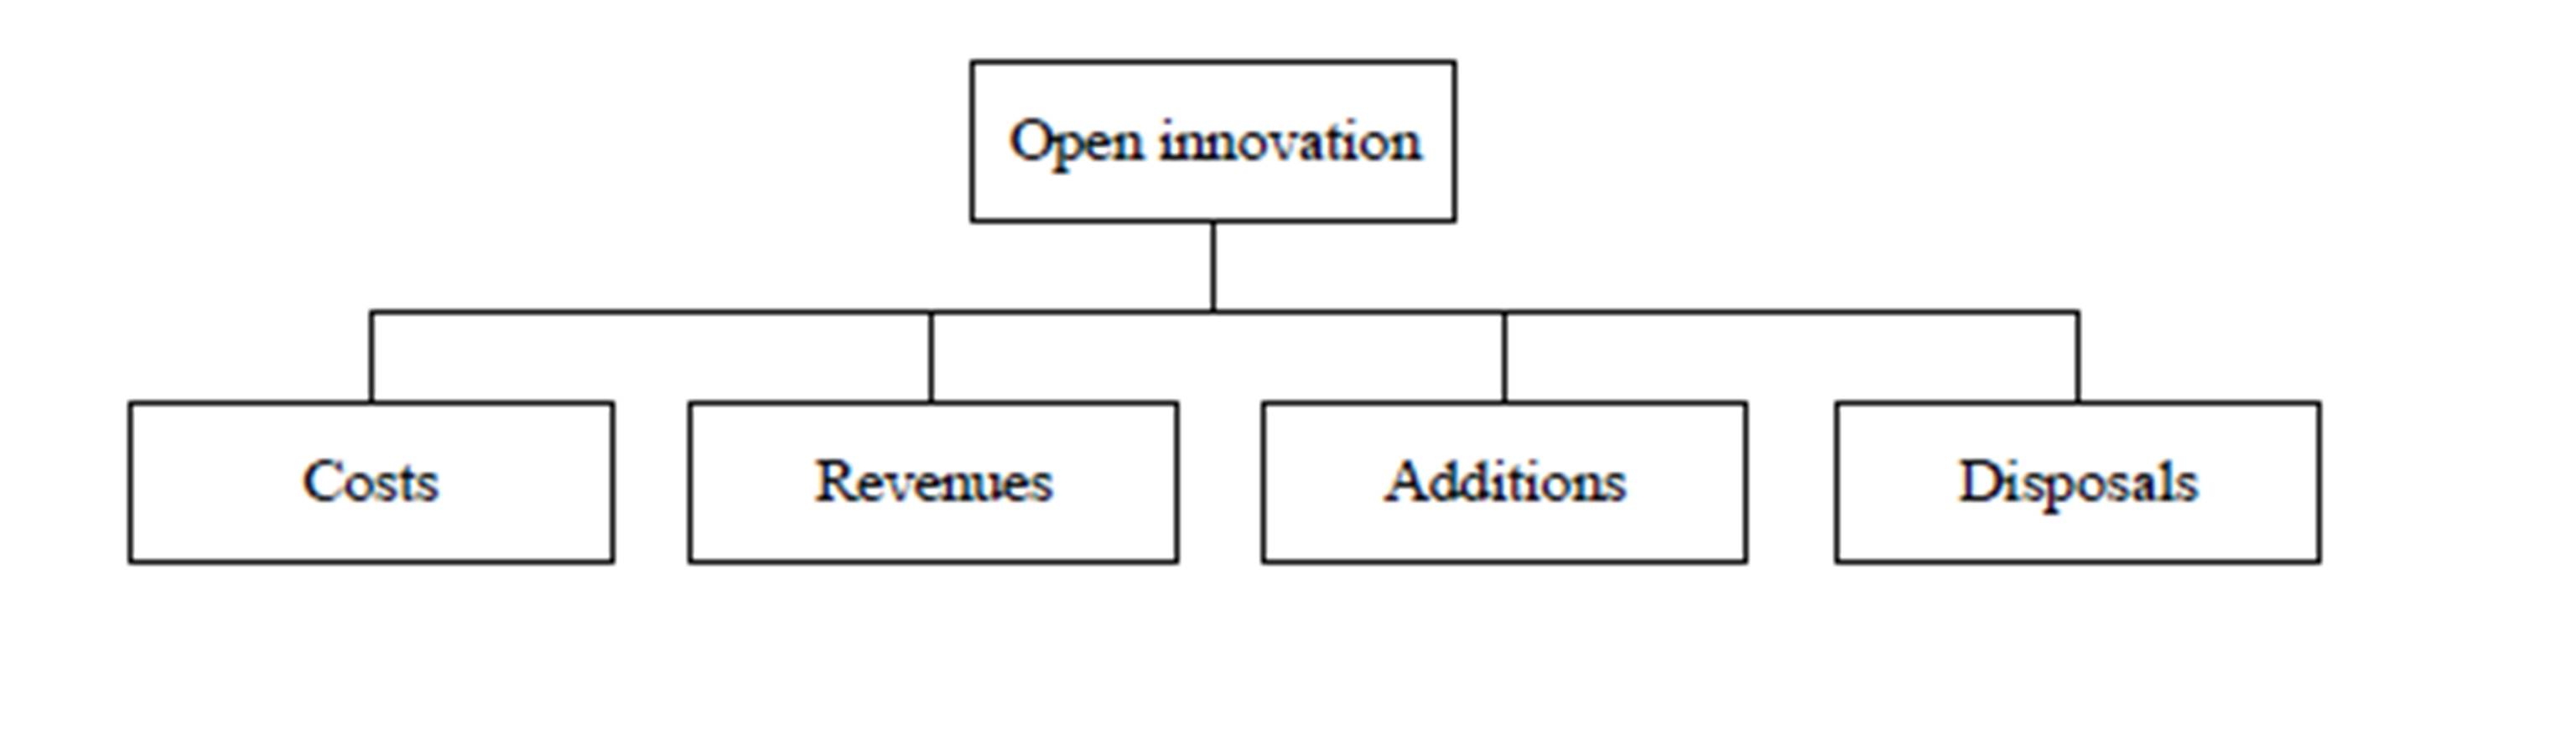
Thus, we adopted an accounting approach to the measurement of the openness degree of companies, analyzing all the OI transactions detected in the annual reports (Michelino et al., 2015b). By investigating positive and negative items in both income statement and balance sheet, we add to the inbound vs. outbound perspective a further distinction between operational and financial transactions, so that four dimensions of OI can be identified (Figure 4):
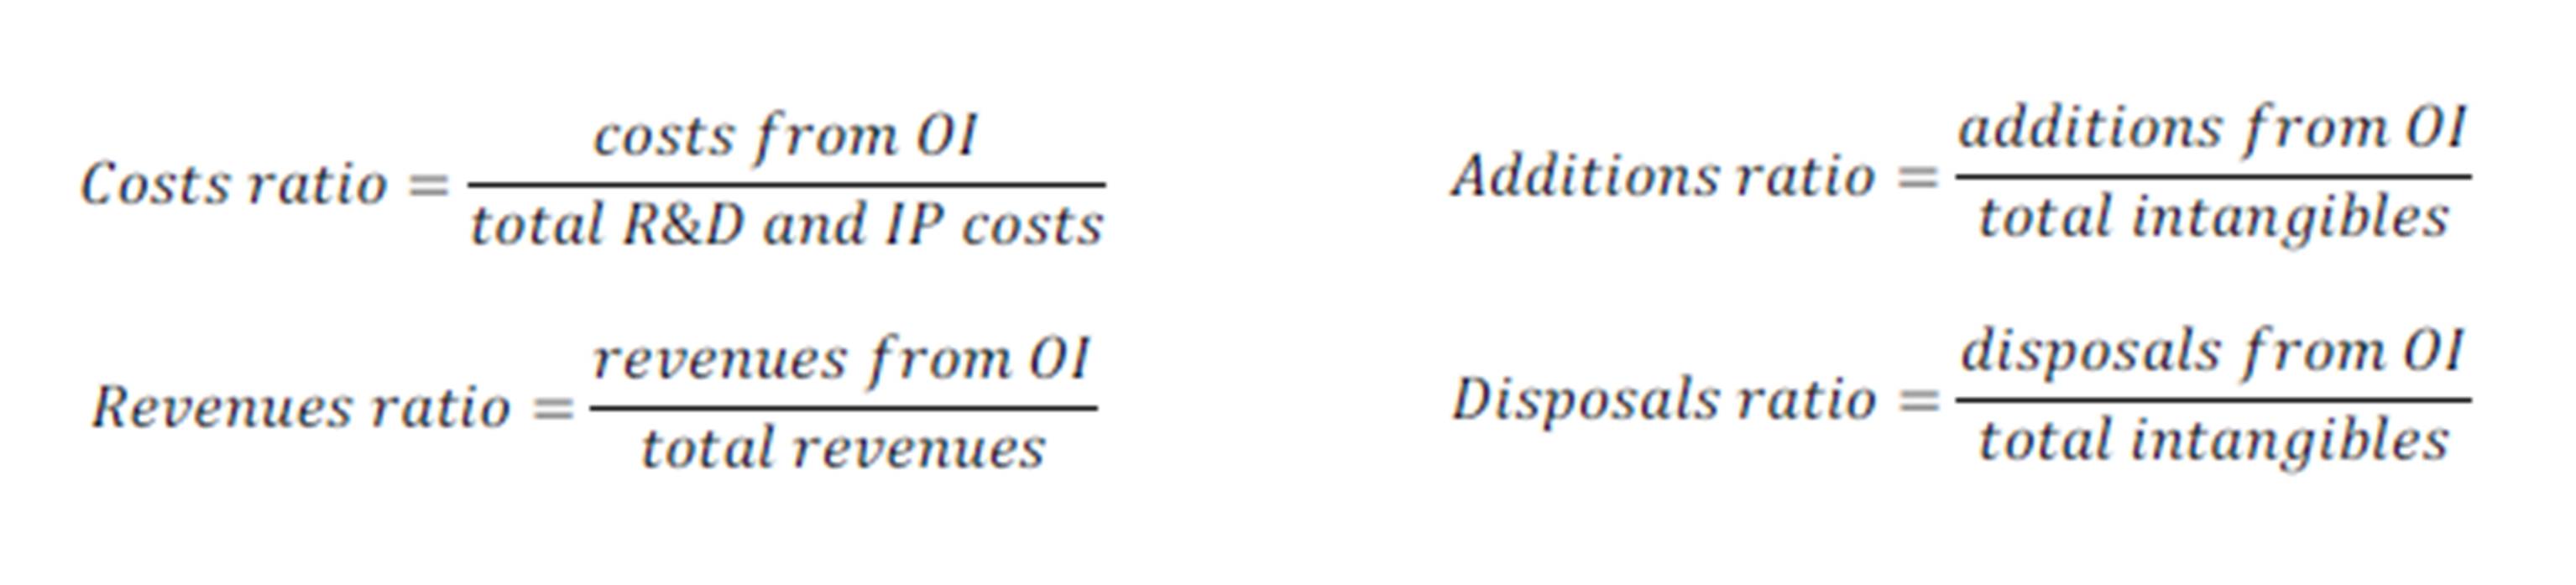
- costs, i.e. operational inbound transactions;
- revenues, i.e. operational outbound transactions;
- additions, i.e. financial inbound transactions;
- disposals, i.e. financial outbound transactions.
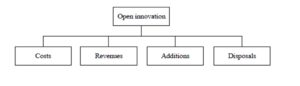
Figure 4: OI definition: an accounting perspective
Actually, the analysis of costs and revenues is mirror-like, since every OI activity typically generates costs for a company and revenues for another one. Thus, the operational transactions of OI enclose costs and revenues deriving from: collaborative development, outsourcing of R&D services or development of R&D services on behalf of third parties, in- and out-licensing activities.
In the same way, as to the financial transactions, the analysis of new investments and divestments of intangibles is mirror-like, because when an intangible is sold by a company another one is acquiring it, so that we have to include additions and disposals of all the intangibles linked to innovation: development costs, licenses, patents, intellectual property (IP) rights, product rights, technology and goodwill related to research spin-ins and spin-offs.
Hence, OI is a four-dimensional phenomenon, featured by costs, additions, revenues and disposals. In order to quantify the degree and define the nature of OI, four basic indicators can be calculated by comparing, for each of the four components, the items deriving from OI to the total items of the firm:
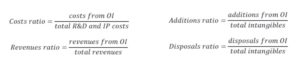
Therefore, OI can be represented in the space R4, where each of the basic ratios is a Cartesian coordinate and each company can be represented as a point, whose distance from the origin is proportional to its total degree of openness:

All the ratios range from zero to one respectively corresponds to a totally closed and a totally open behavior.
Context features and financial performances
Context features of companies are assessed in terms of:
- firm size, measured in number of employees;
- firm age, evaluated in number of years from the date of establishment;
- R&D intensity, calculated as R&D costs on revenues;
- R&D focalization, defined as R&D costs per employee.
Moreover, the following financial performances are taken into account:
- revenues per employee;
- EBIT per employee.
Findings
The research was performed on a sample of bio-pharmaceutical firms, given the high relevance OI has in such industry. The industry is, in fact, an early pioneer of OI (Cooke, 2005; Chesbrough and Crowther, 2006; Fetterhoff and Voelkel, 2006; Kleyn et al., 2007) because of the distributed nature of knowledge (Powell et al., 2005), and has a broad spectrum of OI models which have already become a standard in it (Gassmann et al., 2008).
We considered 102 worldwide top R&D spending bio-pharmaceutical companies, ranked by The EU Industrial R&D Investment Scoreboard, excluding firms whose 2011 annual reports were not available on the internet or not filling IFRS and US GAAP and those for which the list of subsidiaries was not found in such documents. For each firm in the sample we downloaded:
- the patents filed by both parent companies and their subsidiaries, from 2004 to 2011, from PATSTAT database;
- the 2011 consolidated annual reports from companies’ websites.
Patent data are employed for examining innovation strategies. Specifically, about 20,000 documents filed in 2011 are investigated for determining patent applications, body of knowledge and patent scope. We also downloaded about 200,000 patents from 2004 to 2010, used to characterize the distinct CPCs detected in 2011 documents, in terms of technological strategy and focalization: as matter of fact we have to consider 7 years of experience, 4 for exploration and 3 for exploitation. In order to evaluate such variables, we defined:
- the exploitation (exploration) share, as the share of exploitative (explorative) activities compared to the total amount of innovation activities detected in 2011;
- the core (non-core) share, as the share of CPCs labeled as core (non-core) compared to the total amount of CPCs declared in patents filed in 2011.
Given that patent applications of 2011 are analyzed, no expired patent is found.
As of consolidated annual reports, they disclose information about OI adoption, context features and financial performances.
According to the ICB codes disclosed in the Scoreboard[1], 48 biotechnology (BIO) and 54 pharmaceutical (PH) companies are included in the sample.
Innovation strategy
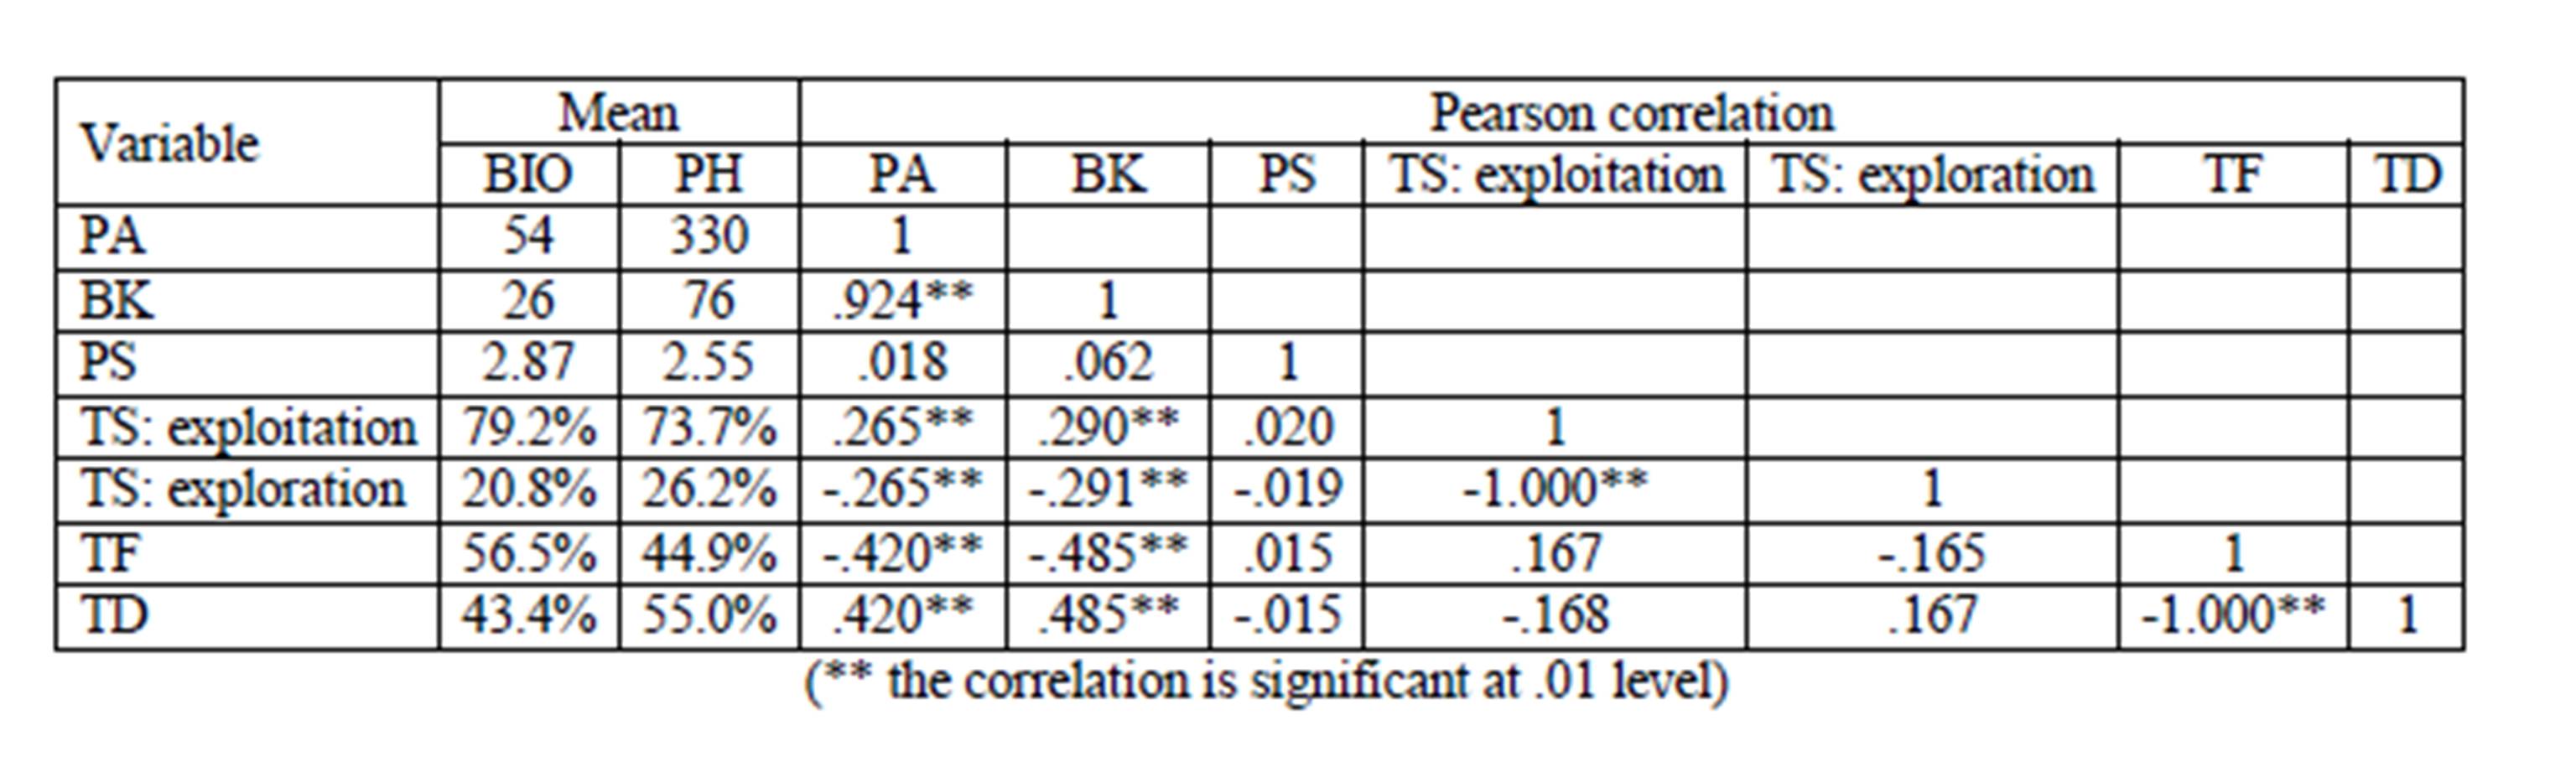
In Table 1, descriptive statistics and correlations are shown for all the variables defining innovation strategies of companies.
Table1: Innovation strategies
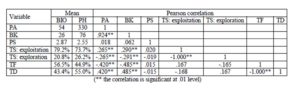
On average, pharmaceutical companies have more patent applications than biotech firms and their body of knowledge is larger. Companies in both segments largely prefer exploitation strategies to exploration ones. Biotech firms exhibit a higher technology focalization than pharmaceutical ones.
The number of patent applications is strongly correlated to the body of knowledge. Both variables are positively related to exploitation strategies and technological differentiation. No significant relationship is found between technological strategy and technological focalization.
Open innovation
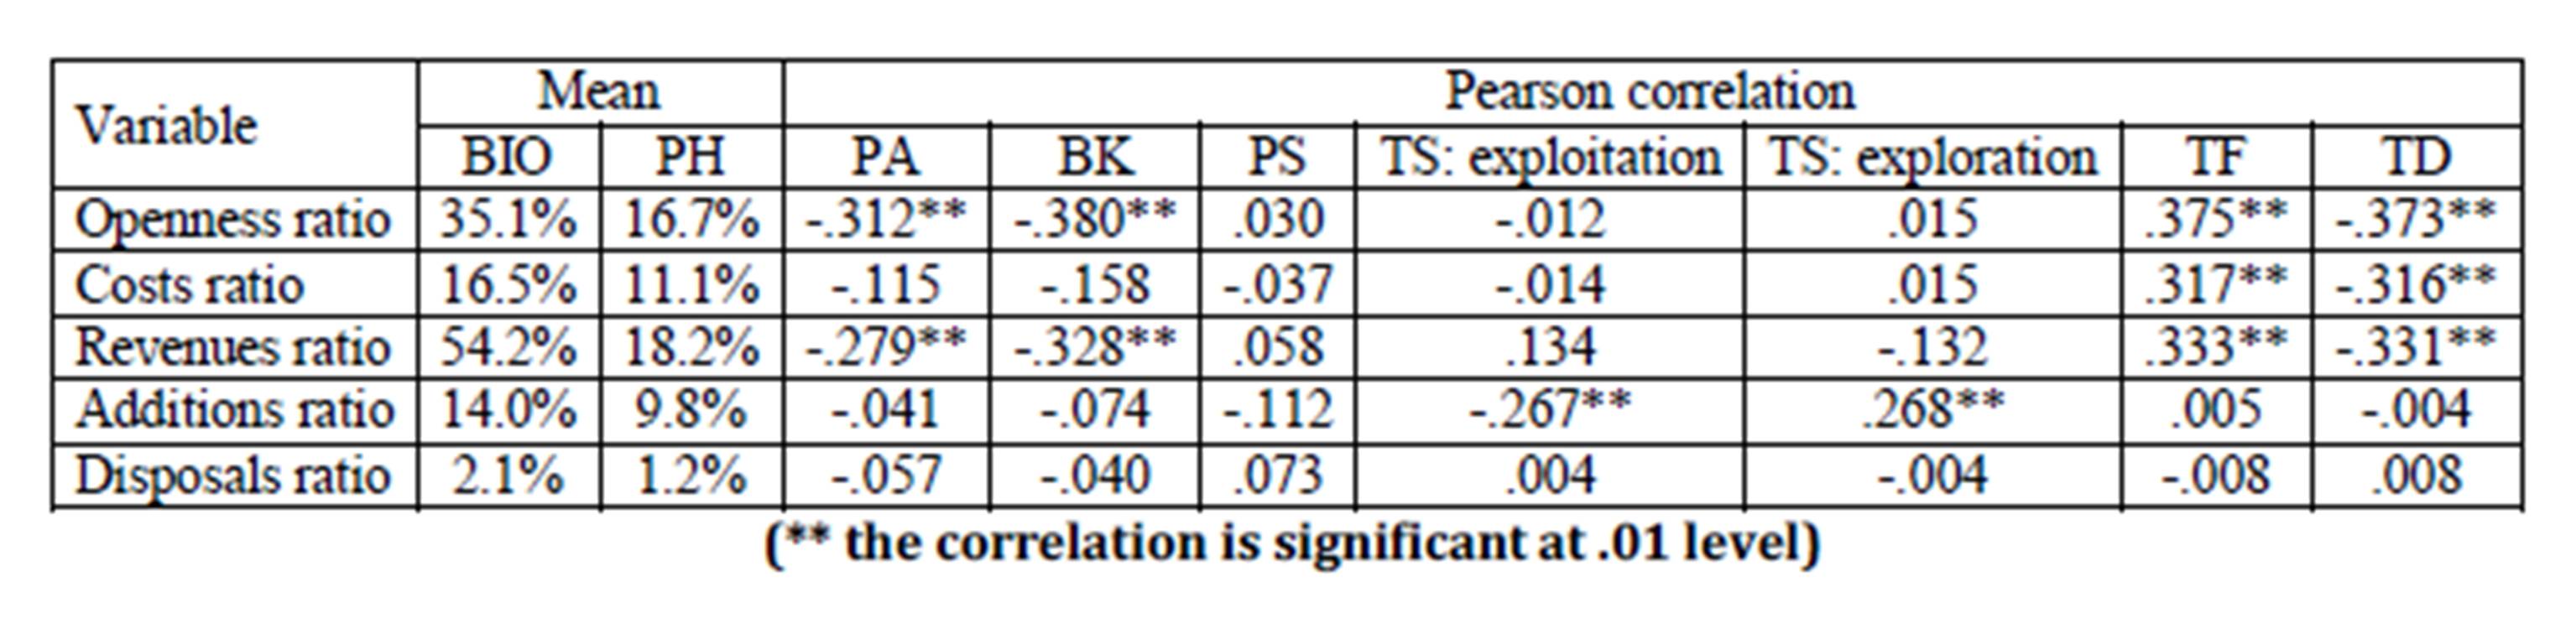
In Table 2, descriptive statistics for OI adoption and correlations with innovation strategies are reported.
Table 2: Innovation strategies and OI
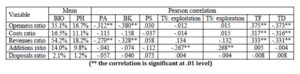
In mean, biotech companies are twice open than pharmaceutical ones, mainly due to the higher value of revenues ratio.
Both the number of patent applications and the body of knowledge breadth are negatively associated with OI adoption, in particular as to its operational outbound dimension. Exploration strategies are positively related to financial inbound practices, whereas technology focalization is linked to both inbound and outbound operational practices, resulting in a positive relationship with OI adoption as a whole.
Context features and financial performances
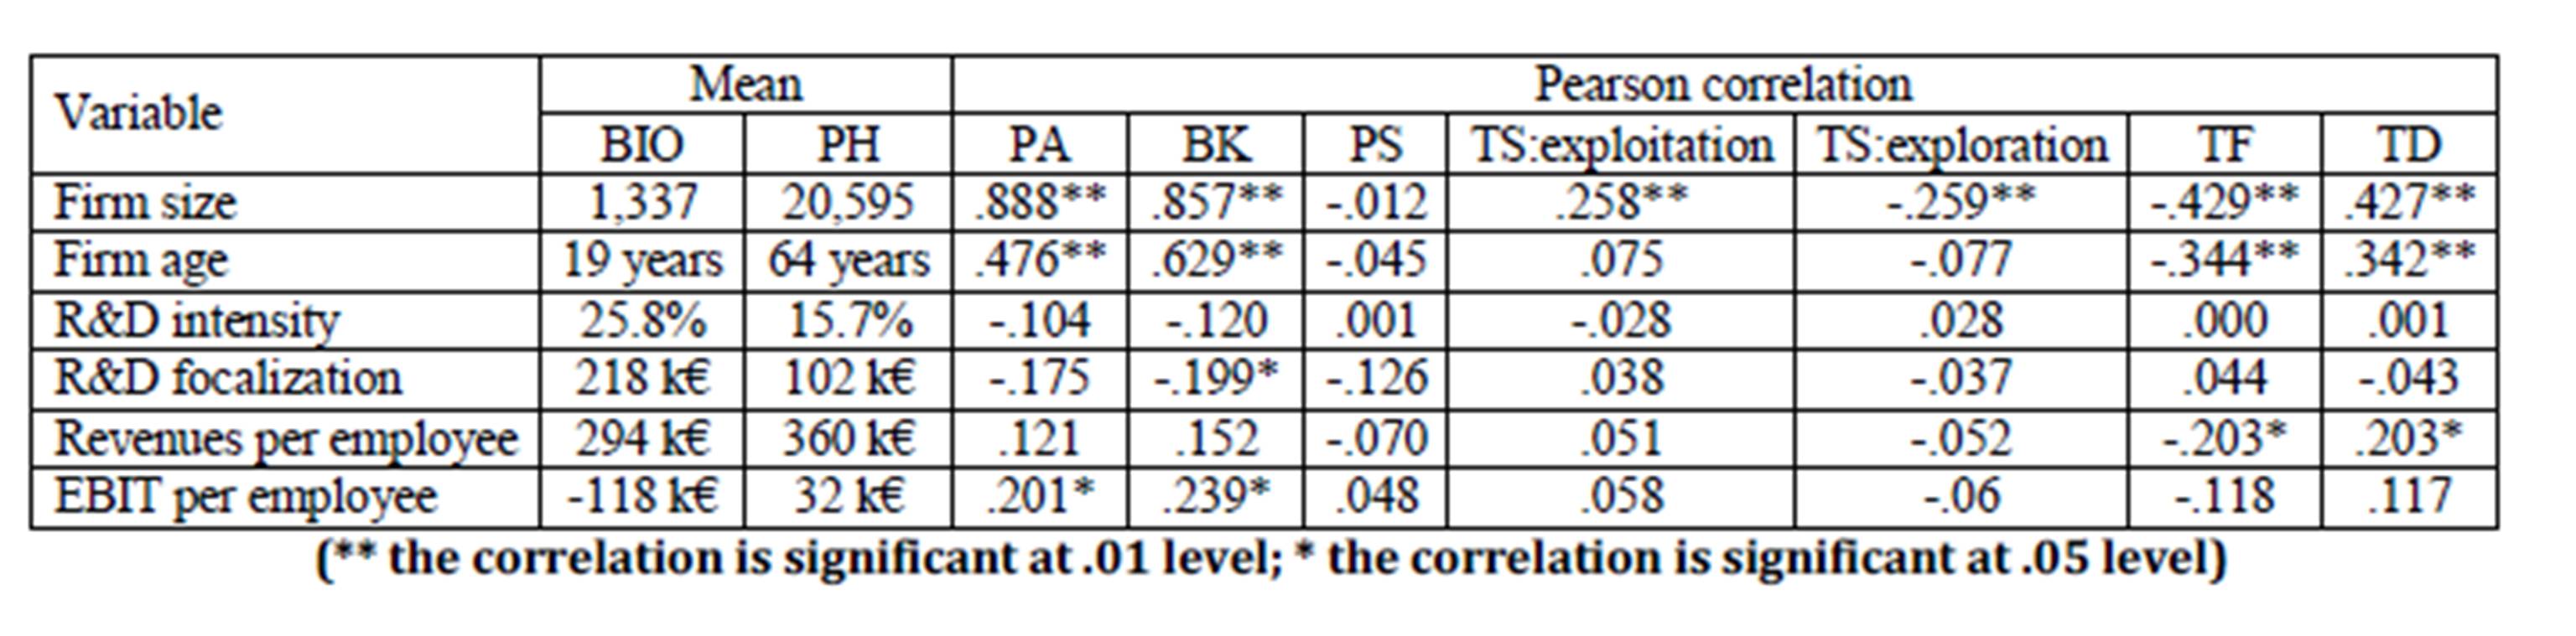
In Table 3, descriptive statistics for context features and financial performances and correlations with innovation strategies are presented.
Table 3: Innovation strategies, context features and financial performances
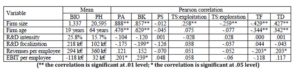
On average, pharmaceutical firms are larger and longer established than biotechnology ones; they also show lower R&D intensity and focalization and higher performances.
Both the number of patent applications and the body of knowledge breadth are positively correlated to firm size, age and EBIT per employee; further, the breadth of the body of knowledge is negatively correlated to R&D focalization. Exploitation strategies are positively related to firm size and technological differentiation is linked to firm size, age and revenues per employee.
Discussion
Results show that patent applications, body of knowledge and technological differentiation are positively correlated each other. Furthermore, they all exhibit a positive correlation with firm size, age and financial performances and a negative one with OI adoption, in particular as of outbound practices.
In Table 4, a summary of the findings uncovered for the two segments is shown.
Table 4: Synthesis of the results
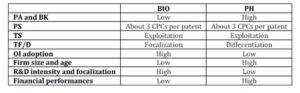
Biotechnology companies are typically young, with an average age of 19 years. If we consider that the development of a drug till its commercialization can take more than 10 years, this means that in most cases biotech firms are still in the development phase of their first product. Hence, such companies are highly focalized on R&D, with few or no manufacturing and commercial structures, also implying a relatively small dimension. Being still in a transient condition, they are either privately or publicly funded, with low financial performances. A large part of their revenues derives from OI activities linked to the provision of R&D services to other bio-pharmaceutical companies: development partners’ reimbursements, milestones achievements, cost or profit sharing agreements. Consequently, their innovation strategy is highly concentrated on few core technology fields, with a small number of patents applied for.
Conversely, longer established pharmaceutical companies typically work at full capacity, having already developed a product portfolio. Lower values of R&D focalization are due to the presence of large and complex organizational structures. The recourse to OI is not negligible, but it does not constitute the core business for them. Wide product portfolios are sustained by wide patent portfolios and wide ranges of knowledge fields, with low values of technological focalization.
A common feature in the industry is the higher recourse to the exploitation of technology fields already known for the firm rather than to the exploration of new ones. Such result is not surprising, since exploitation is a far less risky activity, which leads to short-term benefits. Yet, in order to sustain competitive advantage over time, the exploration strategy is not completely neglected, representing one fourth of the total innovation activities. A second commonality is discovered as to patent scope which exhibits no significant relations with all the other variables: an average value of almost 3 CPC codes per patent is found in both segments, defining a standard for the whole industry.
A final remark pertains to the positive relation between explorative strategies and the acquisition of intangibles. Particularly, from a detailed analysis of the different categories of intangibles (data not shown), exploration is correlated to the acquisition of patents. This means that the exploration of new knowledge domains is often performed through the acquisition of an already patented innovation rather than through the development of the patent in-house, thus reducing the risks of the process.
Conclusion
The paper contributes to the current debate on innovation in three ways. Firstly, it provides a multi-dimensional characterization of innovation strategies through the analysis of patent data: five dimensions – patent applications, body of knowledge, patent scope, technological strategies and technological focalization/differentiation – are defined and operationalized. Secondly, drawing on accounting data, OI adoption is evaluated on the basis of the impact that inbound and outbound transactions have on the business of companies. Thirdly, the relationships between innovation strategies, OI adoption, context features and financial performances are investigated and discussed.
The availability and objectivity of both patent documents and annual report data constitute strength of the work, since it can be used by managers to assess the status of the innovation strategies of companies and compare it over time and space, also allowing the benchmarking with competitors.
Some limits can be outlined. First, the use of patent data as a proxy of innovation has been widely debated in literature (Meyer, 2011), since not all patented inventions lead to an actually commercialized innovation and not all innovations are patented. Second, the use of patents filed in 2011 hinders the distinction between real and dormant ones, which can be done only by analyzing patents filed in more distant periods of time, in order to verify whether maintenance fees are paid or not. Finally, most of our results seem to be industry-specific, given the peculiar behavior of young biotech companies highly focalized on R&D activities.
Future research will be addressed to incorporate in the framework a quality assessment system for patents, which can lead to the identification of the patents that actually bring new products to the market. Moreover, the analysis of other R&D intense industries, such as technology hardware & equipment, can improve the generalization of the findings.
References
1. Ahuja, G. and Katila, R. (2001), ‘Technological acquisitions and the innovation performance of acquiring firms: a longitudinal study,’ Strategic Management Journal, 22(3), 197-220.
Publisher – Google Scholar
2. Ahuja, G. and Lampert, C.M. (2001), ‘Entrepreneurship in the large corporation: a longitudinal study of how established firms create breakthrough inventions,’ Strategic Management Journal, 22(6), 521-543.
Publisher – Google Scholar
3. Argote, L. (1999) Organizational Learning: Creating, Retaining and Transferring Knowledge, Kluwer Academic Publishers, Boston.
4. Belderbos, R., Faems, D., Leten, B. and Van Looy, B. (2010), ‘Technological activities and their impact on the financial performance of the firm: exploitation and exploration within and between firms,’ Journal of Product Innovation Management, 27(6), 869-882.
Publisher – Google Scholar
5. Chesbrough, H. (2003) Open Innovation: The New Imperative for Creating and Profiting from Technology, Harvard Business School Press, Boston.
6. Chesbrough, H. and Crowther, A.K. (2006), ‘Beyond high-tech: early adopters of open innovation in other industries,’ R&D Management, 36(3), 229-236.
Publisher – Google Scholar
7. Cooke, P. (2005), ‘Regionally asymmetric knowledge capabilities and open innovation exploring “Globalisation 2” – a new model of industry organization,’ Research Policy, 34(8),1128-1149.
Publisher – Google Scholar
8. Dittrich, K. and Duysters, G. (2007), ‘Networking as a means to strategy change: the case of open innovation,’ Journal of Product and Innovation Management, 24(6), 510-521.
Publisher – Google Scholar
9. Fetterhoff, T.J. and Voelkel, D. (2006), ‘Managing open innovation in biotechnology,’ Research-Technology Management, 49(3),14-18.
Google Scholar
10. Fleming, L. (2001), ‘Recombinant uncertainty in technological search,’ Management Science, 47(1), 117-132.
Publisher – Google Scholar
11. Gassmann, O., Reepmeyer, G. and von Zedtwitz, M. (2008) Leading Pharmaceutical Innovation: Trends and Drivers for Growth in the Pharmaceutical Industry, Springer, Berlin.
Publisher – Google Scholar
12. Graff, G.D. (2003), ‘Observing technological trajectories in patent data: empirical methods to study the emergence and growth of new technologies,’ American Journal of Agricultural Economics, 85(5), 1266-1274.
Publisher – Google Scholar
13. Gupta, A.K., Smith, K.G. and Shalley, C.E. (2006), ‘The interplay between exploration and exploitation,’ Academy of Management Journal, 49(4), 693-706.
Publisher – Google Scholar
14. Hall, B.H., Jaffe, A. and Trajtenberg, M. (2005), ‘Market value and patent citations: a first look,’ NBER Working paper.
15. He, Z.L. and Wong, P.K. (2004), ‘Exploration vs. exploitation: an empirical test of the ambidexterity hypothesis,’ Organization Science, 15(4), 481-494.
Publisher – Google Scholar
16. Hung, S.W. and Tang, R.H. (2008), ‘Factors affecting the choice of technology acquisition mode: an empirical analysis of the electronic firms of Japan, Korea and Taiwan,’ Technovation, 28(9), 551-563.
Publisher – Google Scholar
17. Kleyn, D., Kitney, R. and Atun, R. (2007), ‘Partnership and innovation in the life sciences,’ InternationalJournal of Innovation Management, 11(2), 323-347.
Publisher – Google Scholar
18. Laursen, K. and Salter, A. (2006), ‘Open for innovation: the role of openness in explaining innovation performance among U.K. manufacturing firms,’ Strategic Management Journal, 27(2), 131-150.
Publisher – Google Scholar
19. Lerner, J. (1994), ‘The Importance of Patent Scope: An Empirical Analysis,’ The RAND Journal of Economics, 25(2), 319-333.
Publisher – Google Scholar
20. Leten, B., Belderbos, R. and Van Looy, B. (2007), ‘Technological diversification, coherence, and performance of firms,’ Journal of Product Innovation Management, 24(6), 567-579.
Publisher – Google Scholar
21. March, J. (2006), ‘Rationality, foolishness, and adaptive intelligence,’ Strategic Management Journal, 27(2), 201-214.
Publisher – Google Scholar
22. Mazzucato, M. and Tancioni, M. (2012), ‘R&D, patents and stock return volatility,’ Journal of Evolutionary Economics, 22(4), 811-832.
Publisher – Google Scholar
23. Meyer, J.P. (2011), ‘Effects of exploration on the relationship between intellectual capital and the retained technical value of innovation,’ International Journal of Innovation Management, 15(2), 249-277.
Publisher – Google Scholar
24. Michelino, F., Cammarano, A., Lamberti, E. and Caputo, M. (2014), ‘Innovation behaviours in technology hardware & equipment industry: an empirical analysis based on patent data,’ Proceedings of the 24th International Business Information Management Association Conference (IBIMA), 6-7 November 2014, Milan, Italy, ISBN: 978-0-9860419-3-8, pp. 419-430.
25. Michelino, F., Lamberti, E., Cammarano, A. and Caputo, M. (2015a), ‘Open models for innovation: an accounting-based perspective,’ International Journal of Technology Management, 68(1/2), 99-121.
Publisher – Google Scholar
26. Michelino, F., Lamberti, E., Cammarano, A. and Caputo, M. (2015b), ‘Measuring open innovation in the bio-pharmaceutical industry,’ Creativity and Innovation Management, 24(1), 4-28.
Publisher – Google Scholar
27. Miller, D.J. (2004), ‘Firms’ technological resources and the performance effects of diversification: a longitudinal study,’ Strategic Management Journal, 25(11), 1097-1119.
Publisher – Google Scholar
28. Miller, D.J., Fern, M.J. and Cardinal, L.B. (2007), ‘The use of knowledge for technological innovation within diversified firms,’ Academy of Management Journal, 50(2), 308-326.
Publisher – Google Scholar
29. O’Reilly, C.A. and Tushman, M.L. (2004), ‘The ambidextrous organization,’ Harvard Business Review, 82(4), 74-82.
30. Powell, W., White, D., Koput, K. and Owen-Smith, J. (2005), ‘Network dynamics and field evolution: the growth of interorganizational collaboration in the life sciences,’ American Journal of Sociology, 110(4), 1132-1205.
Publisher – Google Scholar
31. Sakata, J., Suzuki, K. and Hosoya, J. (2009), ‘The analysis of research and development efficiency in Japanese companies in the field of fuel cells using patent data,’ R&D Management, 39(3), 291-304.
Publisher – Google Scholar
32. Schroll, A. and Mild, A. (2011), ‘Open innovation modes and the role of internal R&D: an empirical study on open innovation adoption in Europe,’ European Journal of Innovation Management, 14(4), 475-495.
Publisher – Google Scholar
33. Suzuki, J. and Kodama, F. (2004), ‘Technology diversity of persistent innovators in Japan: two case studies of large Japanese firms,’ Research Policy, 33(3), 531-549.
Publisher – Google Scholar
34. van de Vrande, V., de Jong, J.P.J., Vanhaverbeke, W. and de Rochemont, M. (2009), ‘Open innovation in SMEs: trends, motives and management challenges,’ Technovation, 29(6/7), 423-437.
Publisher – Google Scholar