Introduction
In modern supply chain networks, in order to increase their competitive edge, the firms employ new strategies such as recentring their activities by outsourcing some part of their production, proposing increased diversity of products to capture the market share, focusing on flexibility and responsiveness, with longer paths and shorter clock speeds, today’s leaner, just-in-time etc, these strategies augment the vulnerabilities of the firms in an uncertain environment (Gonca, T et al., 2010; Jianxin, X, 2008; Lu, S, 2011).
Due to the increasing supply chain complexity, the notion of supply chain risk management has gained an increasing popularity in recent years.
Nowadays, the transportation problems and traffic management risks represent an important challenge for the development and infrastructure use. In this context, it seems important to build up measuring tools for Vehicle Routing Problems (VRP), therefore, we integrate the congestion effect as a supply chain risk management concept, and we will try to measure its impact on environment using a survey.
The survey has been shared world-wide via professionals’ websites and emailing and it aims to analyze the environment impact on supply chain researches and daily transportation operations. But the most important in this research project is to develop scientific tools that will allow us to evaluate the traffic congestion effect which is considered as a supply chain risk factor.
Definitions
Supply Chain (SC)
The term supply chain is relatively new addition to the lexicon of management, first used in the early 1980s when writers coined the phrase to describe an emerging management discipline (Peck, H et al., 2003). The literature offers a variety of definitions of supply chain.
According to (Kissani, I , 2008) a supply chain is defined as a network of suppliers, factories, warehouses, and distribution centers through which raw materials are produced, transformed, and delivered to the customer.
Supply Chain Management (SCM)
Supply Chain Management (SCM) is now a fact of life. It is also a dynamic entity that is constantly changing and evolving in response to changes in technology, competitive actions, and customer demands (Melnyk, S et al., 2006), and it is a field of growing interest for both companies and researchers (Bemmel, J.H, 2000).
The literature on SCM is plentiful (Gonca, T et al., 2010), and the definition of supply chain management can be easily found in the research papers (Jianxin, X, 2008).
For (Simchi-Levi, D et al., 2000), Supply Chain Management is the set of approaches used to efficiently integrate suppliers, manufacturers, warehouses and stores so that merchandise is produced and distributed at the right quantity, to the right locations, and at the right time, in order” to minimize system wide costs while , satisfying service level requirements.
By (Gunasekarana, A et al., 2008), SCM is defined as the coordination of resources and the optimization of activities across the value chain to obtain competitive advantages.
The goals of supply chain management are to reduce uncertainty and risks in the supply chain (Guiffrida, AL et al., 2006).
Supply chain management without considering risk issues in a systemic perspective and their impact on the performance measures eventually lead to suboptimal results and inconsistent processes (Gonca, T et al., 2010).
Supply Chain Risk Management
Managing risk in supply chains is an important topic in supply chain management. The topic importance is due to several industry trends currently in place: increase in strategic outsourcing by firms, globalizations of markets, increase reliance on suppliers of specialized capabilities and innovation, reliance on supply networks for competitive advantage, and emergence of information technologies that make it possible to control and coordinate extended supply chains (Lu, S, 2011).
Supply chain risk management has increasingly become a more popular research area recently. Various papers, with different focus and approaches, have been published since a few years ago (Rossi, T, et al., 2006; Iwan, V et al., 2009; Tang, O, 2010).
Literature Review: Congestion is a Supply Chain Risk Factor
It must be at first noted that most researches and studies affirmed that the traffic congestion, characterizing contemporary metropolises, causes repercussions that affect all the society in general and more precisely economic actors (Moustakbal, A, 2009).
And it is, in most, if not all, perceived by residents and businesses as a problem (Blanco, H et al., 2009). It is harmful to the economy, increasing production costs, worsening pollution, increases CO2 emissions and causes considerable loss of time. According to the Texas Transportation Institute (TTI), in 2003, congestion in the top 85 U.S. urban areas caused 3.7 billion hours of travel delay and 2.3 billion gallons of wasted fuel, for a total cost of $63 billion.
Also and according to the federal highway administration in 2006, the costs generated by transport congestion could be as high as 1.5% of GDP in some countries.
For the responsible of logistics, the traffic congestion makes a big problem in the managing of the distribution networks (Moustakbal, A, 2009). Also, worsening traffic congestion has been identified as a supply chain risk factor (McKinnon, A et al., 2008).
Survey review
In order to evaluate the supply chain features and their effect with environment issue, we have made a survey based on setting the general criteria and the interaction between them. The survey has been shared world-wide throw professionals’ websites and by emailing.
The survey aims to analyze the environment impact in supply chain researches and daily transport operations.
The editorial questions were based on the literature reviews and previous environmental impact analysis:
- Do you take into consideration environmental impacts on studying logistic planning and risk management strategies?
- How do you evaluate the following items (Quality, Time, Cost and Environment) in logistic systems and how important are they to you?
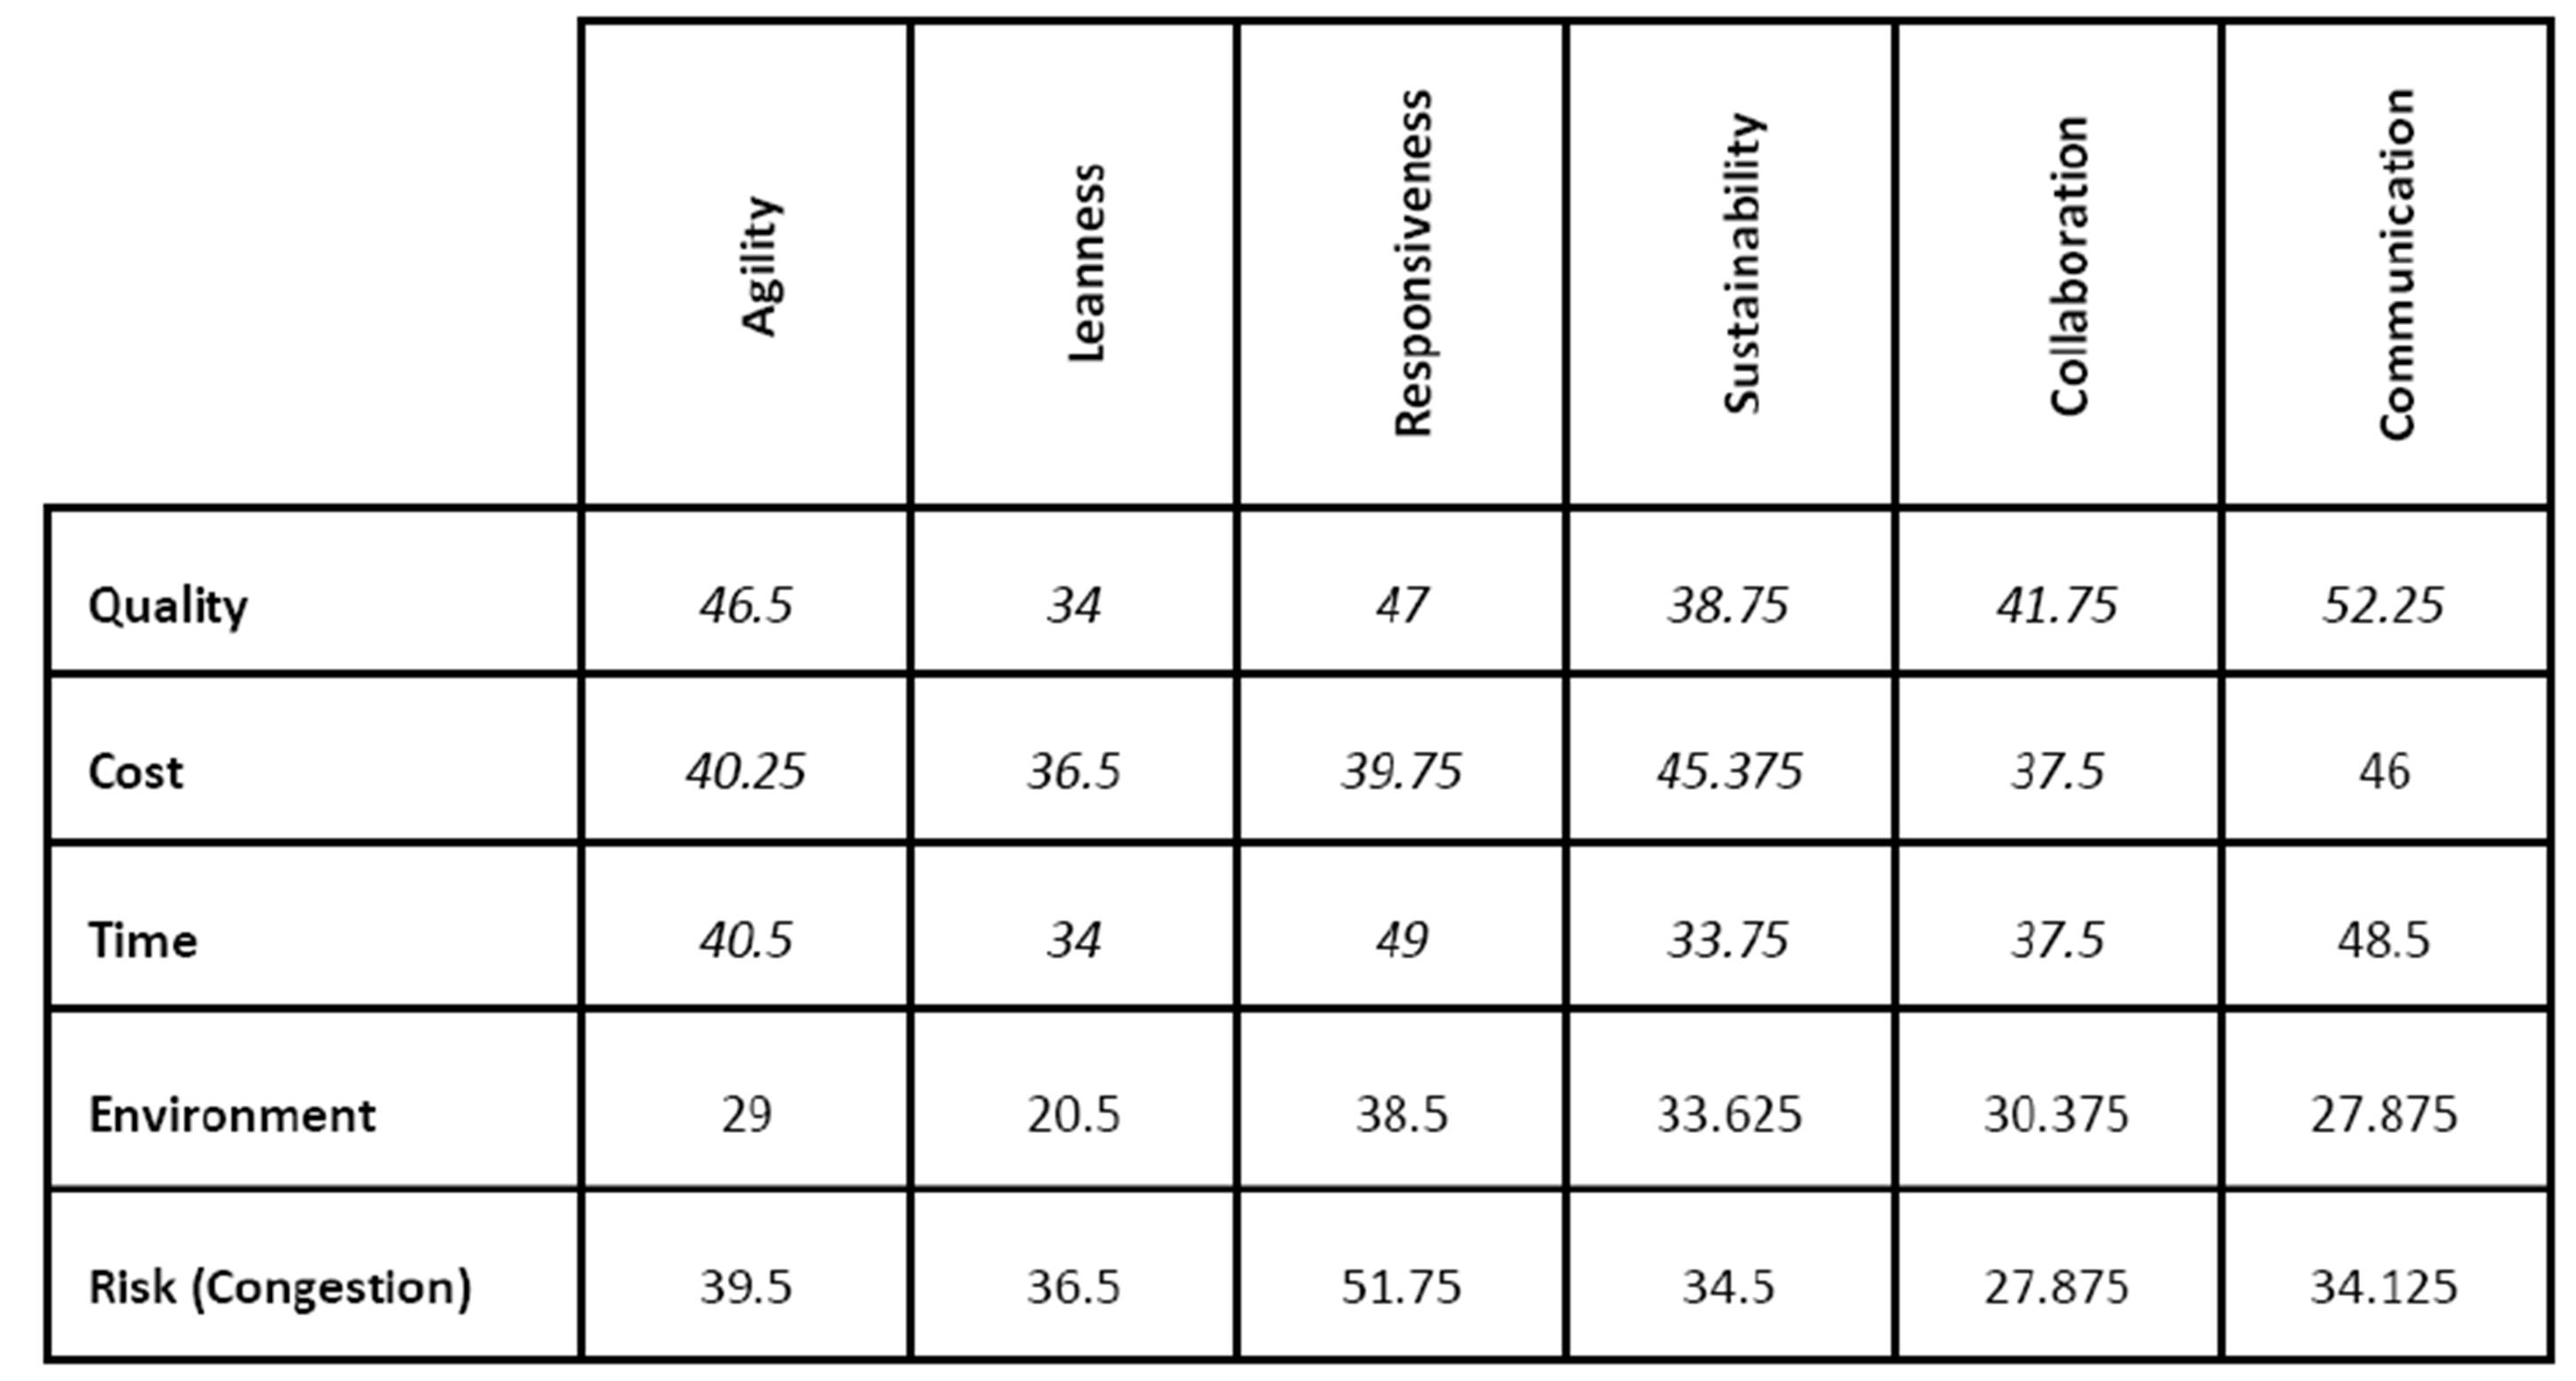
- How do you evaluate the importance of those characteristics (Agility, Leanness, Responsiveness, Sustainability, Collaboration, and Communication) in logistic systems according to the following aspects (Quality, Time, Cost, Environment and Risk (Congestion))?
Survey Participants
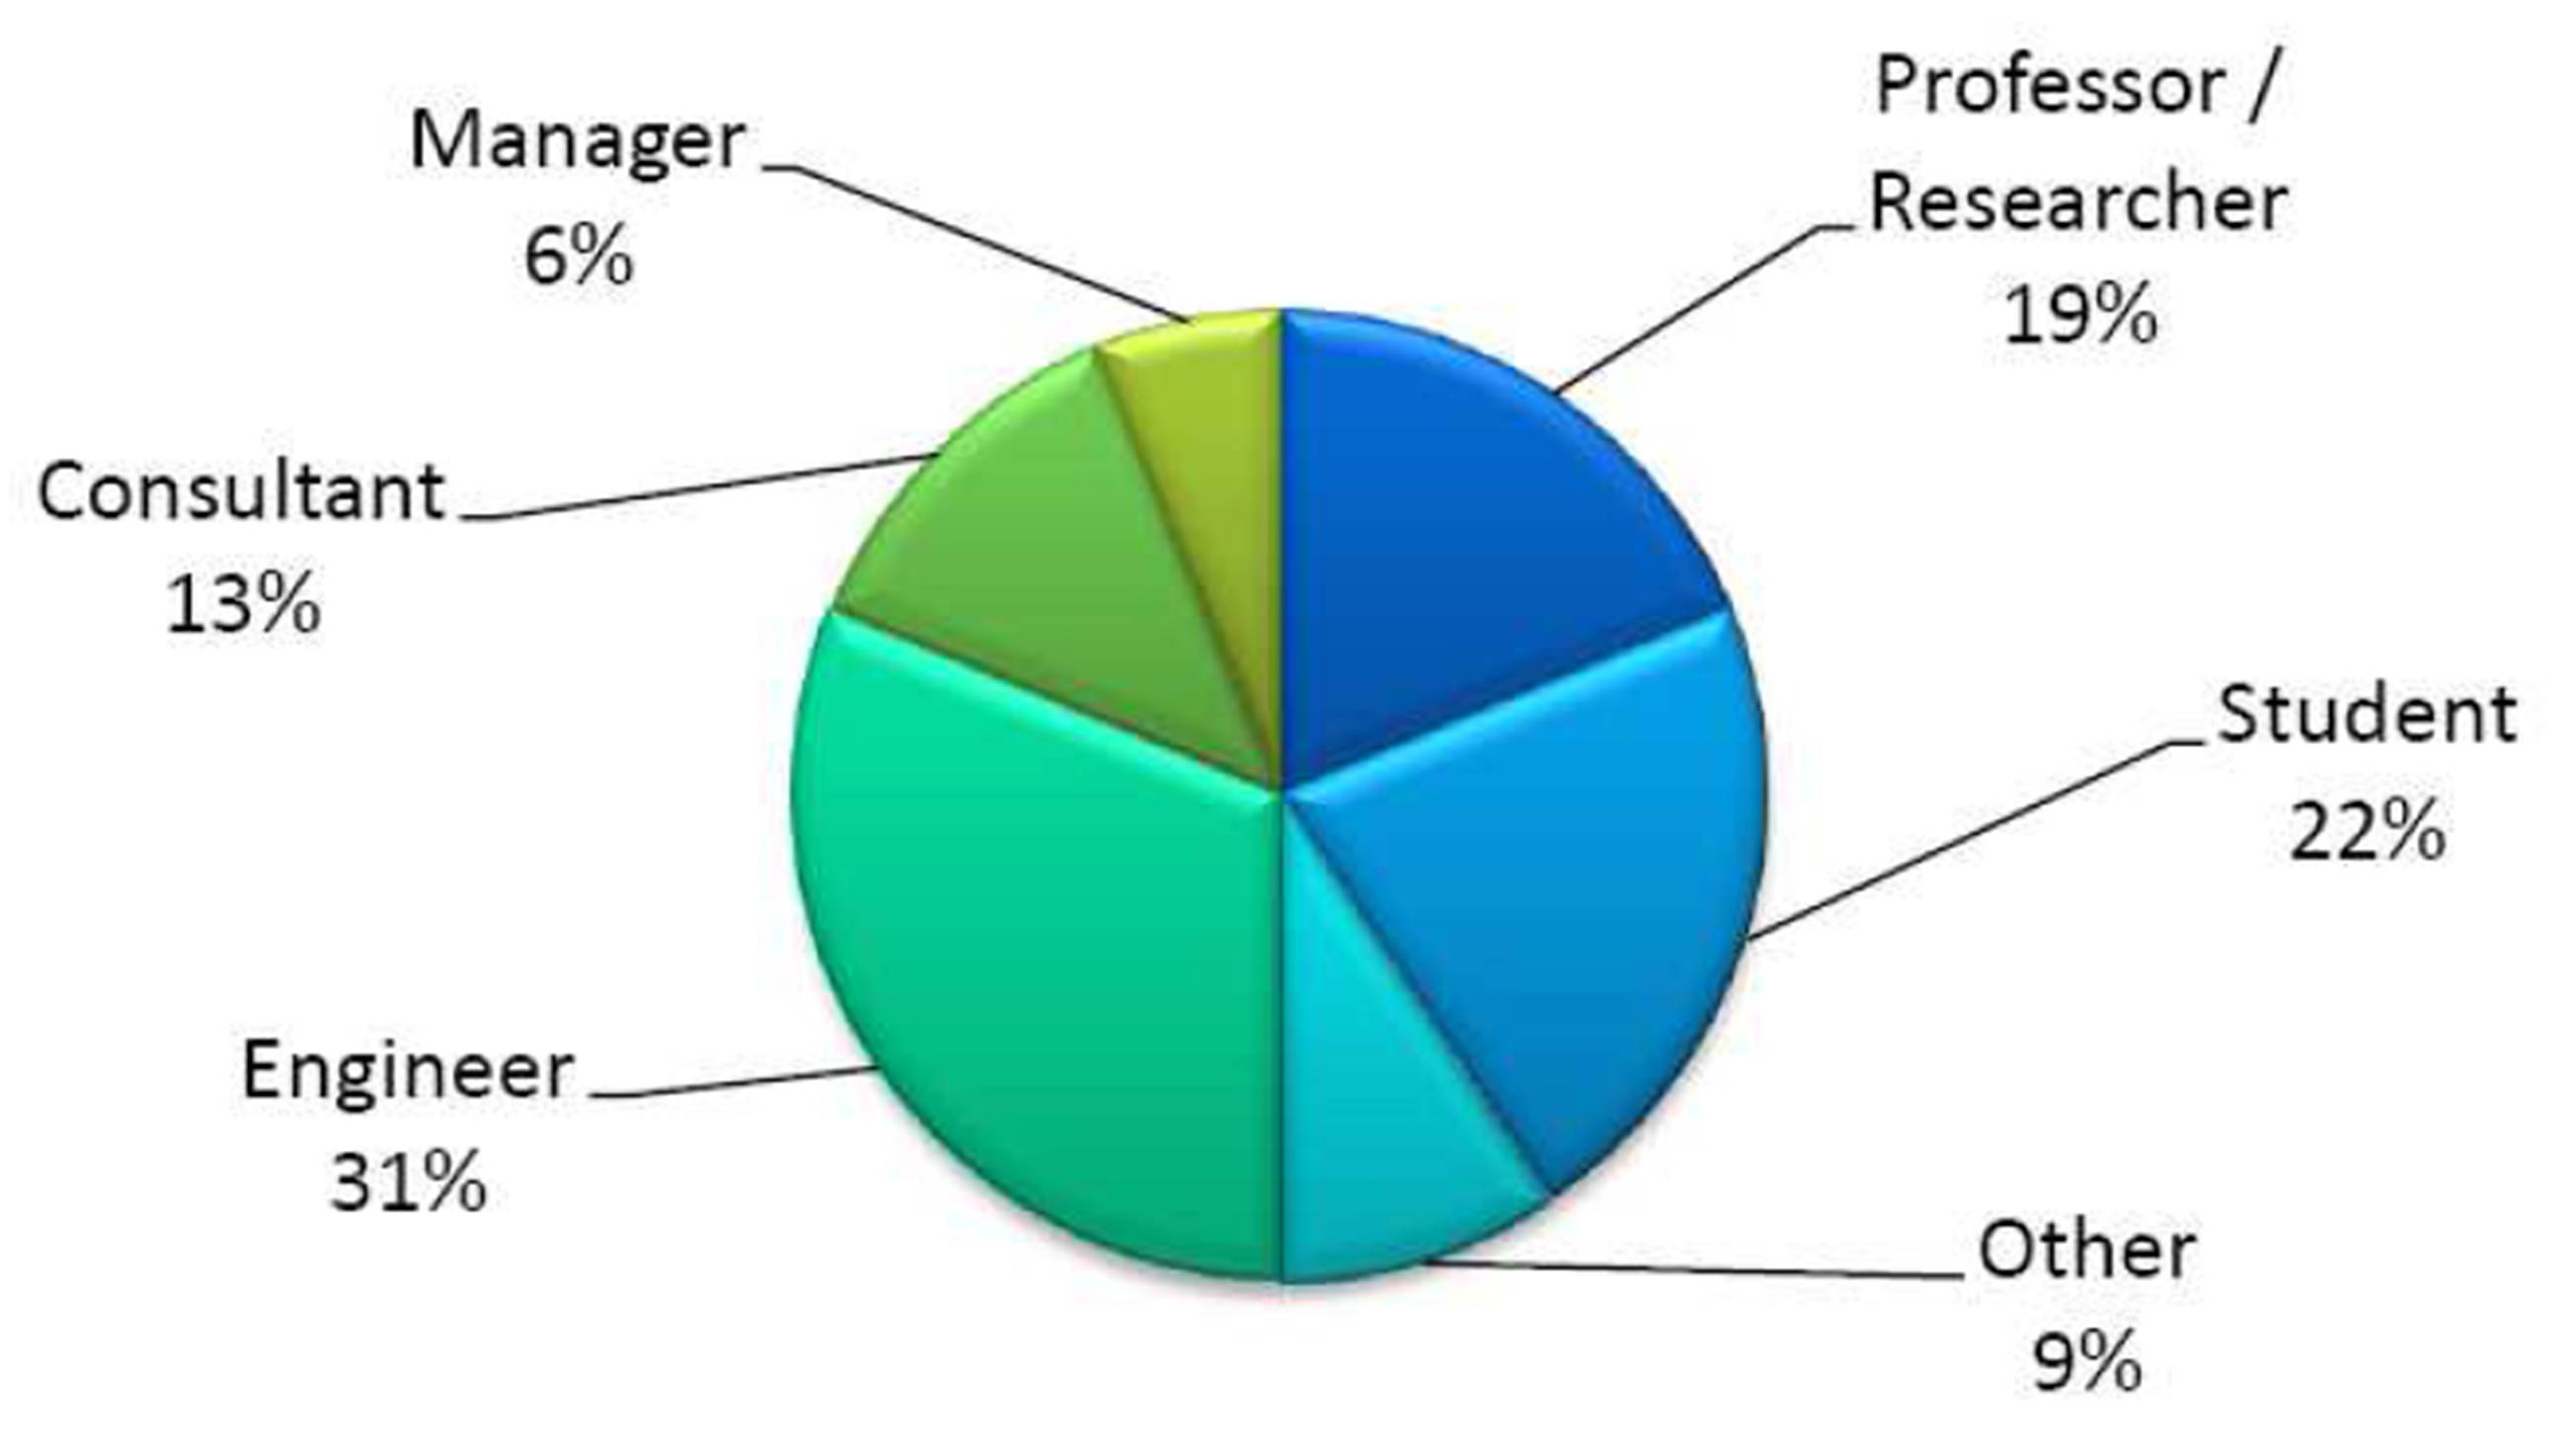
The survey has been answered by 519 professionals, but our study takes into concern only the first 350 participants due to technical constraints.
Figure 1: Survey participants’ professions
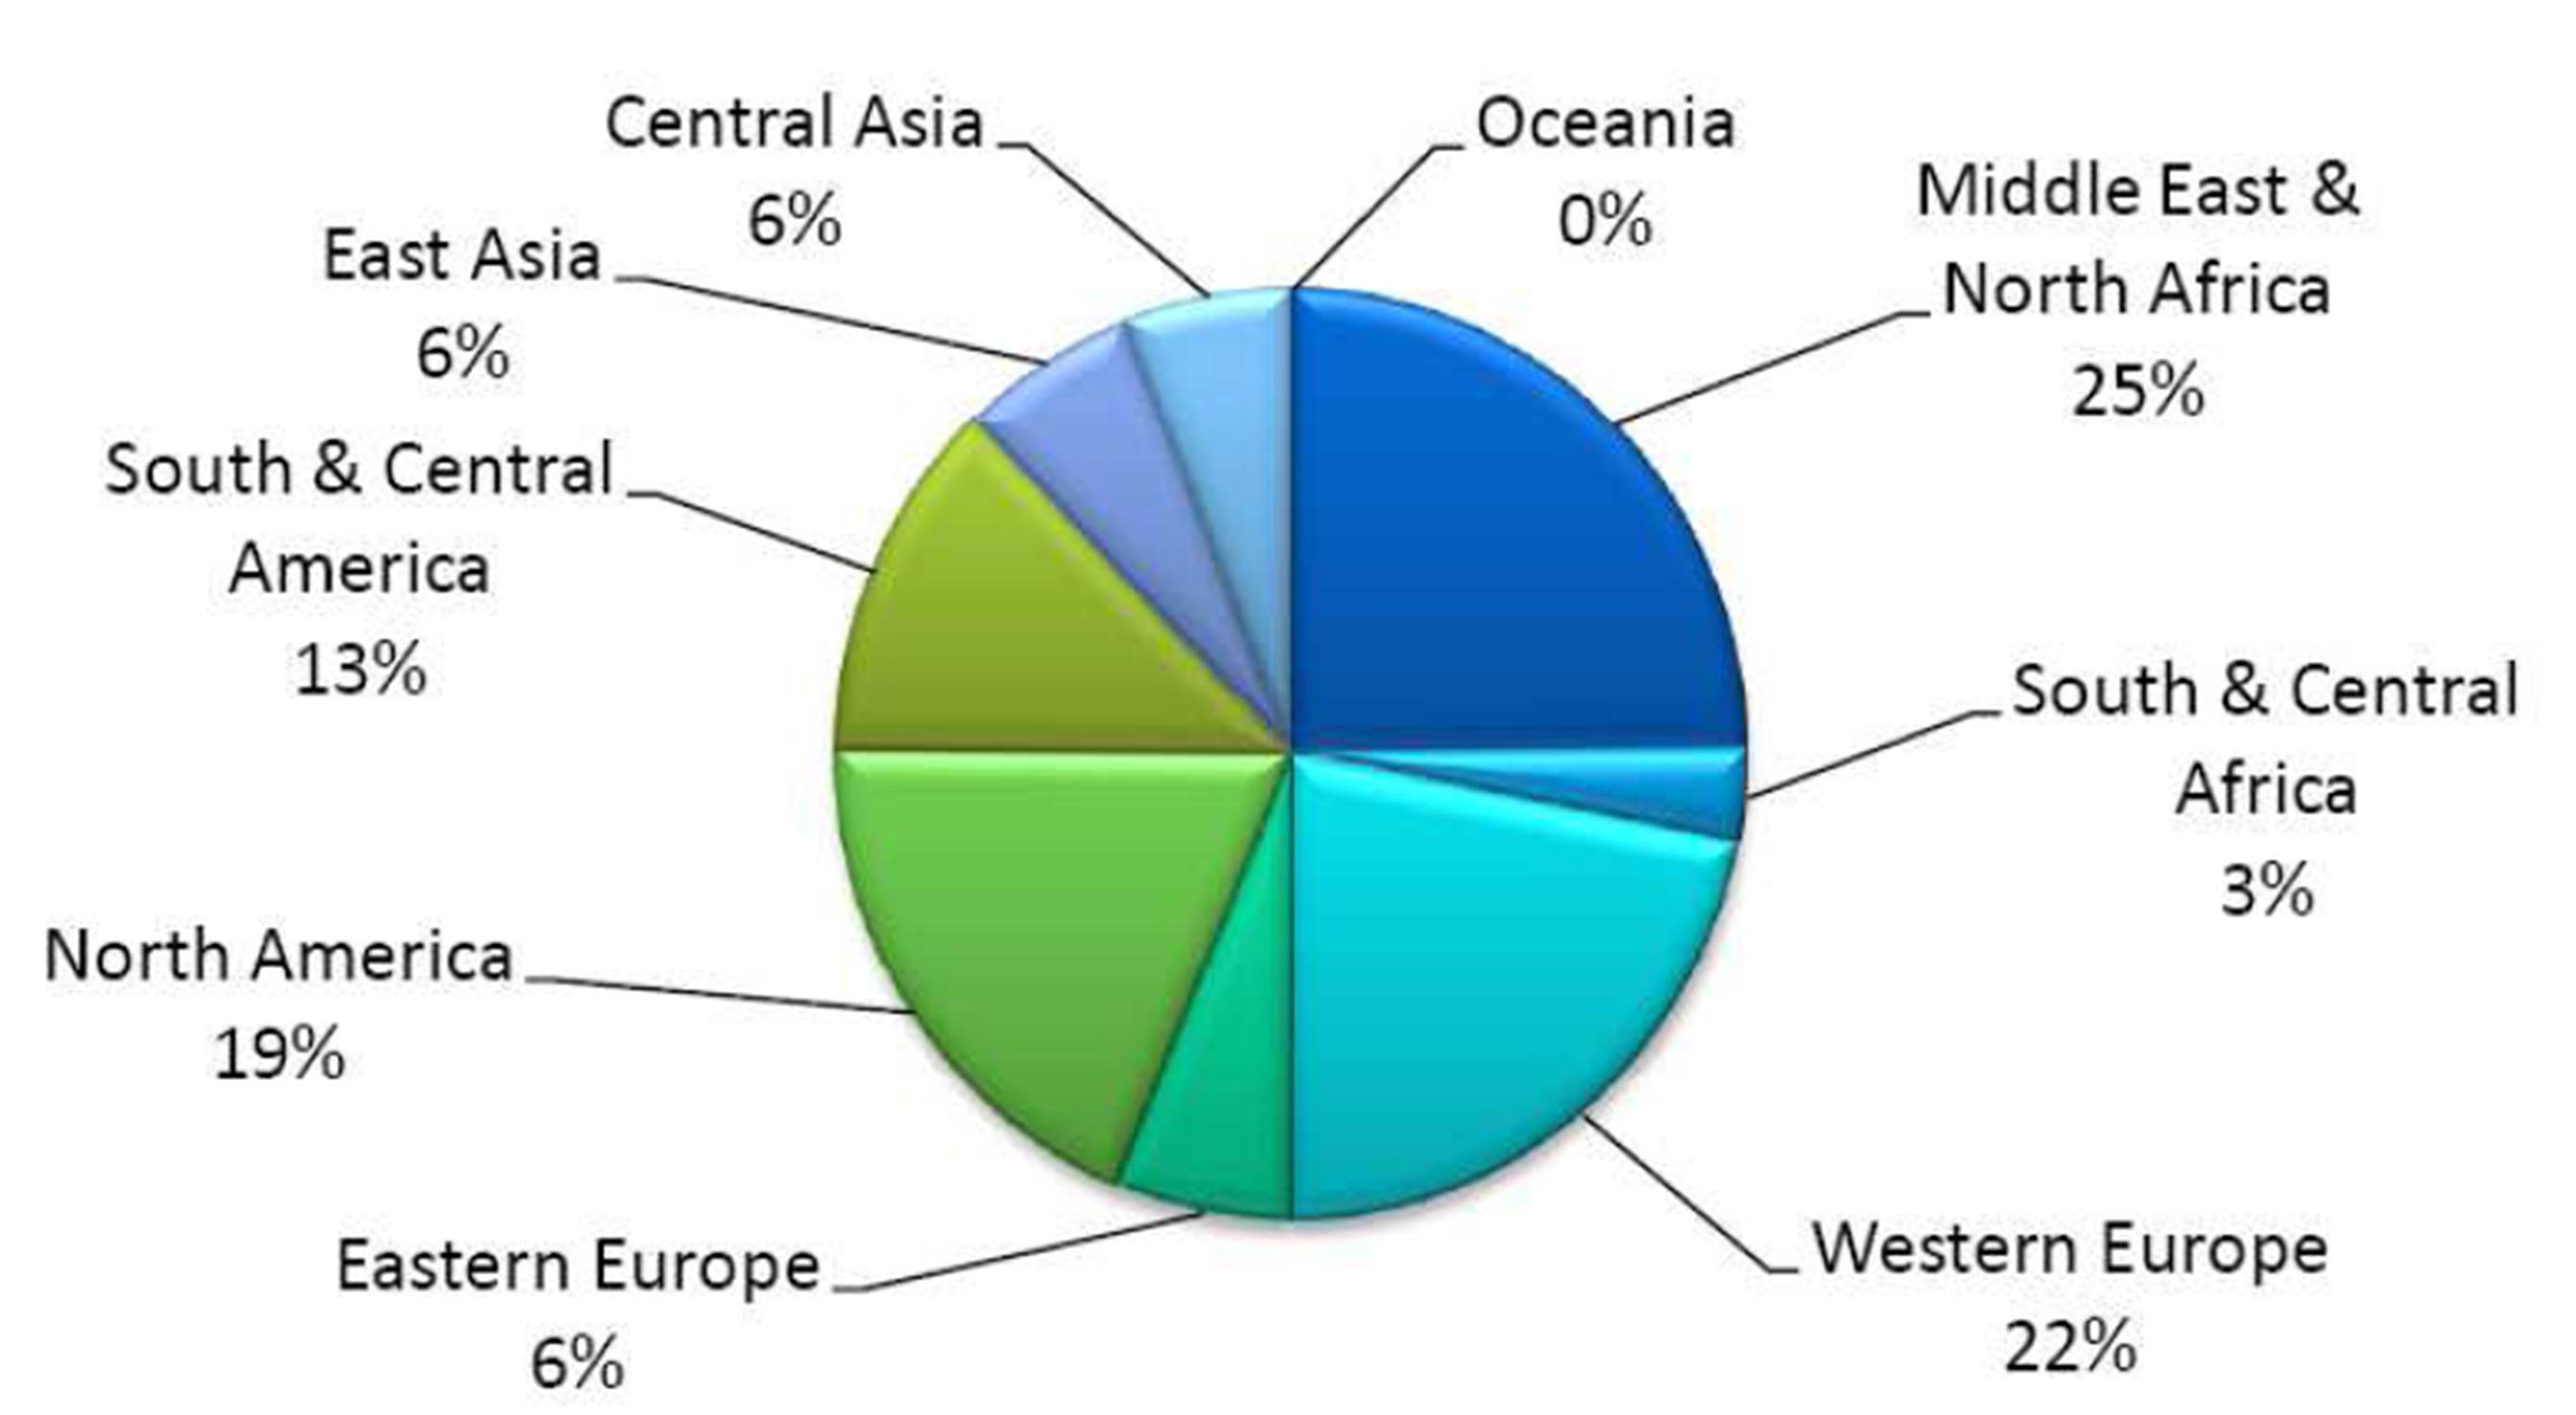
Figure 2: Survey participants’ regions
Results Analysis
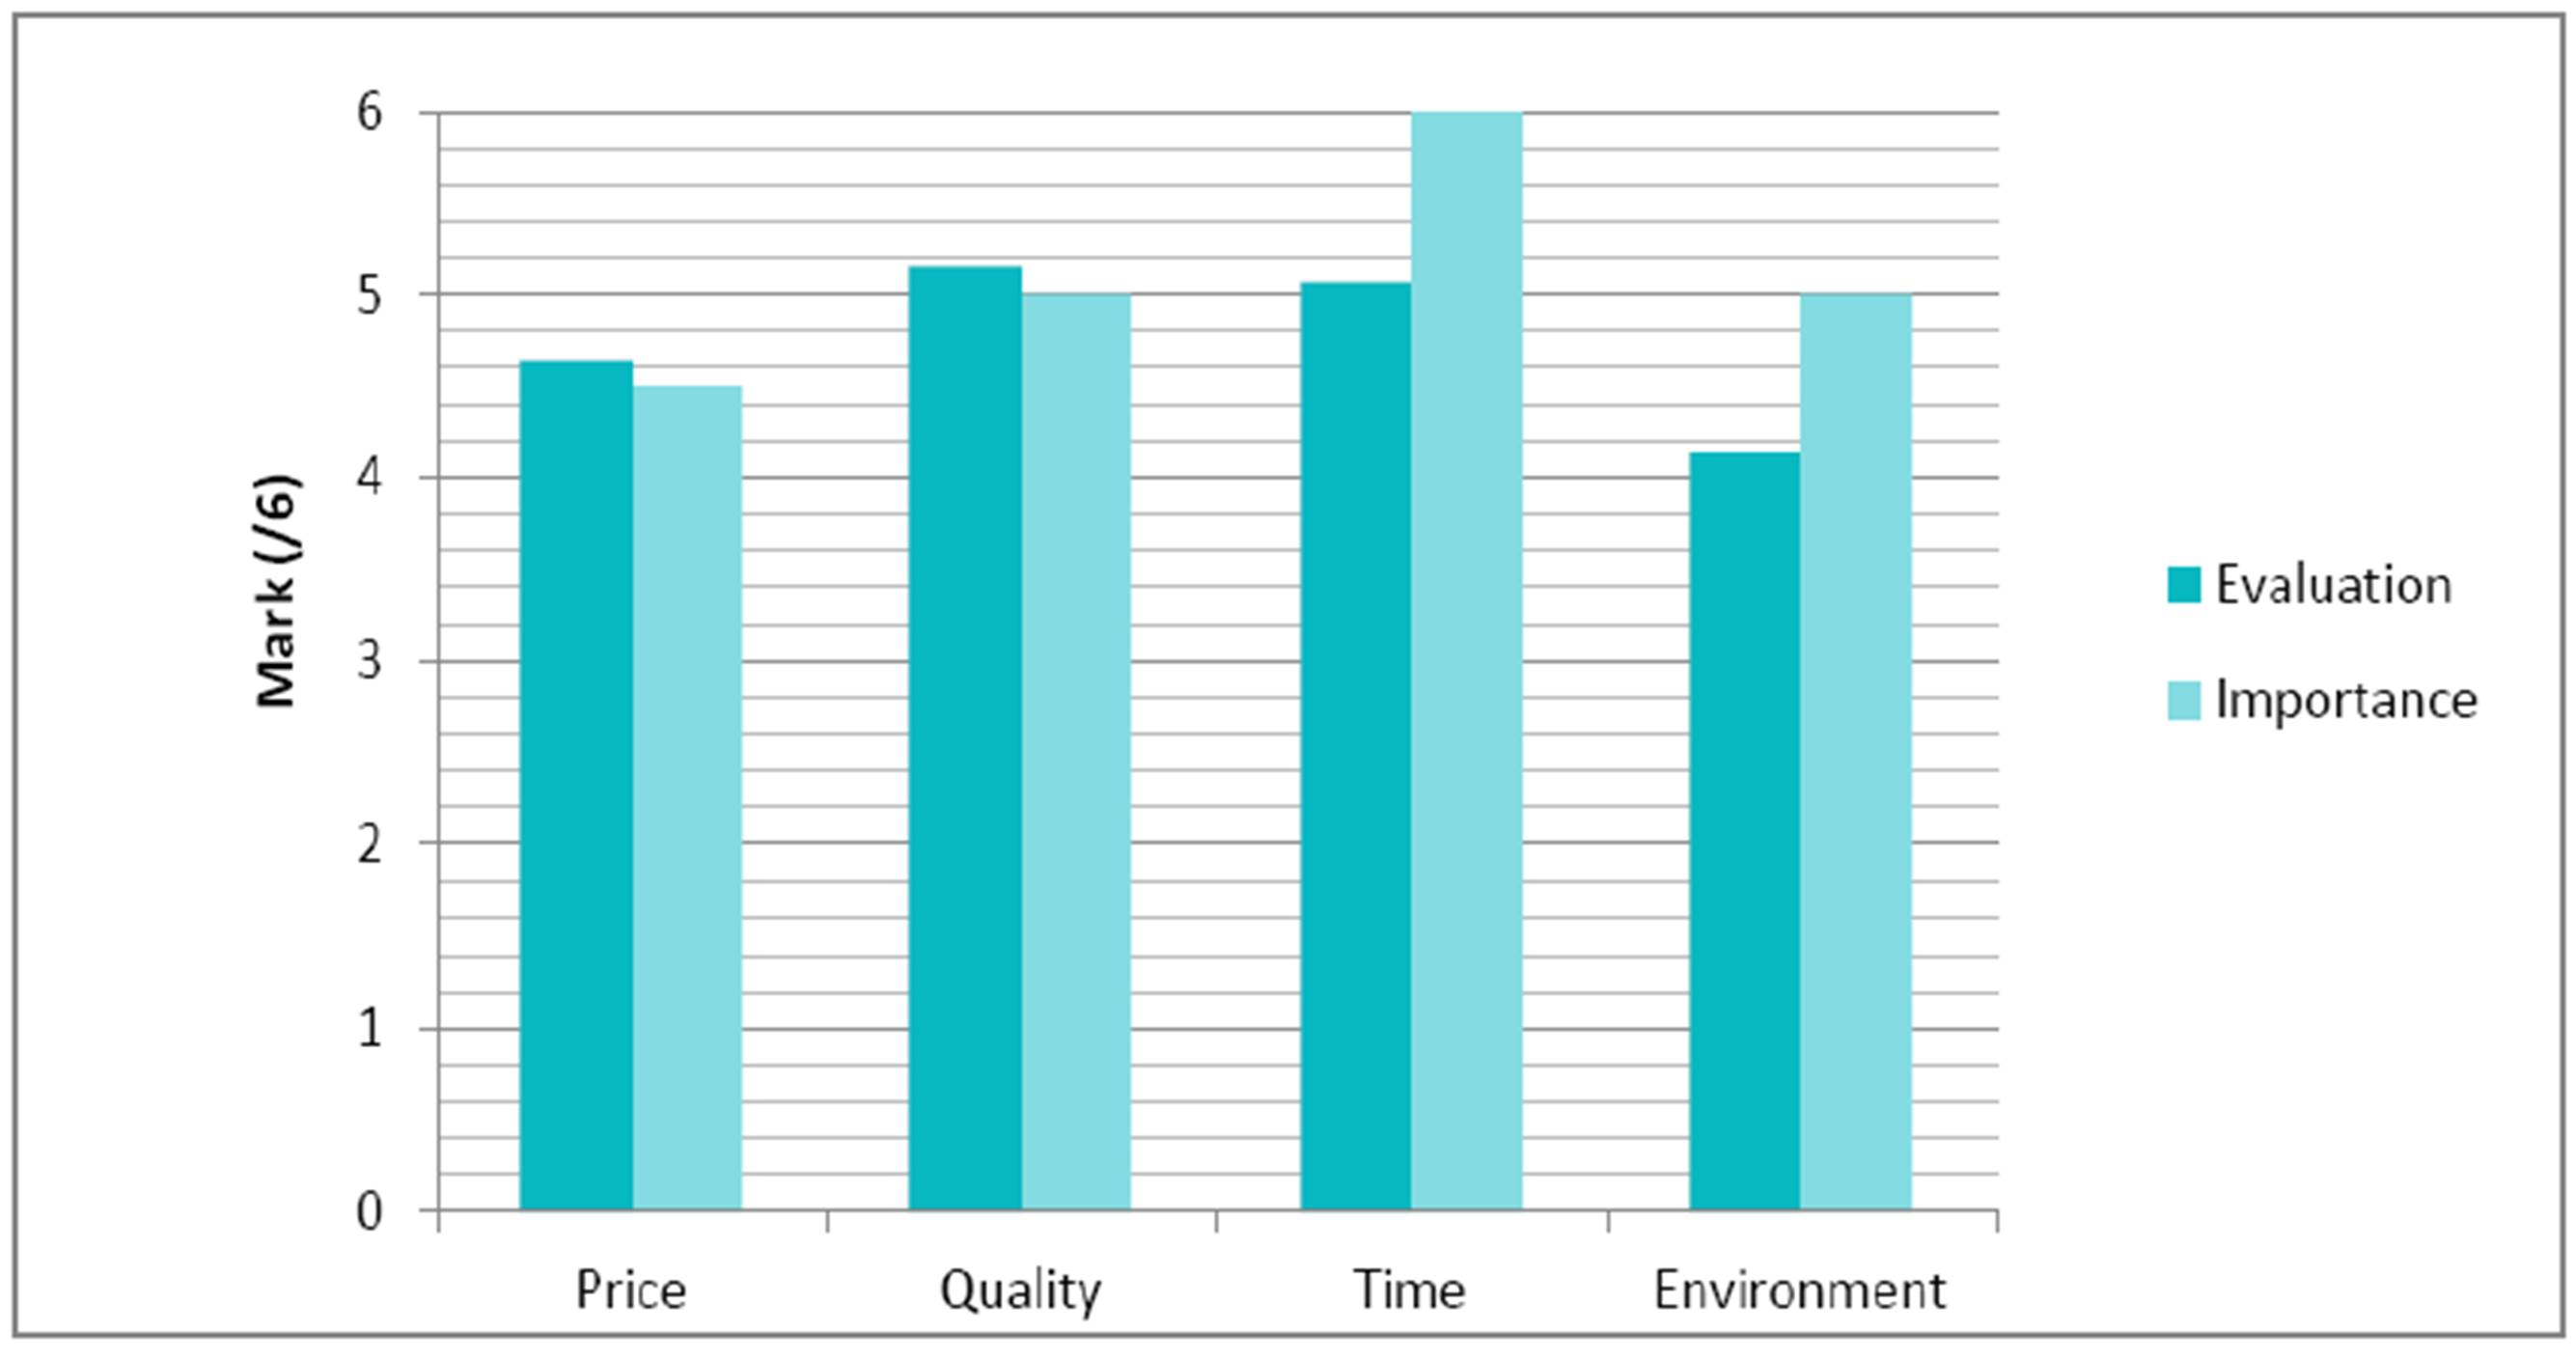
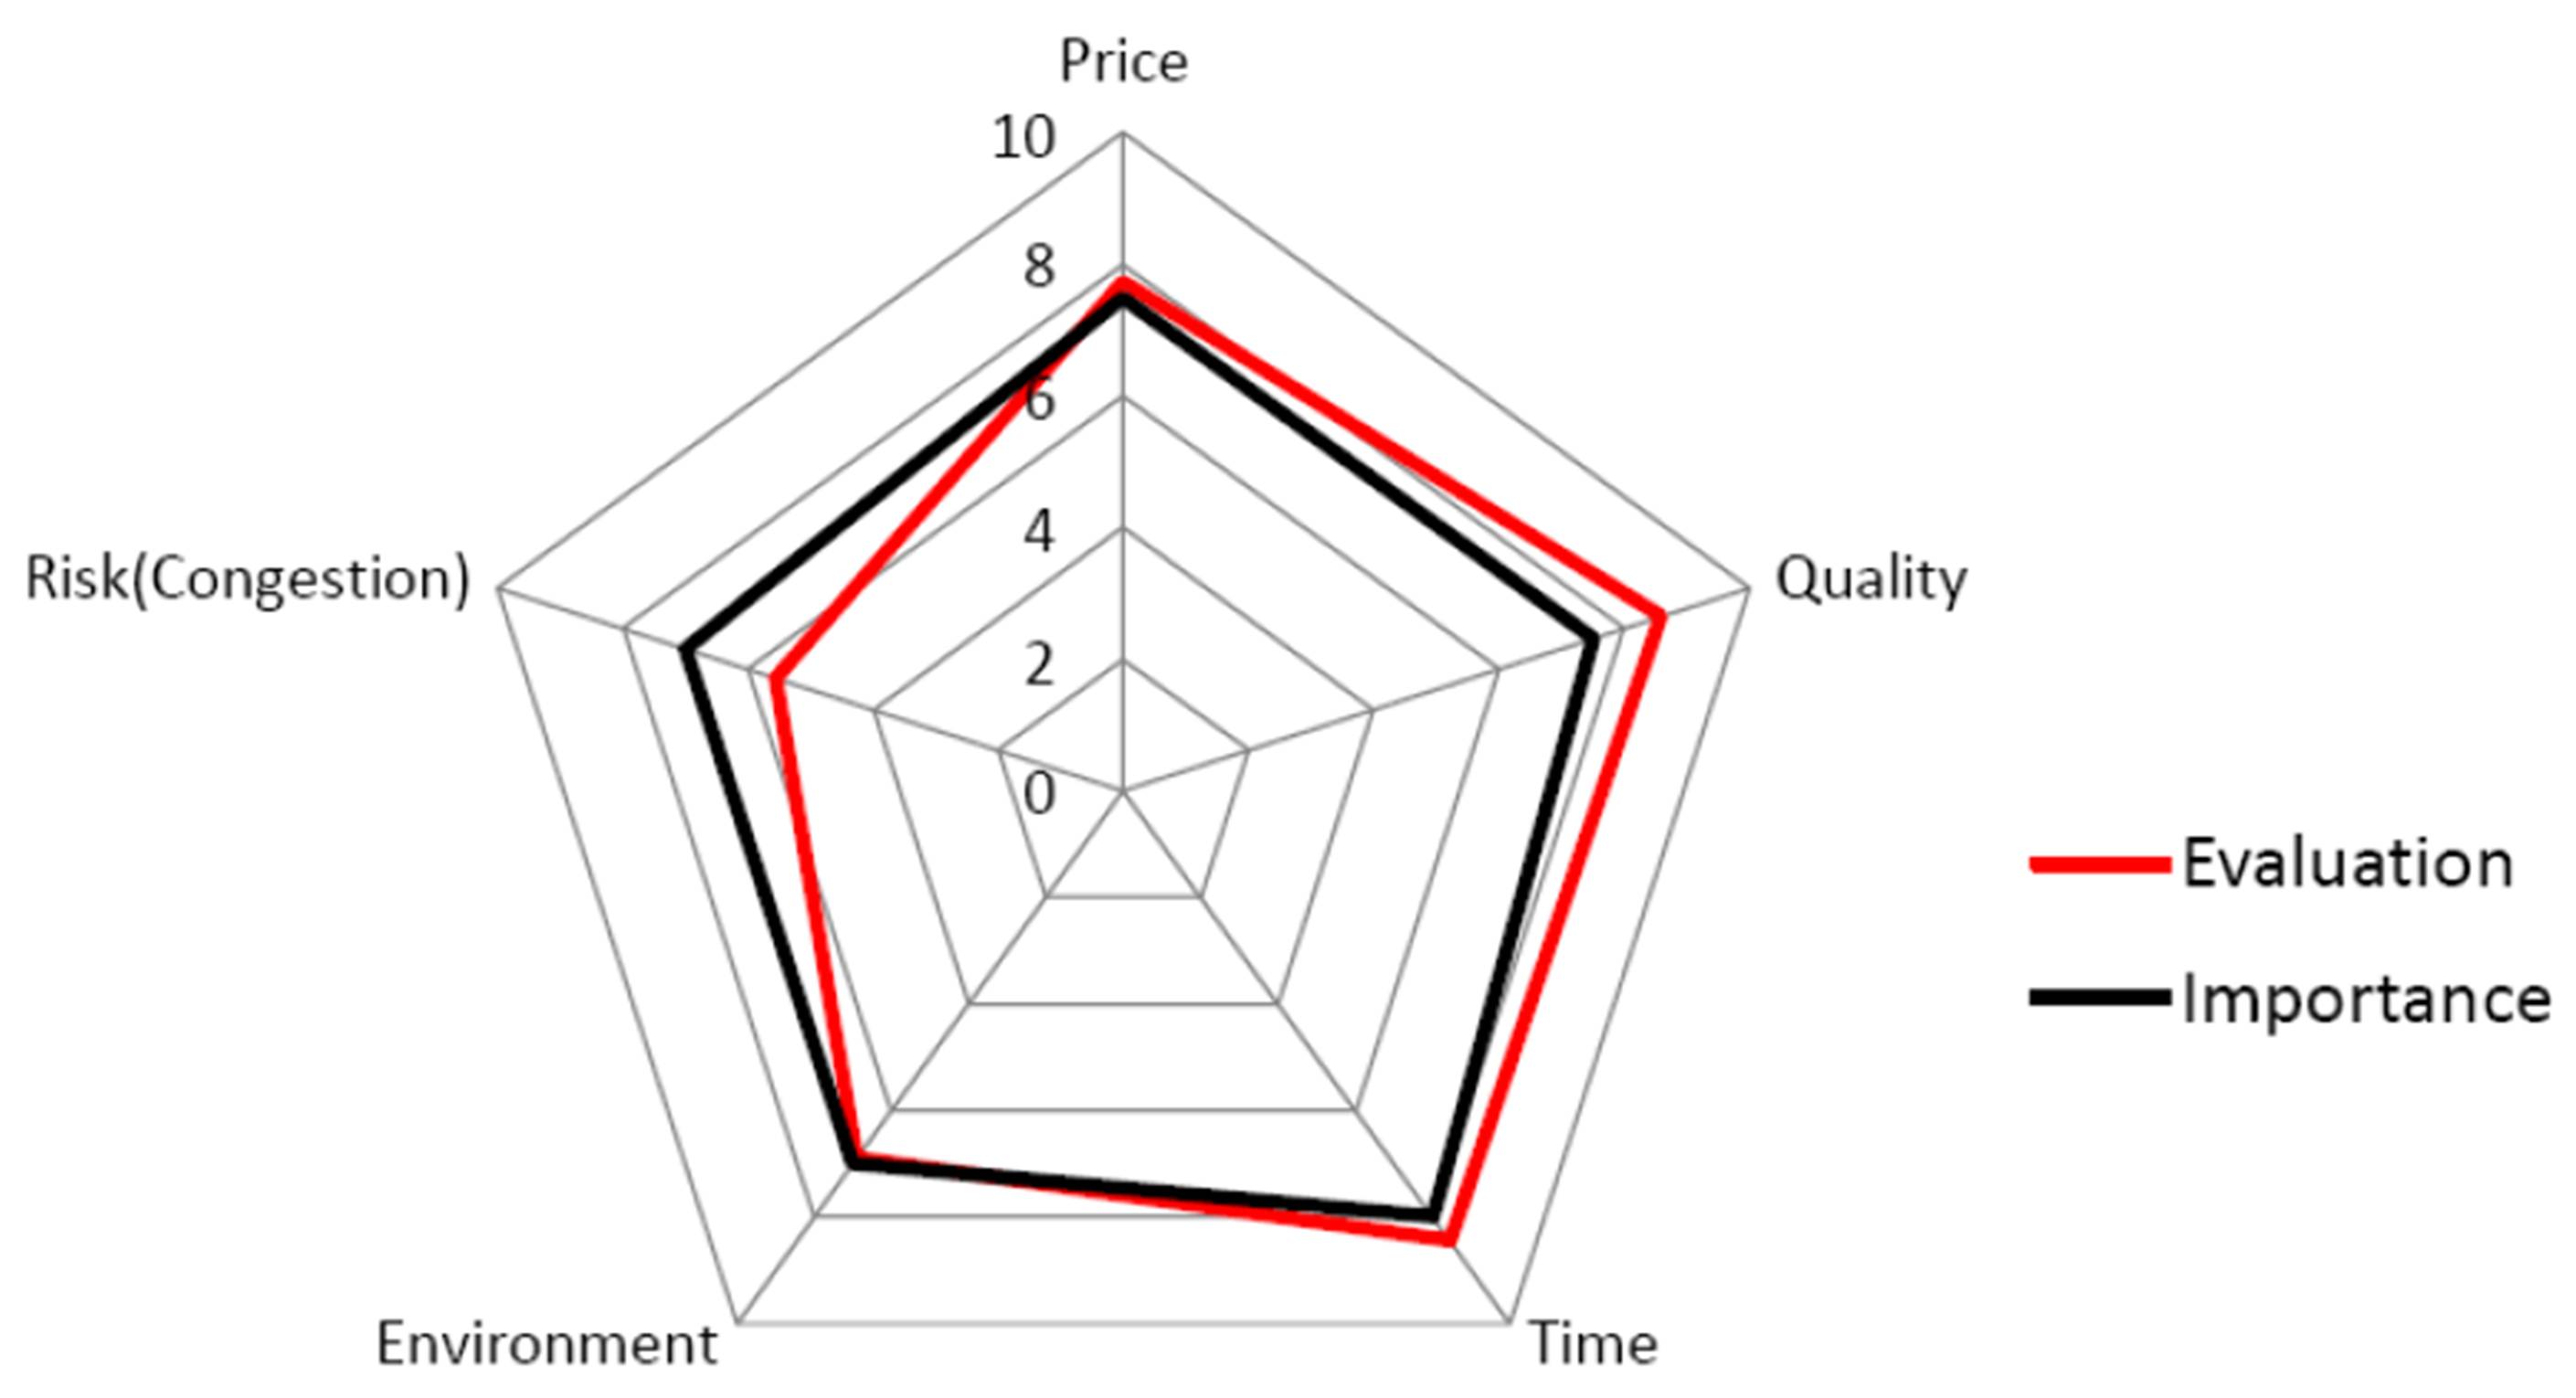
The aim of the survey, as sited below, is to examine the current behavior of supply chain with the environmental impact, and to estimate the importance of each criterion. So, using the available website tools, we consider a scale of rating based on having a mark (/6) for each one and for both issues: evaluation of current situation and estimation of the importance.
Figure 3: Survey results analysis
Table 1: Performance Matrix
Using matrices analysis functions, we rate each feature, via a selection of criteria which allow as making reasonable estimations, in order to converge the research to reality.
Figure 4: Survey results modelling
So, as we can see, congestion risk is underestimated in traffic managing and research, comparing to the other features. Also, environment is not well evaluated in studies and investigations.
City planners, officials and residents all agree that the traffic congestion is a problem faced daily in modern life. It is more difficult to agree on what kind of solutions to implement. City highway systems, infrastructures and entry points into cities, were all designed decades ago, under different theories of urban traffic measures. Planners still need to deal with the basic problem of congestion and ways of doing so, range from large-scale infrastructure projects to actions as simple as keeping the public well-informed about city route options.
Study Case
Problem Set
We have made a survey based on vehicle routing schedules dealing with a real-time vehicle routing problem with time windows and simultaneous delivery demands. The measurements are taken during two months with supervision of weekly updating schedules of a “FLORIS Distribution” company in a region of 225 km2, with nearly 300000 citizen and five main urban areas and two non-urban areas surrounding the region. We have studied the routing schedule of a simple vehicle responsible for delivering a large quantities of a singular known product and it is weekly updated (each day of the week corresponds to an area of the region). The urban areas are supplied on Monday, Tuesday, Wednesday, Thursday and Saturday. The non-urban areas are both supplied on Friday.
It is important to note that the study focused on a micro scale prototype. Therefore, a comprehensive network analysis is an essential part for modeling a solution to measure the traffic congestion.
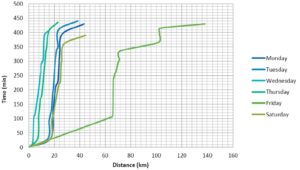
Figure 5: Routing Schedule Evaluation
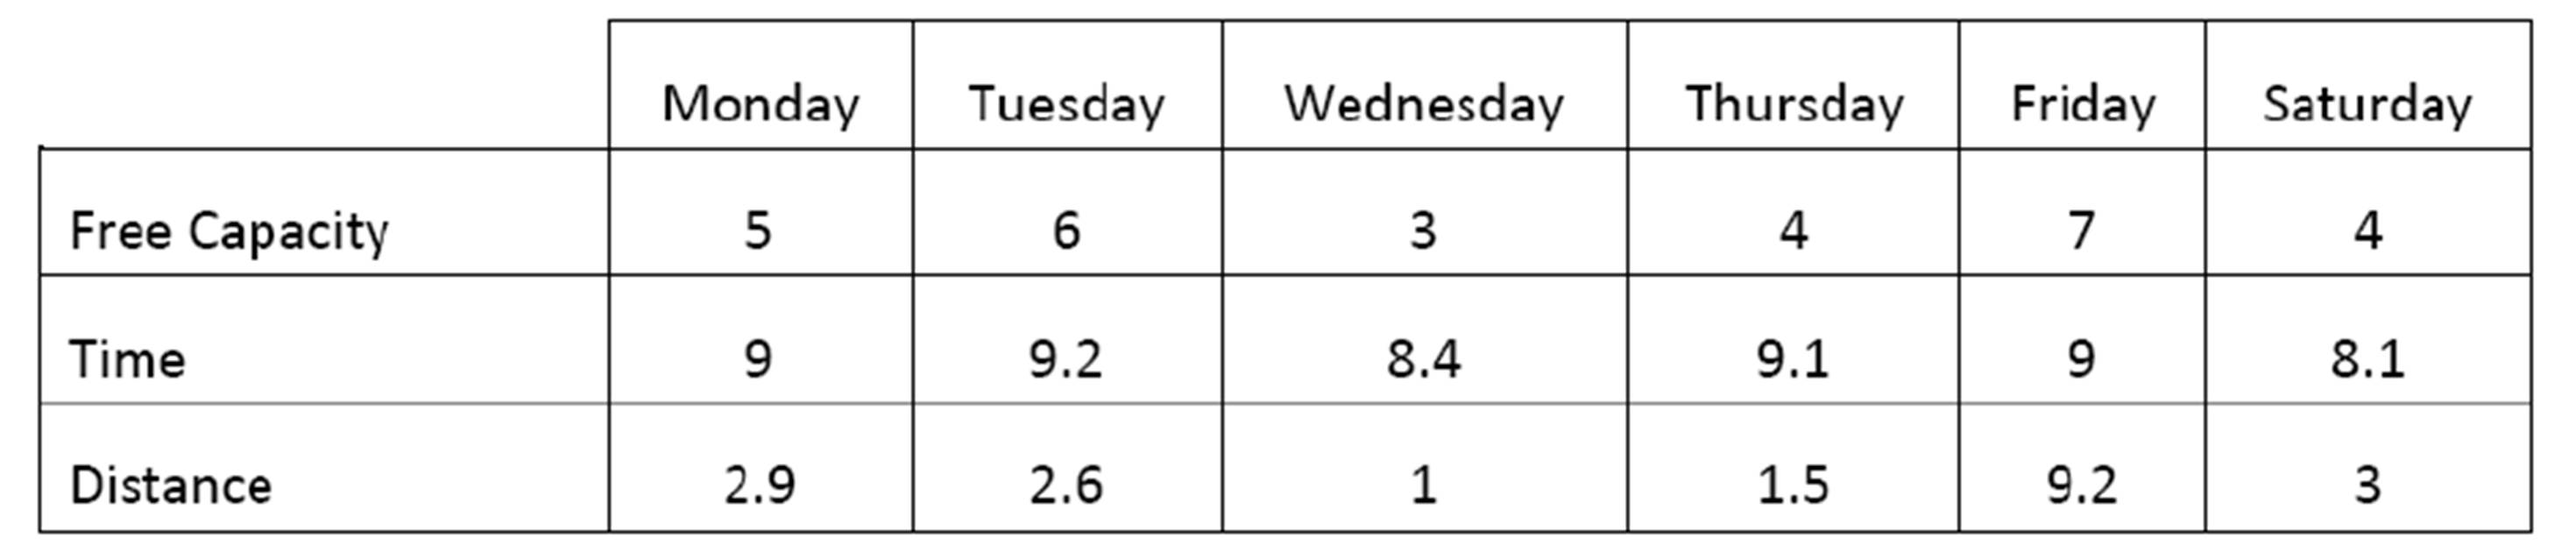
Our VRP-TW evaluation takes into consideration time, distance, speed, and vehicle capacity. So, we have taken into consideration; free capacity (due to delivering many types of products and shapes) and time duration to fulfill a demand.
Testing Result
In order to analyze the problem, we must represent the three variables in a same scale of assessment. Hence, we predicted the above values on a decimal scale, based on:
Free Capacity: 10% = 1/10.
Time: work time: 8 hours/day = 480 min/day = 10/10; 60 min = 1/10.
Distance: in our case, the max distance/day = 150 km; 15 km = 1/10.
So, we had the following values:
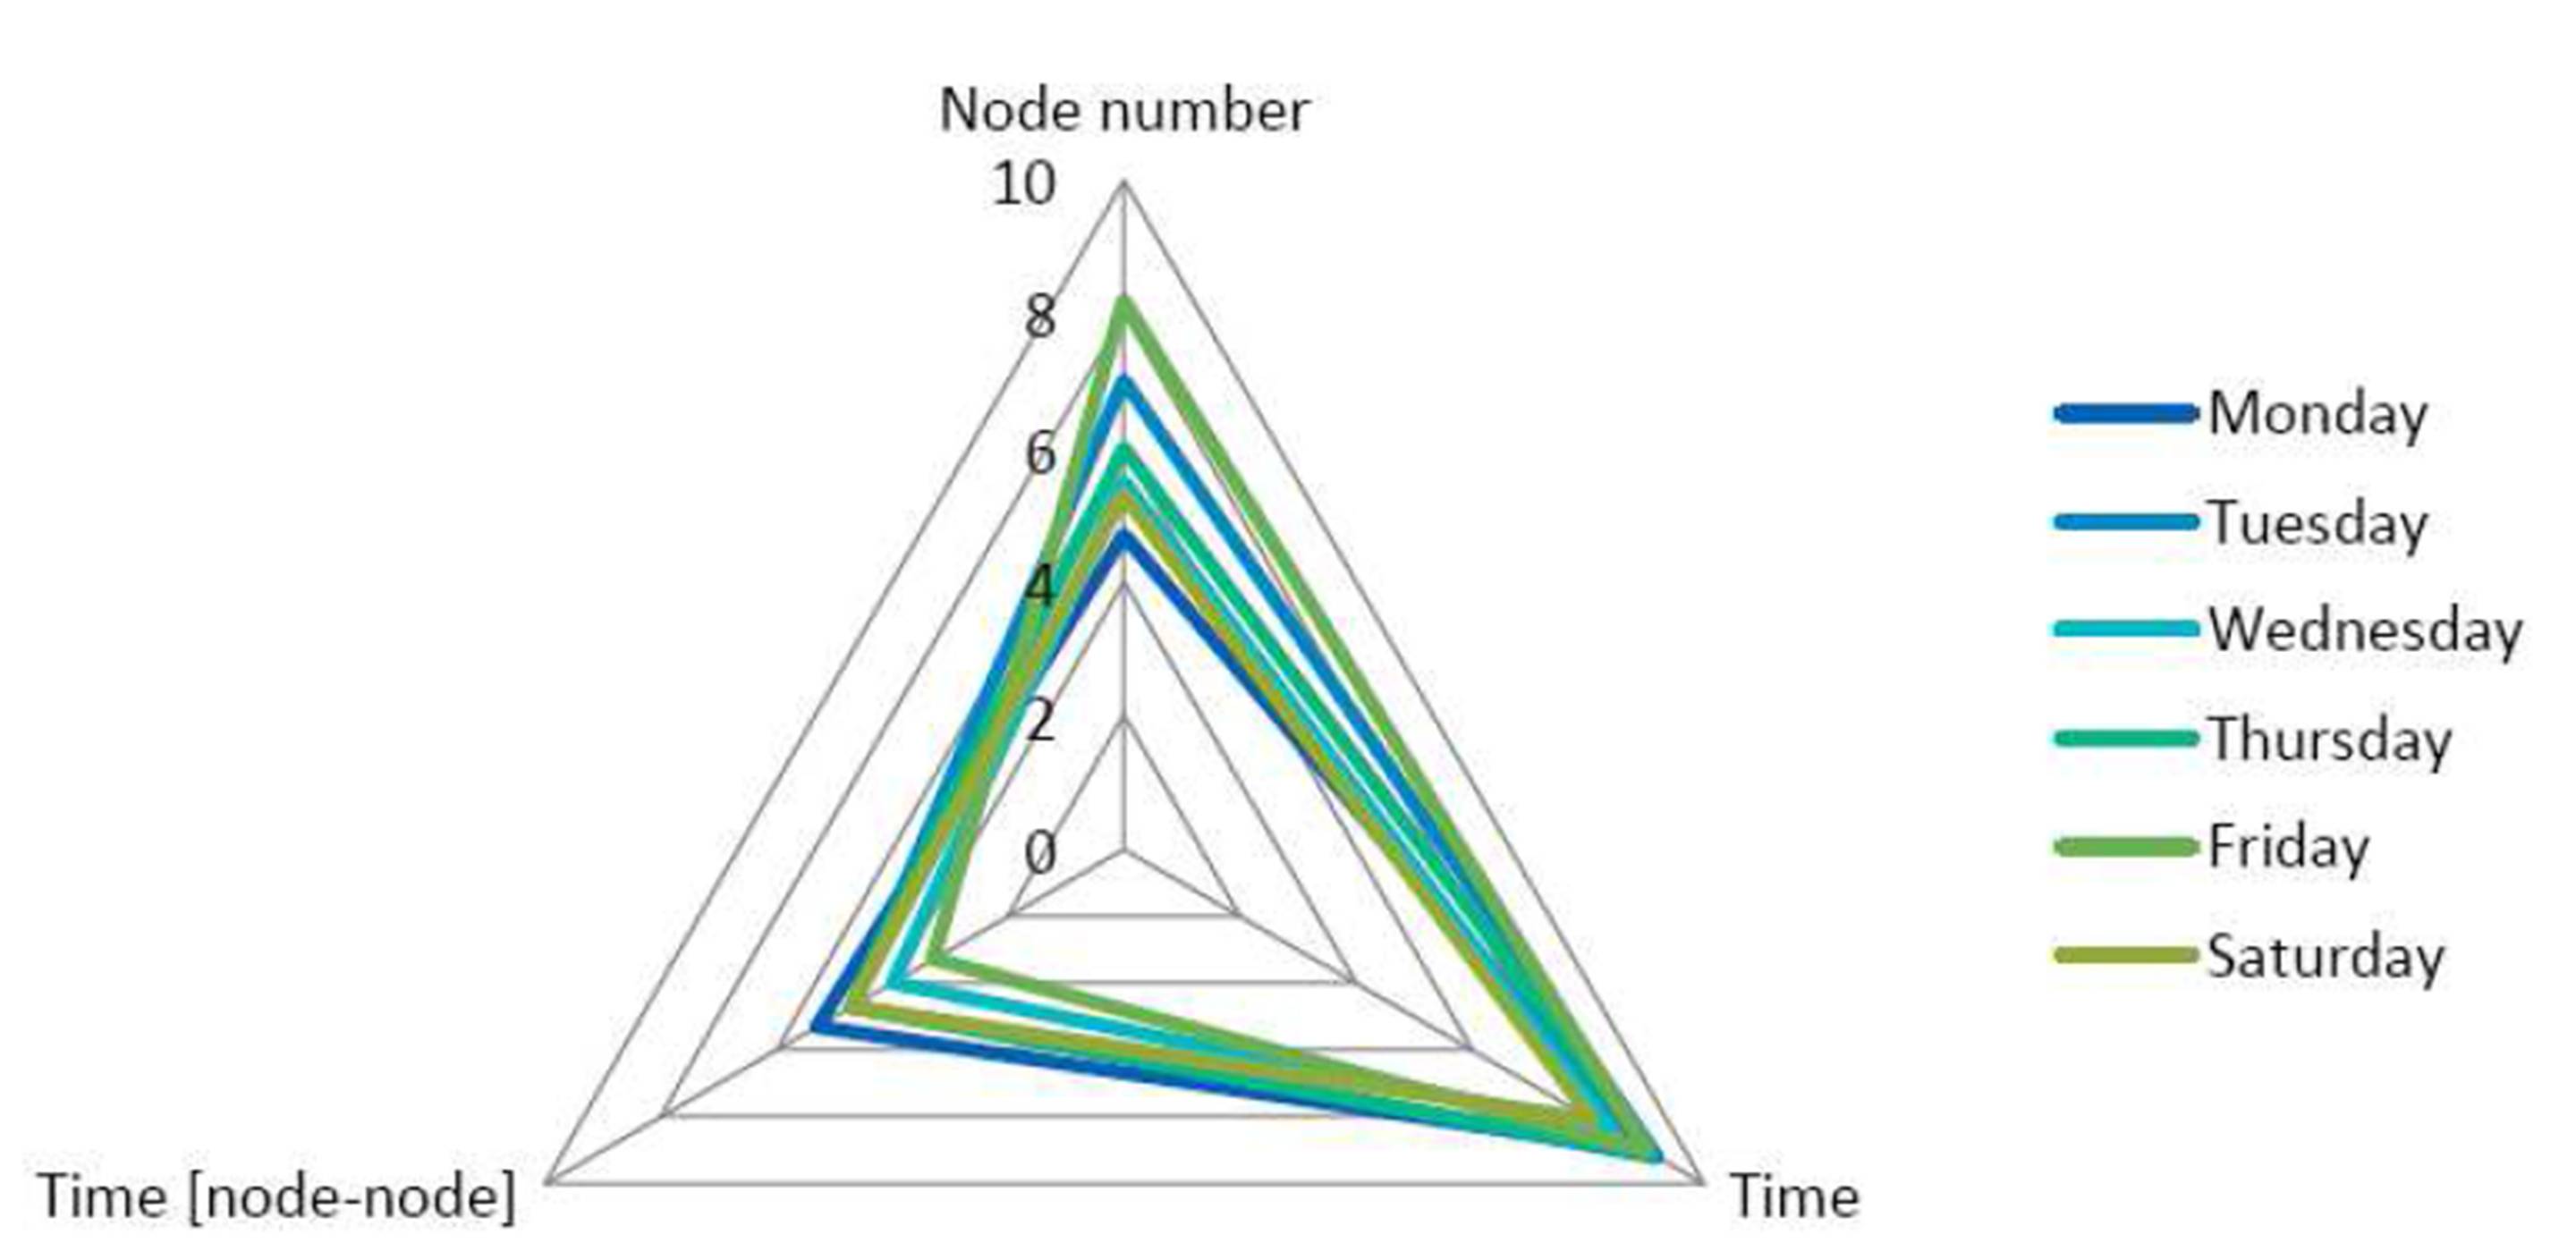
Figure 6: VRP-TW Evaluation (1)
The previous figure is divided into two groups:
A group of curves (Monday, Tuesday, Wednesday, Thursday and Saturday) having a long time to accomplish a common demand orders for short distances. Those curves represent the urban areas, characterised by a high traffic levels.
A unique curve (Friday), representing the non-urban area, which is characterised by a low traffic level.
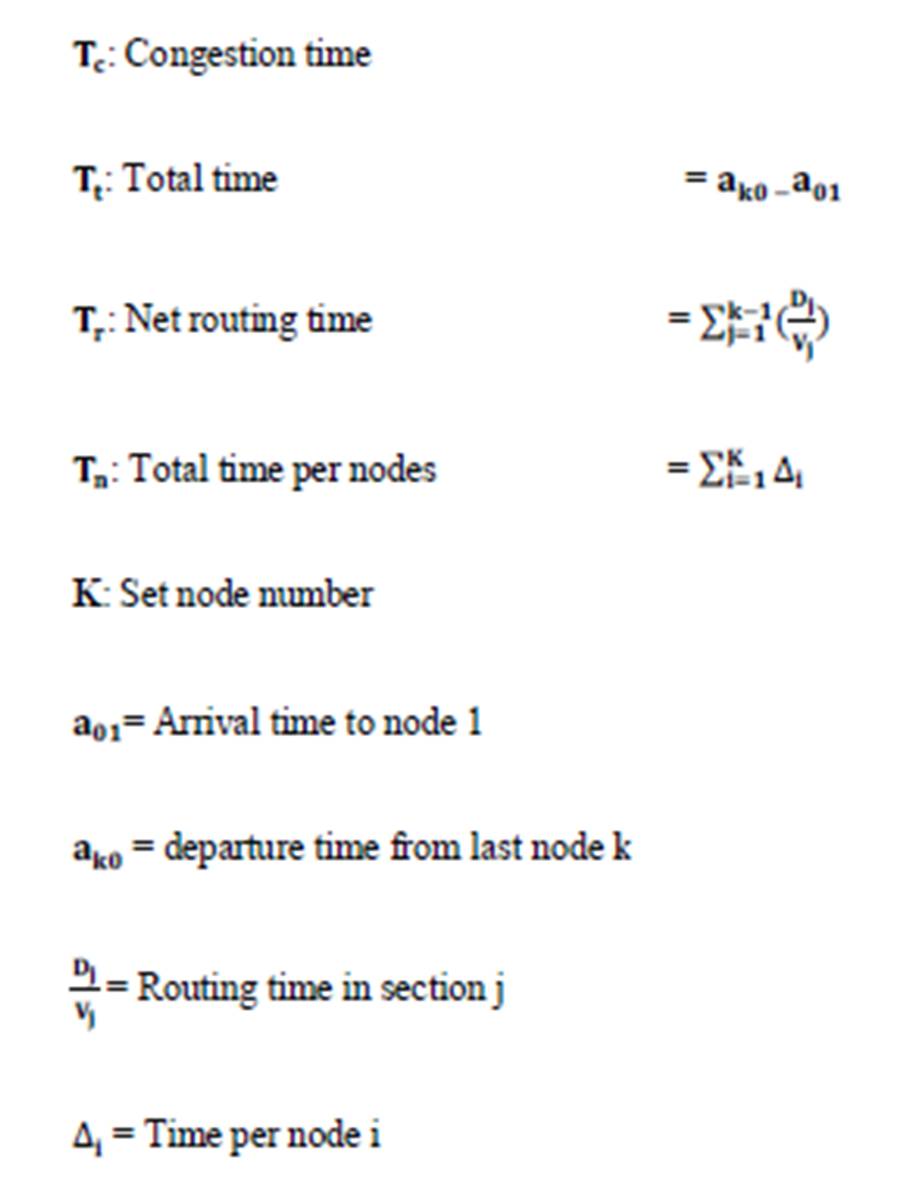
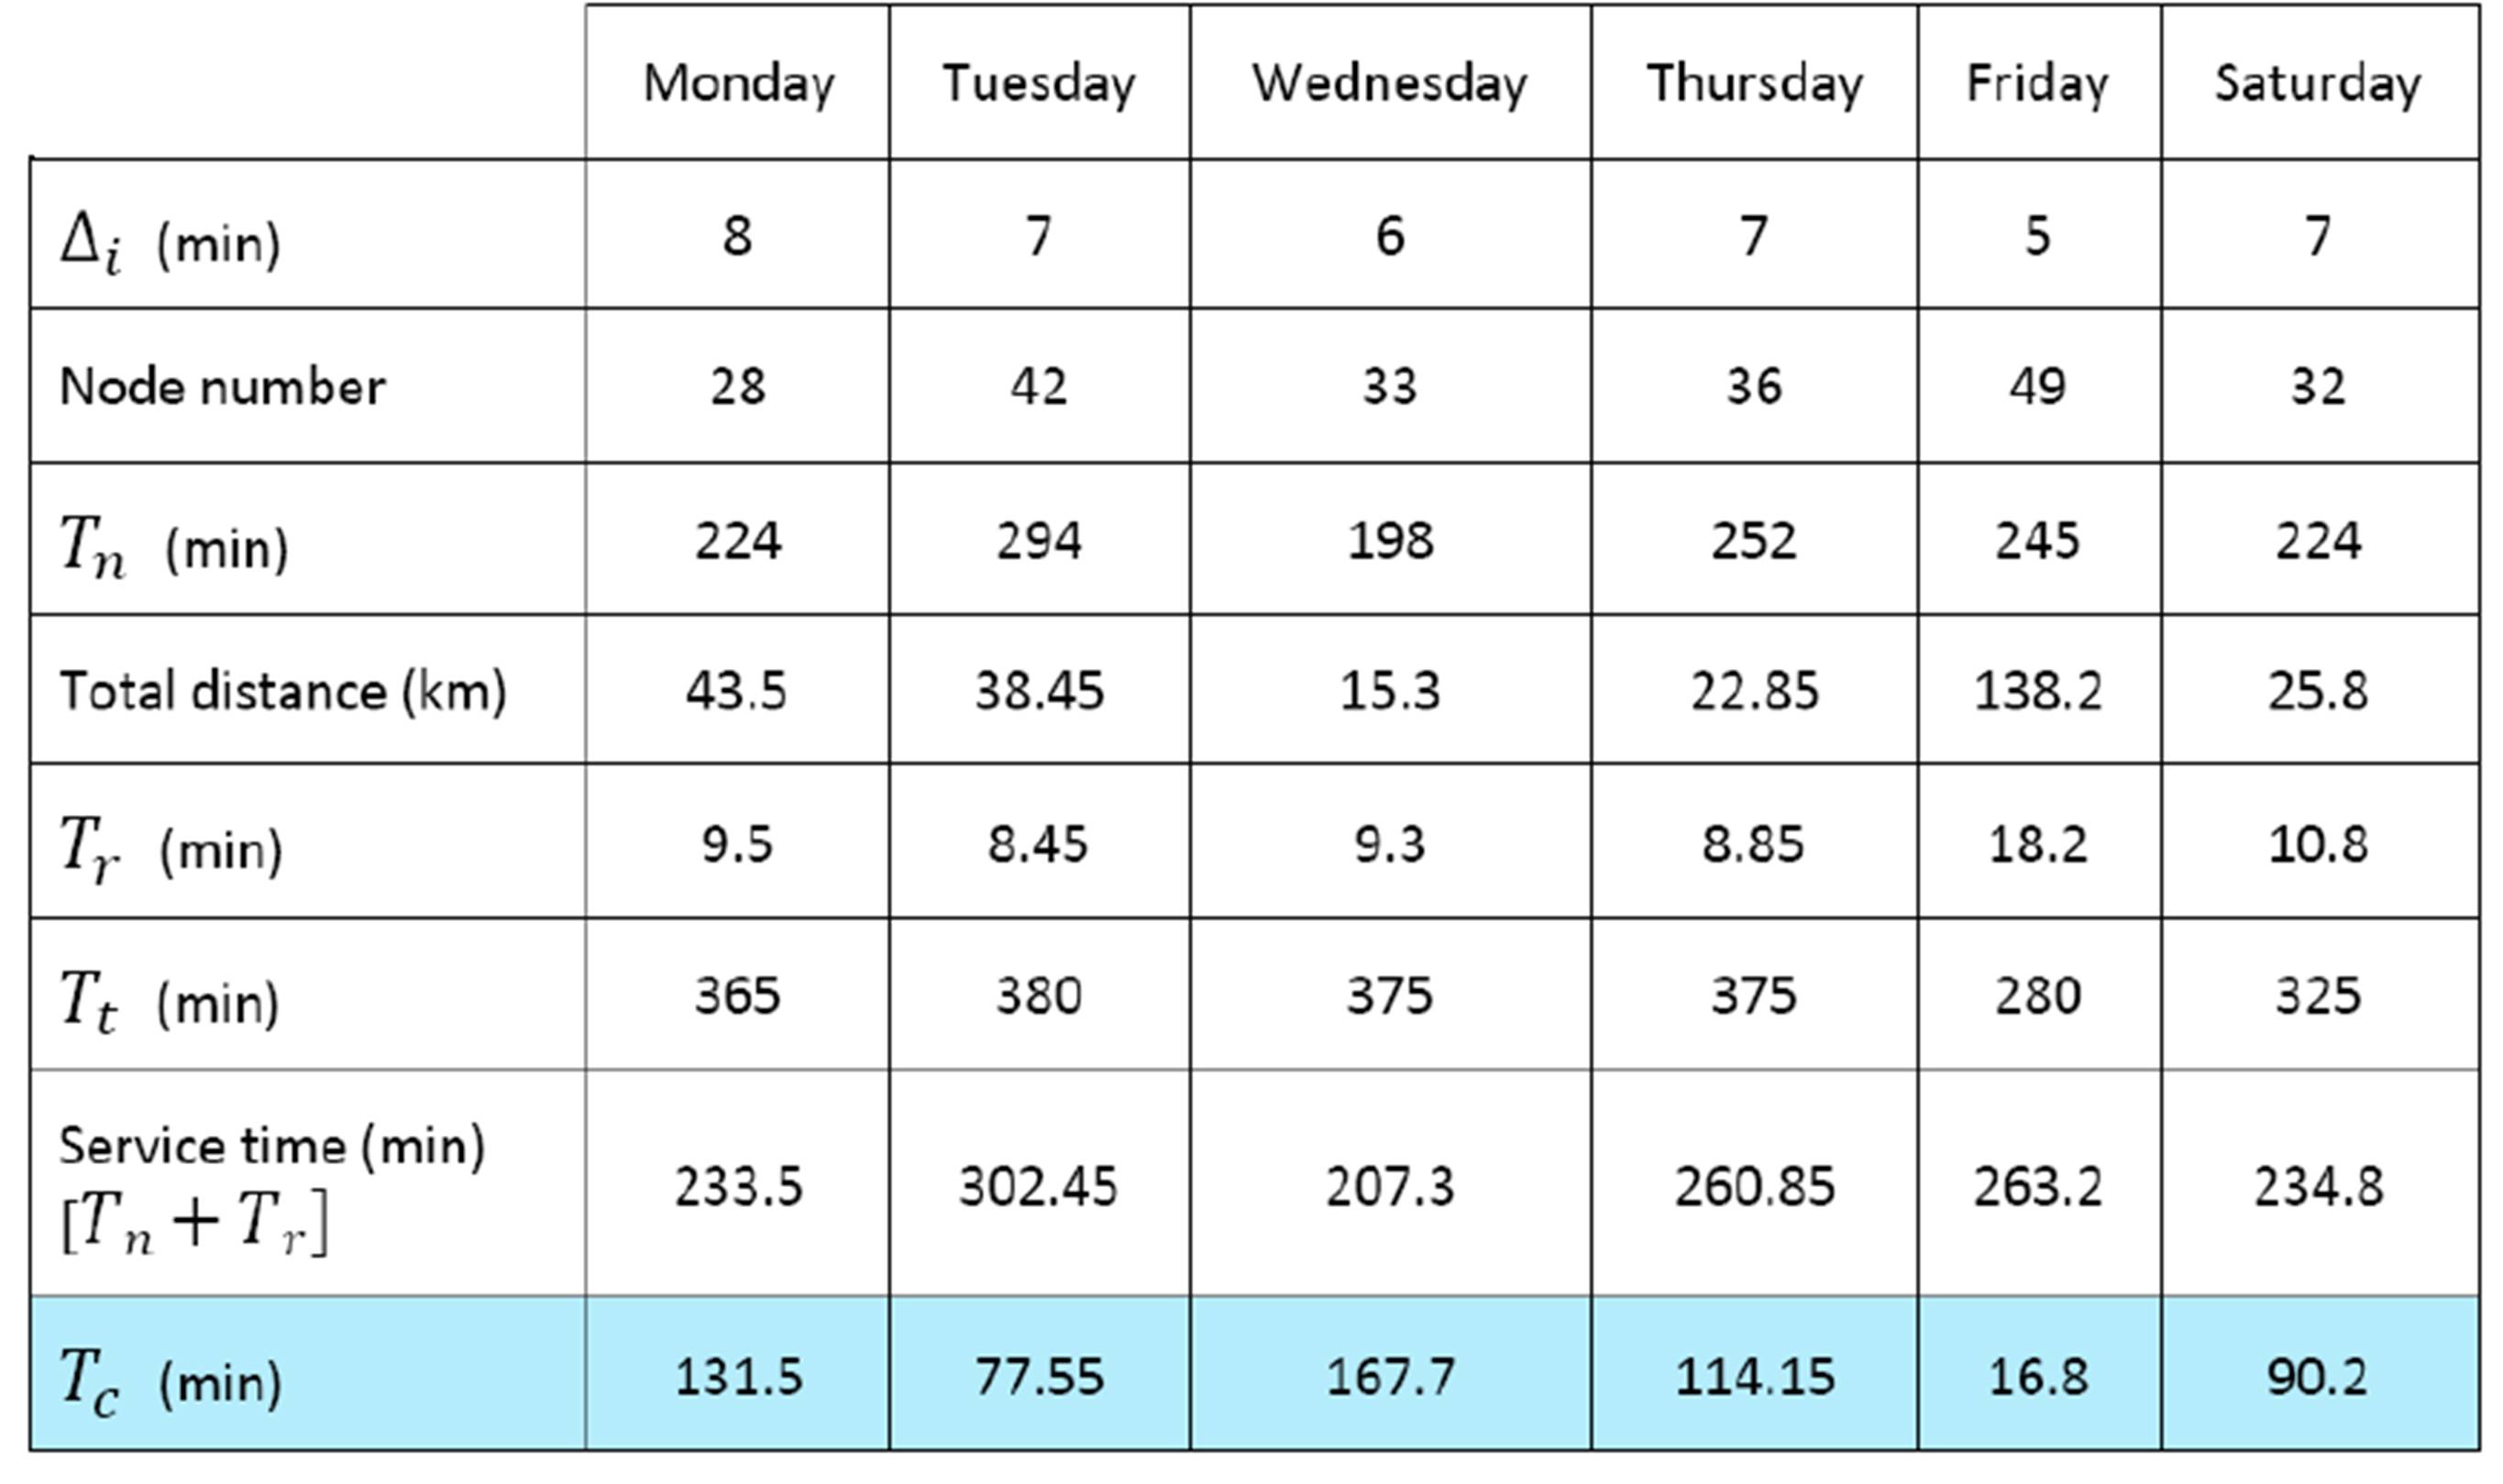
The VRP-TW is evaluated to quantify the traffic congestion according to general routing condition. So, it is measured in a partition of time according to the following equation:
The previous diagram (Figure 5) represents the “marketing” features which do not illustrate the main effects of traffic congestion. So, we have to define new parameters that enable us to determine the real measure of traffic congestion. Therefore, using a decimal-scale; in a first step we represent the routing parameters in order to demonstrate the performance of each schedule (Figure 6). In a second step we represent the time parameters (Figure 7) to reveal the traffic congestion effect.
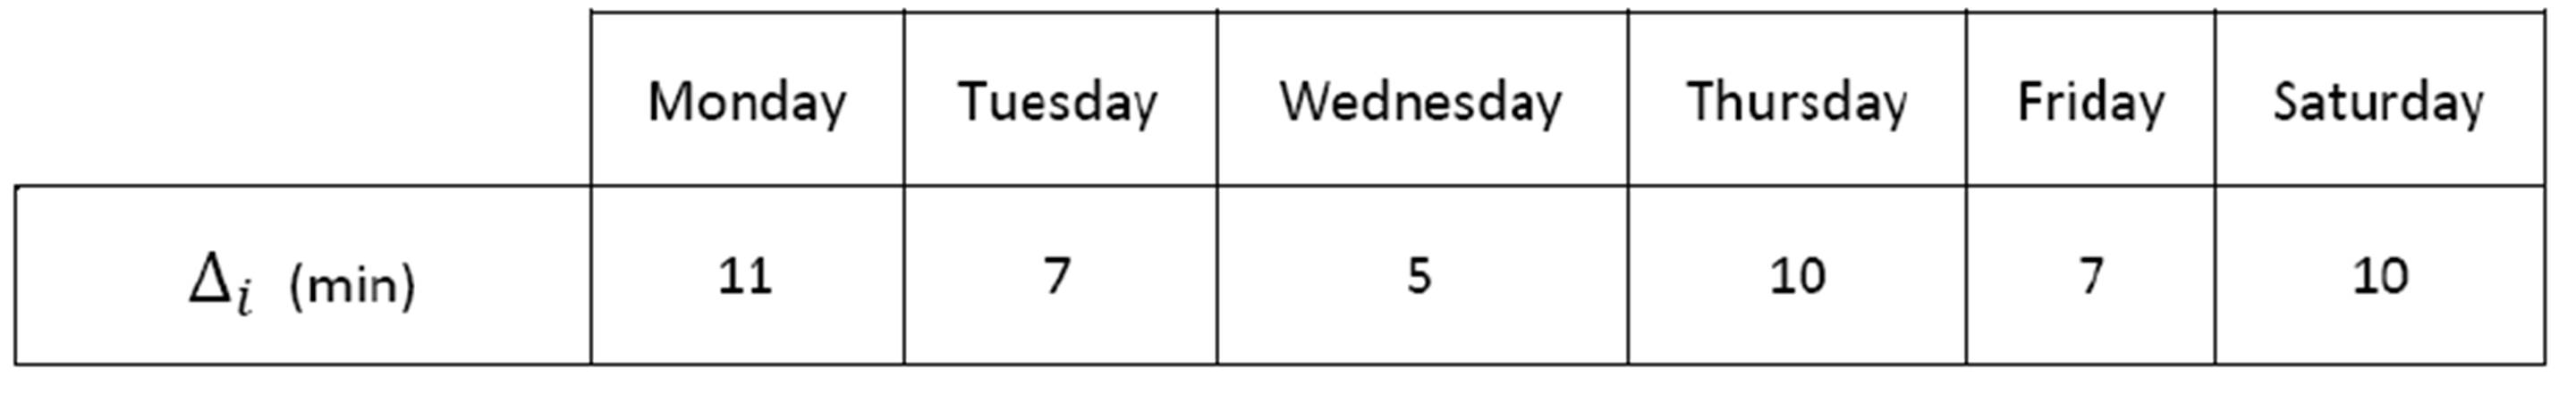
The mark-scale is computed as follow:
* Node number: Max = 60 Node/day = 10/10; 6 node = 1/10.
* Time: work time: 8 hours/day = 480 min/day = 10/10; 60 min = 1/10.
* Time [node-node]: Max = 15 min [node-node]; X= (15-Tn-n / 15)×10
Vj = 60Km/h = 1Km/min
Figure 7: VRP-TW Evaluation (2)
Time [node-node], associated with node number, reveal the impact of congestion in vehicle routing schedule.
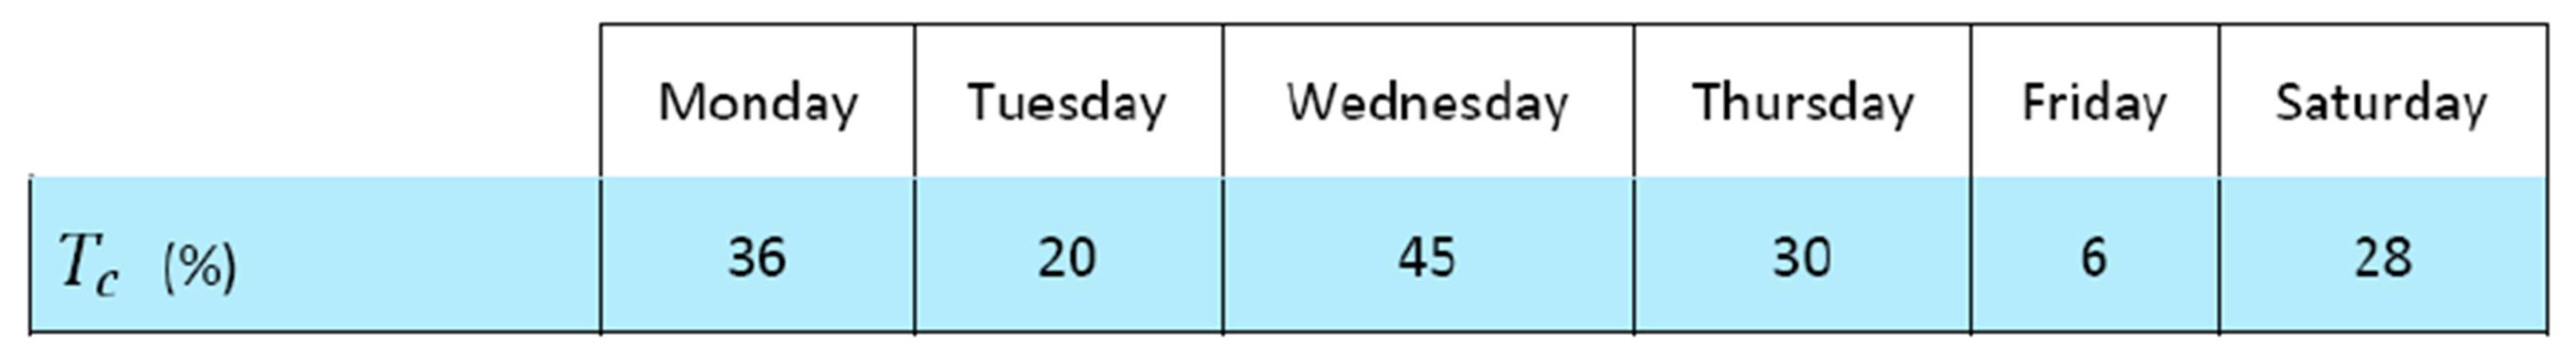
As it can be seen, there is a big difference between the different areas in congestion time. Also, we note that the least congestion time corresponds to the non-urban area (served on Friday). The region served on Wednesday is an urban region characterized by an important industrial activity and the impact on congestion time is obviously clear.
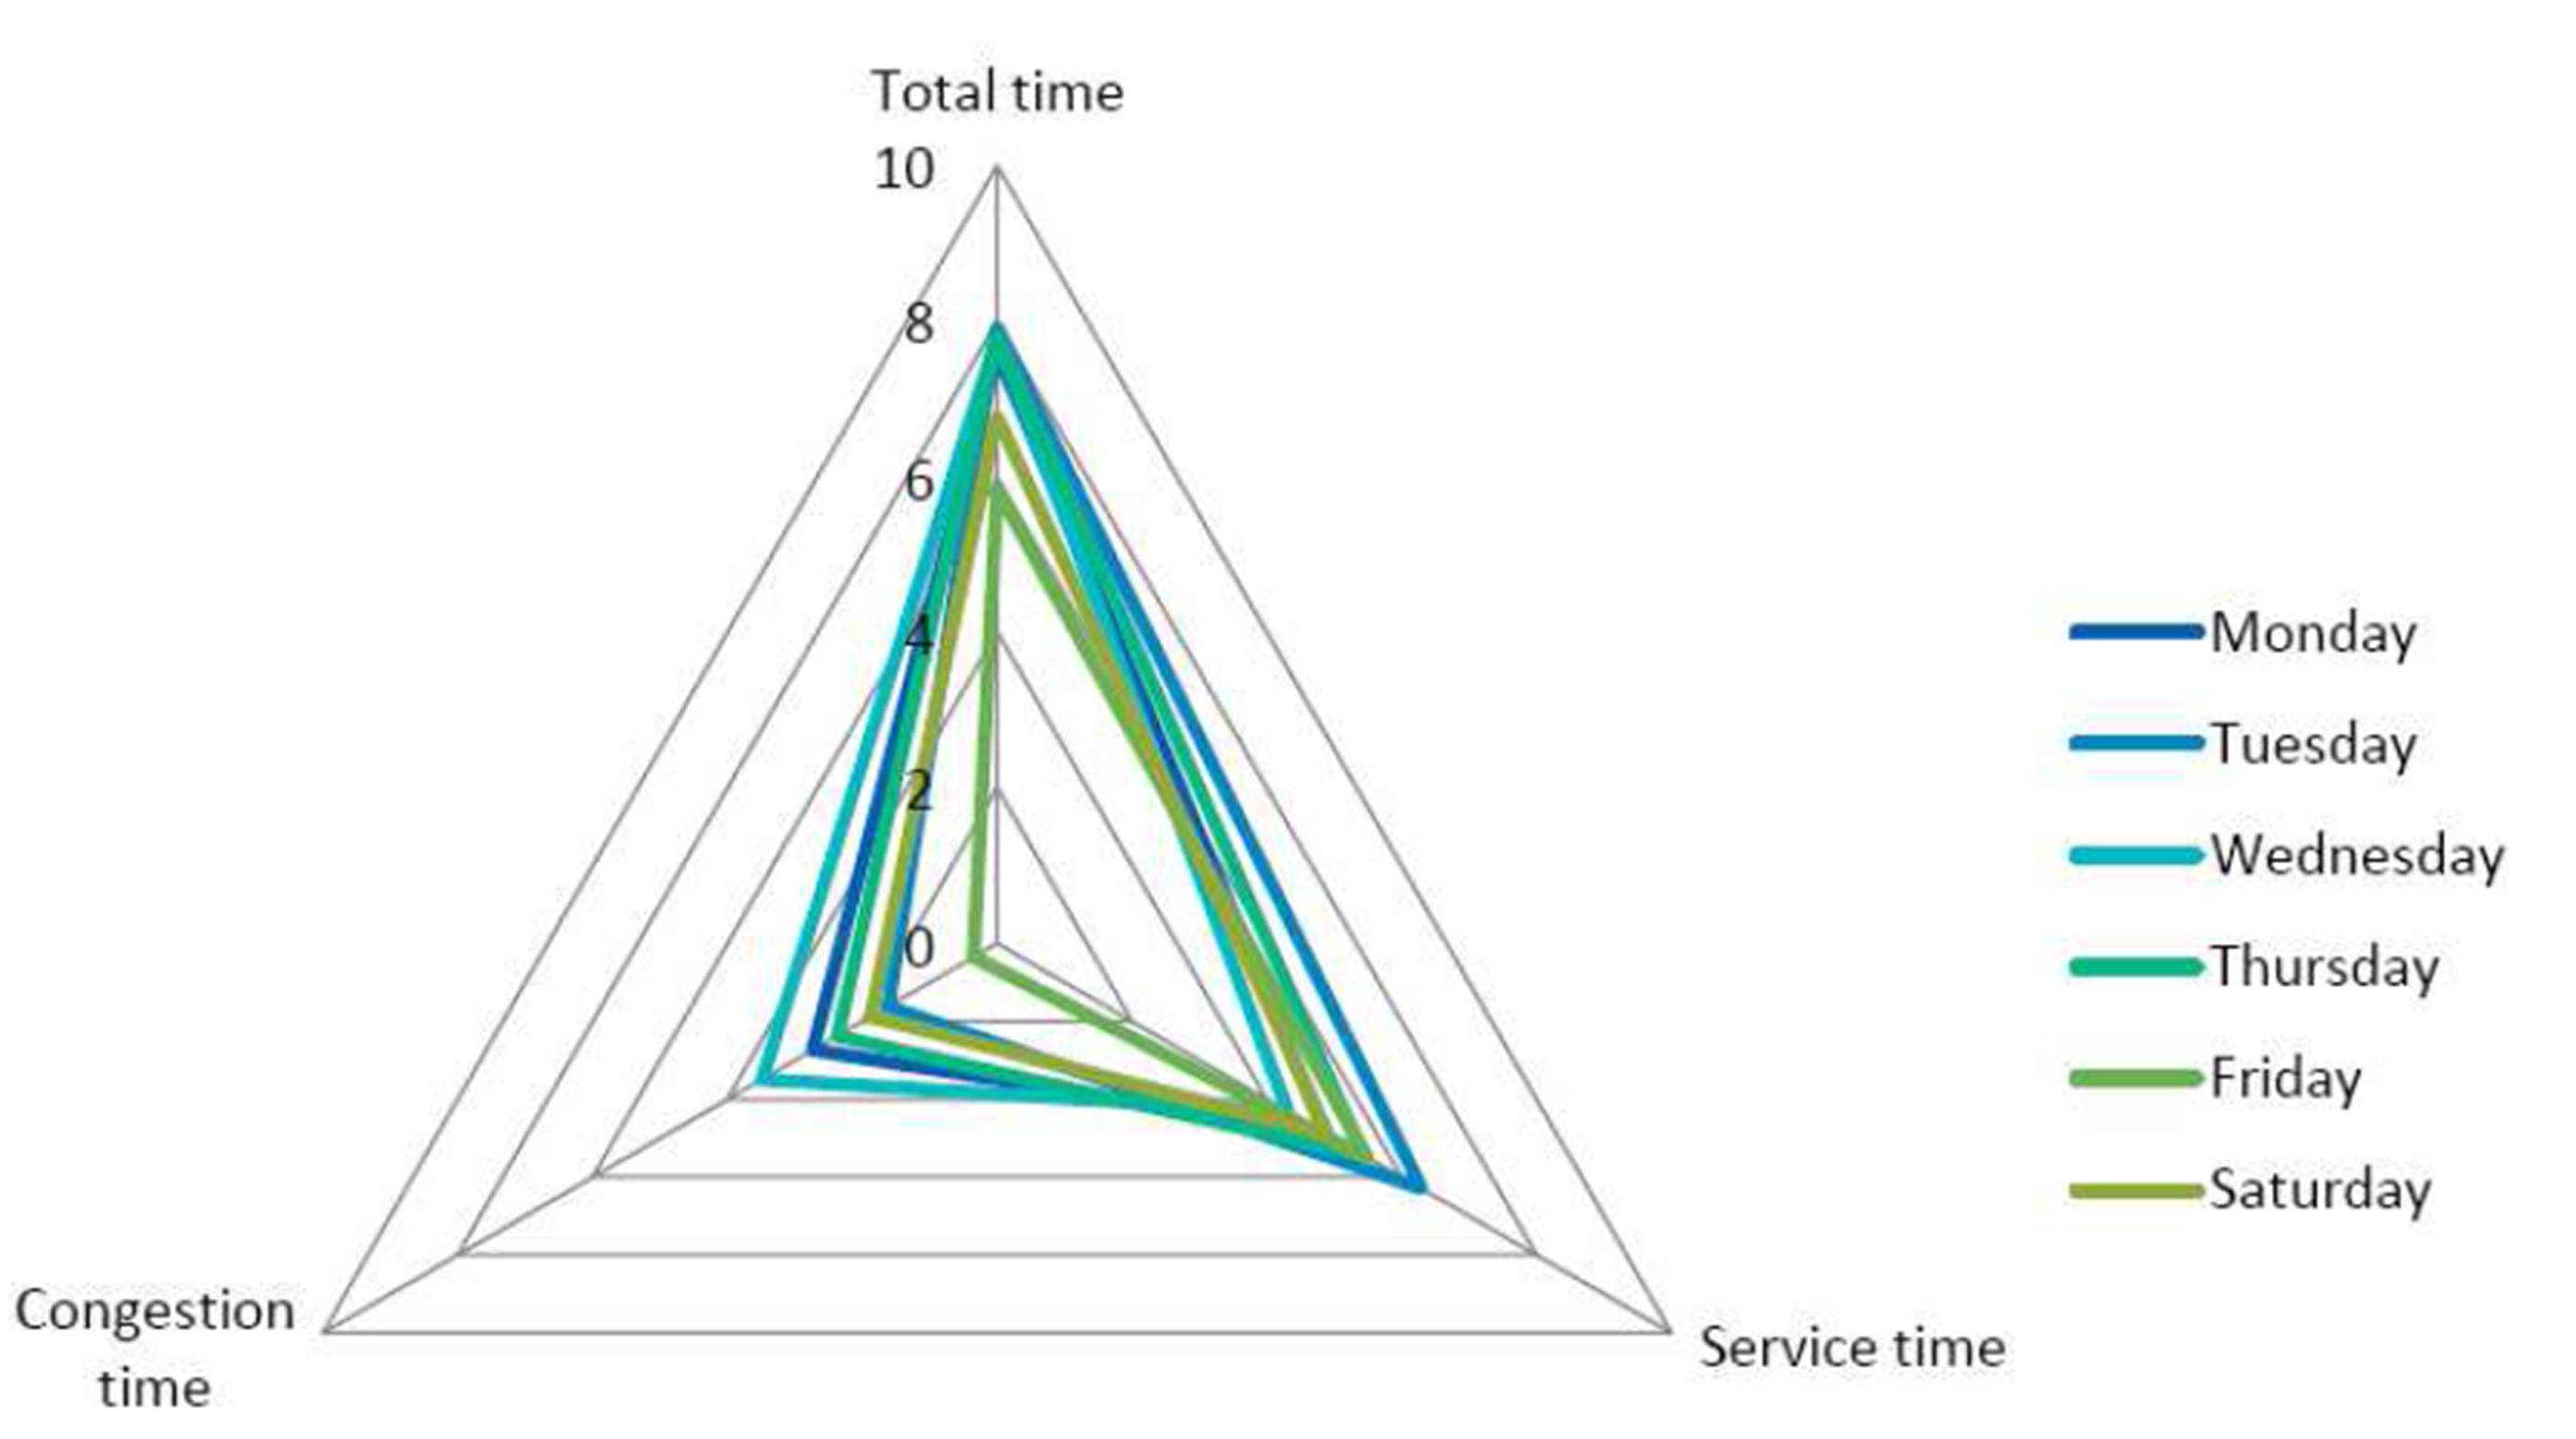
Figure 8: VRP-TW Evaluation (3)
The congestion level is clearly different between different areas in the same region. It is considered high level in the zone served on Wednesday (40% = high level). Therefore, the implementation of urban logistics tools and approaches could be limited to some areas and not all the regions.
But, improving the supply chain has to be taken from a holistic vision so as to develop the entire transportation system.
Conclusion
In this paper, we have evaluated the environmental impact and traffic congestion which is considered as a supply chain risk factor.
We may conclude that the traffic congestion is an important risk in the transport system and has a dangerous impact on the infrastructure use.
The model proposed can be tested in other contexts such as emergency activities or simple citizen use for the distribution activities.
(adsbygoogle = window.adsbygoogle || []).push({});
References
(Bemmel, J.H, 2000) Bemmel, J.H, (2000). Optimization Problems in Supply Chain Management. Thesis the erasmus university rotterdam on the authority of the rector magnificus
(Blanco, H et al., 2009) Blanco, H., Alberti, M., Forsyth, A., Krizek,KJ., Daniel A., Talen, E and Ellis guez, C. (2009). ‘Hot, congested, crowded and diverse: Emerging research agendas in planning’. Progress in Planning 71 (2009) 153—205.
Publisher – Google Scholar
(Gonca, T et al., 2010) Gonca, T., et Gulgun, A. (2010). Risk assessment and management for supply chain networks: A case study. Computers in Industry 61 (2010) 250—259.
Publisher – Google Scholar
(Guiffrida, AL et al., 2006) Guiffrida, AL and Rakesh, N. (2006), ‘Cost characterizations of supply chain delivery performance’. International journal of production economics 102 (2006) 22-36.
Publisher – Google Scholar
(Gunasekarana, A et al., 2008) Gunasekarana, A, Kee-hung, L. and Edwin Cheng, T.C. (2008), ‘Responsive supply chain:Acompetitive strategy in a networked economy’. Omega 36 (2008) 549 — 564.
Publisher – Google Scholar
(Iwan, V et al., 2009), Iwan, V., Suhaiza, Z. et Nyoman, P. (2009). Supply Chain Risk Management: Literature Review and Future Research. 16 International Journal of Information Systems and Supply Chain Management, 2(1), 16-33, January-March 2009
Publisher – Google Scholar
(Jianxin, X, 2008) Jianxin, X. (2008). Managing the Risk of Supply Chain Disruption: Towards a Resilient Approach of Supply Chain Management. 2008 ISECS International Colloquium on Computing, Communication, Control, and Management.
(Kissani, I, 2008) Kissani,I .(2008),’ A Contribution to supply chain design under uncertainty’. Thesis Laval University Québec. 2008
(Lu, S, 2011) Lu, S. (2011). Research on Supply Chain Risks Management by Simulation Analysis. Proceedings of the 7th International Conference on Innovation & Management.
(Melnyk, S et al., 2006) Melnyk, S. A, Lummus, R, Vokurka, R.J and Sandor, J.( 2006), ‘Supply chain management 2010 and beyond: Mapping the future of the Strategic Supply Chain’. A report
(McKinnon, A et al., 2008) McKinnon, A, Palmer, A, Edwards, J and Piecyk, M. (2008), ‘ Reliability of Road Transport from the Perspective of Logistics Managers and Freight Operators’. Final report by Logistics Research Centre Heriot-Watt University Edinburgh, UK.
(Moustakbal, A, 2009) Moustakbal, A, (2009). ‘L’impact de la congestion routière sur l’industrie du camionnage dans la région de Montréal’. Memory
(Peck, H et al., 2003) Peck,H, Abley,J, Christopher,M, Richard Saw,M.H , Rutherford,Ch and Strathern,M.( 2003),’ Creating Resilient Supply Chains: A Practical Guide Report produced by the Centre for Logistics and Supply Chain Management’, Cranfield School of Management. 2003.
(Rossi, T et al., 2006) Rossi,T., Caridi,M., Noé,C., Sianesi, A. (2006)’Analyzing and assessing operational risk in supply chain through petri nets and similation techniques’, RIRL, 2006, sixth international congress of logistics research.
(Simchi-Levi, D et al., 2000) Simchi-Levi, D, Kaminsky, P and Simchi-Levi, E. (2000), ‘Designing and managing the supply chain : concepts, strategies and case studies’. Second edition (book)
(Tang, O et al., 2010) Tang, O and Nurmaya, S. M. (2010), ‘Identifying risk issues and research advancements in supply chain risk management’. International Journal of Production Economics (2010).