Opole University of Technology, Faculty of Production Engineering and Logistics, Opole, Poland
Volume 2020,
Article ID 831308,
Journal of Innovation and Business Best Practice,
25 pages,
DOI: 10.5171/2020.831308
Received date: 15 April 2020; Accepted date: 27 July 2020; Published date: 21 September 2020
Academic Editor: Marek-Kolodziej Katarzyna
Cite this Article as:
Ewa Kulińska, Dariusz Masłowski, Małgorzata Dendera-Gruszka, Lilianna Wojtynek and Konstanty Szeląg (2020)," Production Automation as A Factor in Improving Product Quality in The Automotive Industry", Journal of Innovation & Business Best Practice, Vol. 2020 (2020), Article ID 831308, DOI: 10.5171/2020.831308
The automation of production is an important element in the functioning of any production enterprise. The aim of this article is to analyze the quality of the product made manually with the use of spot-welding machines and to analyze the quality of the product made by the industrial robot type “Fanuc Robotics S-420i”. The analyzed product was the front panel of the body, made of semi-finished products in the spot-welding process. During the analysis, the impact of production automation on the product quality was found. Applications of the robotized welding process are used not only because of better quality parameters, but also because of the significant reduction of production costs and less fatigue of employees. The robot operator is a quality controller and contributes to quality management.
Keywords: Production Automation, Product Quality, Industrial Robots
Introduction
The quality of products delivered to the market is currently determined and assessed by an increasingly demanding customer, forcing companies to increase the effectiveness of their operations (Abramson, 1999). The customer often demands diversified products, fulfilling many functional and safe functions even in extreme conditions. Among such competitive criteria as cost, flexibility, speed, reliability and quality, quality is becoming a priority. Many questions arise in the modern world such as: What are the benefits of the automation of production in this respect? Is automation necessary for companies? Will the manual work be a thing of the past? and Why do people want robots to replace their work?
The modern economy operates in the industrialised, technical and technocratic world, where it seeks to make robots work for people – and people will only manage them (Borczyk, 2003: 14-15). Robots will do hard work for people, and they can do other things. However, will the robots do it right? Will it be a qualitatively more reliable product? Surely, robots are more efficient, more resistant to fatigue and faster, but will they improve the product quality? Doesn’t the manual work seem more accurate, qualitatively better and more precise? These and other questions are answered in this work. It wasn’t the quantity, productivity or production costs that were the subject matter of the work, but the quality of the product, a specific product for the automotive industry – before and after automating the workplace (Bigvand, Fay 2017).
In practice, robotics is used in many economic locations including the agricultural industry (Lowenberg-DeBoer, Huang, et al. 2020), and it also affects the way employees are employed (Daron, Restrepo 2019). Therefore, no matter where automation is applied, it is important that it usually has positive effects on the economic growth (Alpeeva, Volkova 2019).
The product described is not a decoration, but it is a part of a car body intended for the automotive industry. So, the most important thing here is the quality of durability and reliablity, which affects our health and life. Improvement in quality is noticeable in Japan. Newer industrial robots are used in production, not only to improve productivity, but also quality (Panchev, 2017: 484-487). Robots produce machines and machines produce goods. Man, as a consumer evaluates the quality of products and tries to improve it, by improving the machine rather than directly affecting the product. (Witting, 2005).
A modern organisational unit bases its market competitiveness and survival in the market on an information system in which information determines, among other things, the efficiency of logistics management and is the driving force behind the logistics strategy. The information needs have led to the creation of an information system that provides continuous access to up-to-date, accurate and truthful information. An information system includes information resources and those elements which enable the power supply, maintenance and provision of those resources to the user. An information system in which information technology is used to acquire, collect, process and transmit information is called an information system (Knapiński, Pietras 2017).
In order to get the most out of these technologies to significantly accelerate the development of manufacturing companies and increase competitiveness in the global market, a new paradigm is being discussed worldwide. Industry 4.0 or the fourth industrial revolution are just some of the terms used to describe the phenomenon of the extensive implementation of intelligent devices in production lines that can communicate autonomously along the value chain (Dendera-Gruszka, Kulińska 2018). In this approach, machines and programs collect information on an ongoing basis to automatically improve their configuration and provide valuable indicators and calculations to help employees make quick decisions and deliver better quality goods and services. Industry 4.0, in technological terms, is a group of modern and developing technologies which are the basis for the changes currently taking place in the manufacturing industry (Graham, Burns et al. 2019). Previously, companies used preventive maintenance methods and rules for servicing machines at regular intervals or reacted when a breakdown occurred. A predictive maintenance method can be used in a factory equipped with intelligent technologies (Kubińska-Jabcoń, E. & Niekurzak, M. 2019).
The aim of this work was to compare the quality of the product made by hand spot welding machines with the product made by the industrial robot “Fanuc Robotics S-420i”. The product was a car body front panel, made of semi-finished products in the spot welding process. The research methods used in this work were: observational methods, methods of analysis and logical construction and comparative methods. The research was carried out in the Opole automotive company in 2017-2019.
Methodologies for Quality Measurement
Reliability assurance is a series of activities that ensure that the product reliability requirements are realised in a product life cycle. However, since the reliability assurance activities are usually only implemented in design and usage, the integration of reliability assurance with quality control in production has not attracted the attention it deserved, thereby hindering the production performance improvement to satisfy increasingly stringent customer requirements (Yihai, Changchao & Zhenzhen, Jiaming 2018).
The first difference between quality assurance and quality is the difference in the importance for the customer. High quality should, in the customer’s understanding, be associated only with his full satisfaction with the purchased product (service) and entail other benefits such as: (Dahlgaord, Kristensen, Kanii 2001: 26) reliability, speed of service (delivery), appropriate price/goods ratio, warranty, etc. As regards to the concept of quality assurance, it is possible to talk about the customers’ (recipients’) trust in a given company, brand or type of product (so-called steel or loyal customers). The second difference – when using the concept of quality, we always refer to a specific product, good, service or contract. While quality assurance usually refers to the company or the plant – generally the organisation. The third difference – the highest goal for quality is to produce only good, compliant products – a requirement that generally stems from the previous differences, i.e. achieving the goal: “zero errors”, “zero defects”. The highest objective for quality assurance is the state of a well-organised organisation, i.e. “no conflicts”, where employees will be satisfied with their work both materially and immaterially (the need for respect, self-fulfillment, being in a group, achieving success, etc.). In order to be able to realize such an ambitious task set for the company, which is management through quality, one should take a serious interest in the implementation of the quality assurance system according to the international ISO 9000 series standards (Doroszewicz, 2002). Although these are not obligatory standards, they are becoming more popular in Poland, where since 1990, about 1000 certificates confirming the compliance of the quality assurance system with the chosen model of the standard have been granted. The collection of ISO 9000 series standards constitutes a series of standards that can be divided into those related to internal quality assurance (ISO 9004 family) and external quality assurance: ISO 9001, ISO 9002, ISO 9003. The ISO 9000-1 standard, as a basic standard, is a set of guidelines to facilitate the selection of the right model for a quality system in a particular company (Ciepiela, Kozioł 1978).
In the last years of the 20th century, societies of technologically and civilizatically developed countries have been experiencing radical changes, referred to as the global information society or the “third wave” society. From the economic point of view, new technologies are of particular importance, especially information technologies (computerisation, automation and global information networks eliminating the distance barrier, knowledge is becoming the main production factor). The problem of the ownership and supervision of knowledge, which is the main “device” and the driving force behind the development of societies, has become important. New knowledge-absorbing organisations are emerging and centers of economic attractiveness are moving towards places such as the “Silicon Valley”. Beside capital and labour, information is one of the most important factors of production, . The growing importance of knowledge, which is becoming the most important factor of the new order, has led to the identification of the so-called knowledge-absorbent sectors of the economy. Radical restructuring has begun. Traditional and non-organic sectors are disappearing and new types of industrial production (computer, electronic, biochemical, aviation) are emerging (Gołębiowski, Janasz, Prozorowicz 2002: 192).
The growing importance of knowledge is particularly evident in natural sciences (new discoveries in astronomy, physics, mathematics, biology or chemistry) (Mas-Tur, Modak 2019). Knowledge as a production ingredient has led to the fact that white-collar workers are the most important in a company: scientists, engineers, technicians, programmers and managers (Ivanov, Das, Cho 2018).
The choice of the model of the quality system should depend on the functional and organisational capacity of the company in relation to the manufactured products or services. The basis for building such a system may be the requirements of one of the models of quality assurance systems as follows:
a) ISO 9001 – model of quality assurance in design, development, production, installation and service. The quality assurance system is appropriate for companies offering products, which are created in this organization from design, through the production cycle to service, b) ISO 9002 – model of quality assurance in production, installation and service. The model covering quality assurance in production, installation and service of a company (no design or construction element), c) ISO 9003 – Model for quality assurance in final inspections and tests, d) ISO 9004-1 – serves the so-called internal quality management. It contains basic assumptions for the implementation of the quality system understood as: “organisational structure, distribution of responsibilities, procedures and resources enabling quality management”.
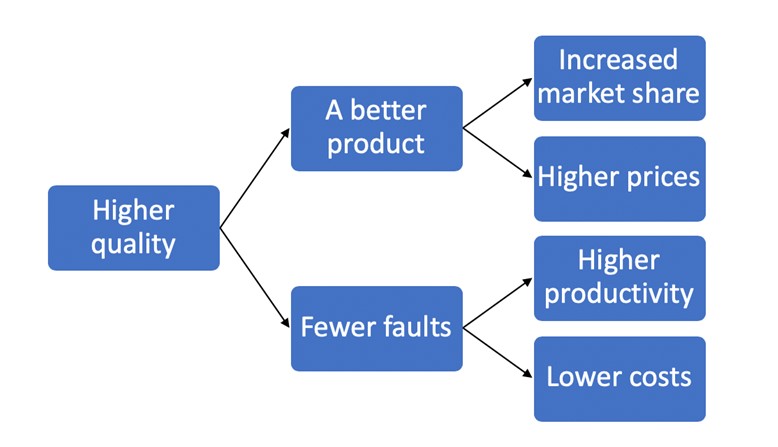
This standard attribute a particular importance to the management’s declaration to the quality policy: it defines the necessity of involving all employees in the quality development process. “We are at the beginning of a new era of human development – the age of quality. The process of its creation is accelerating and irreversible”. The higher the quality, the greater the benefits for the company, and thus the fewer the faults, the higher the productivity (Figure 1 illustrates some of the benefits). A satisfied customer “returns”, which gives the company a competitive advantage (Fiorino, Barone, et al. 2019).
Fig.1: Some benefits of quality management [own study]
Maintaining Product Quality
Maintaining the quality of a product is an integral part of the quality science of product durability from the moment it is manufactured to the end of its use. It includes technical, technological and organisational measures to achieve the objectives during storage, transport and use of goods. It is based on explaining the mechanisms of changes taking place in products, i.e. aging and spoilage of stored goods and developing methods to counteract these phenomena (Kulińska, Masłowski 2018). The notion of quality assurance is formulated in the PN-ISO-8402 standard as “systematic and, if necessary, proven activities carried out under the quality system to arouse appropriate confidence that the facility will meet the quality requirements”. Thus, it is a modern field of science and technology involving the preservation of the initial quality of products obtained from natural resources, produced during the industrial process or obtained as a result of an agricultural activity in order to extend their desired properties over time (Waluya, Iqbal 2019). The possibilities of the modern technology allow for the production of huge quantities of material goods. High efficiency of the production of industrial products, regionalisation and specialisation in lowering production costs require that these products, while waiting for possible further processing or delivery before they reach the final recipient,must be in conditions that maintain their initial properties at least during the guarantee period. Currently, technologists have at their disposal highly efficient technologies and air conditioning devices, effective preservation methods, as well as excellent packaging materials, thanks to which there are possibilities to slow down the operation of product degradation mechanisms.
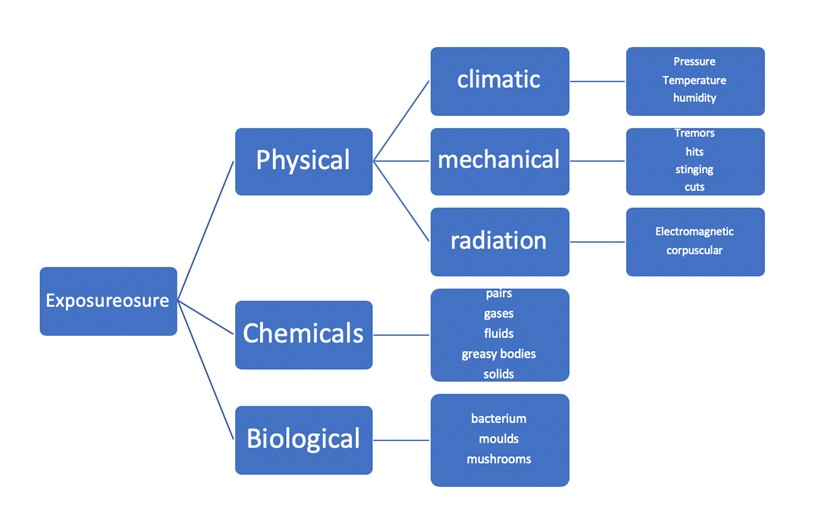
Each product has specific characteristics and is sensitive to specific factors. These characteristics can be called the sensitivity of the product. On the basis of the sensitivity of the product to external and internal factors, it is possible to determine the exposure against which the product should be protected. The physical, chemical and biological exposures are shown in Figure 2. However, only the sensitivity of a product to physical, chemical and biological exposure cannot establish a complete list of exposures against which the product should be protected. This is due to changes in product properties and external conditions as well.
Fig. 2: Distribution of exposures acting on the product [own study]
Indeed, the exposures described may have a negative impact on the product, but when analysing them carefully, it is not difficult to see that the same factors that adversely affect the quality of the product are often used to prolong its shelf life. Pressure (negative pressure), temperatures (both negative and positive), radiation (infrared, ionizing, ultrasound) and gases – all of which, depending on the values and conditions, can be used for maintenance or product quality parameters (Witting, 2005).
Comparative Analysis
The company, located in Opole, belongs to a global automotive company with its headquarters in the USA. The company produces accessories and car body parts of well-known and valued brands. The location of production plants is strictly dependent on the company’s strategy, macro- and micro-environment. The company produces in countries such as: Belgium, Brazil, Canada, China, France, Germany, India, Italy, Japan, Mexico, Poland, Slovakia, Spain, Korea and USA. A characteristic feature of the factory is the specialization in which the company “rotates”.
The company mainly deals with metal joining: spot and hump welding and MigMag gas shielded welding. Most technological processes are automated.
The analysis has expanded the description of the technological process of the welding station, which is performed by an operator performing welding with a manual welding machine and industrial robot Fanuc Robotics.
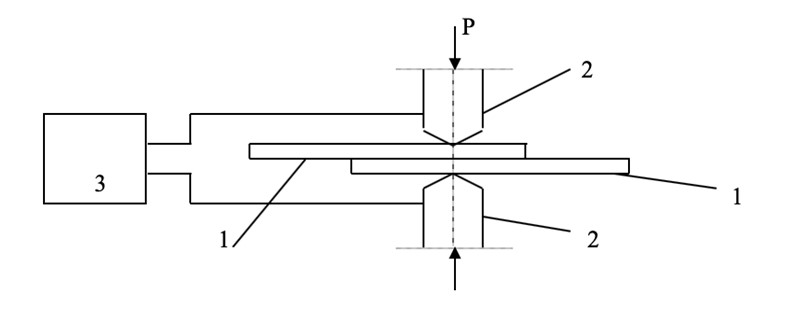
Welding is the process of a permanent joining of elements without adding a binder. It consists of heating up the elements to doughiness and then pressing firmly. The following types of welding are distinguished: electric, frictional, and ultrasonic. In robotics, electric resistance welding is most often used, which, due to the method of obtaining and the shape of the weld (place where the elements are placed), is divided into the following: point welding (the diagram is shown in Fig. 3), hump welding (point welding at the projection points), linear welding, short-circuit welding (strong pressure on the elements to be welded) and spark welding (small pressure providing a current contact in several places). The application range of resistance welding is very wide: spot welding is used in the manufacture of cars, airplanes, railway cars and metal goods. Hump welding is used in the manufacture of cars and refrigerators Linear welding is used for the manufacture of thin,walled tanks and pipes. While short-circuit and spark welding are used for connecting railway rails, rebar, chain links and bicycle wheel rims (Masłowski, Kulińska 2018). However, robotized spot welding is used primarily in the automotive industry, in the process of building car bodies (Jezierski, 2006: 217). Hence, it can be stated that the car body assembly process is more than 90 % robotic.
The spot welding process is particularly easy to robotise due to the accuracy achieved by the robots and the possibility to perform the welding in any position. Robots used for welding, most often articulated robots, should be characterized with:
– A sufficient number of degrees of freedom such that the bend in the required position resulting from the geometry of the welds can be performed, – Working space dimensions to ensure access to all points, – The required positioning accuracy.
The use of industrial welding robots requires appropriate equipment and above all the selection of a suitable welding machine. To cooperate with the robot, welding machines equipped with the following functions are used:
– Microprocessor-controlled power source. After the operator has selected the type of operation of the device and the sheet thickness, the device control system automatically selects the correct current value and welding time and, if necessary and justified, dynamically regulates these values during the welding process. If the welding current is too low, an acoustic warning signal is activated, – Built-in mains voltage control system recognizing low-voltage states, with an automatic measurement and control of the welding current. This ensures the stabilization of the welding current, the multi-programmed correction of the welding current as a function of the number of welds performed and the so-called stepper, – Automatic control of the welding process, especially the clamping force of the electrodes to the elements to be connected.
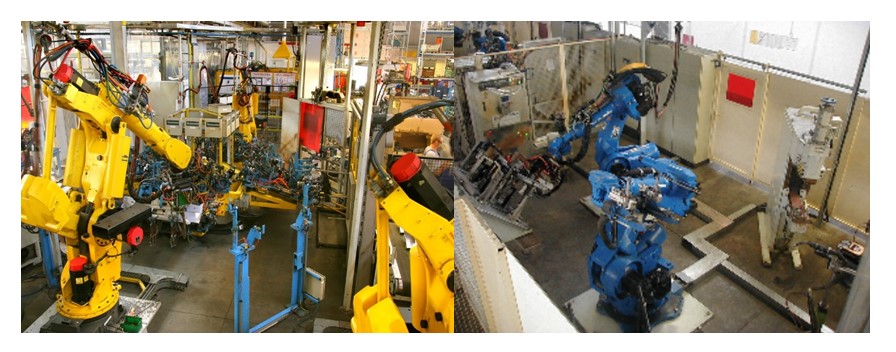
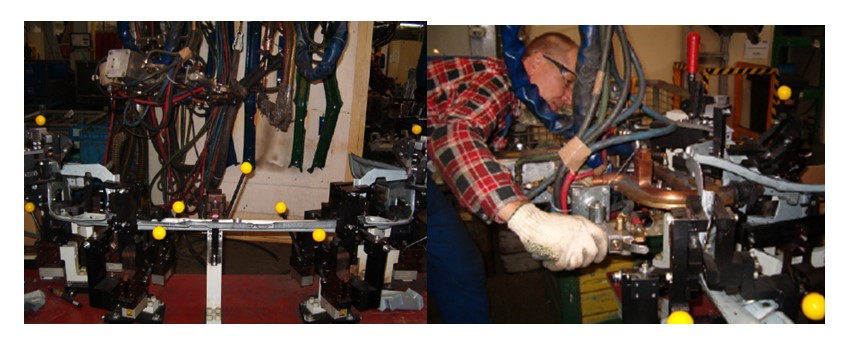
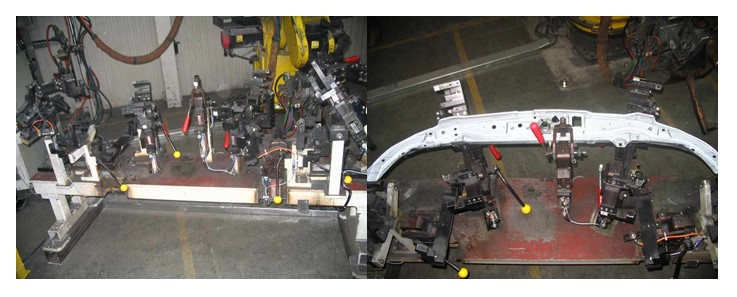
The company has at its disposal, among others, Fanuc and Motoman robots presented in Figure 4.
Fig. 4: Fanuc S420iF robot in a spot-welding process (left), Motoman UP-6 robot with a welding, sealing and bonding function (right)
[own study]
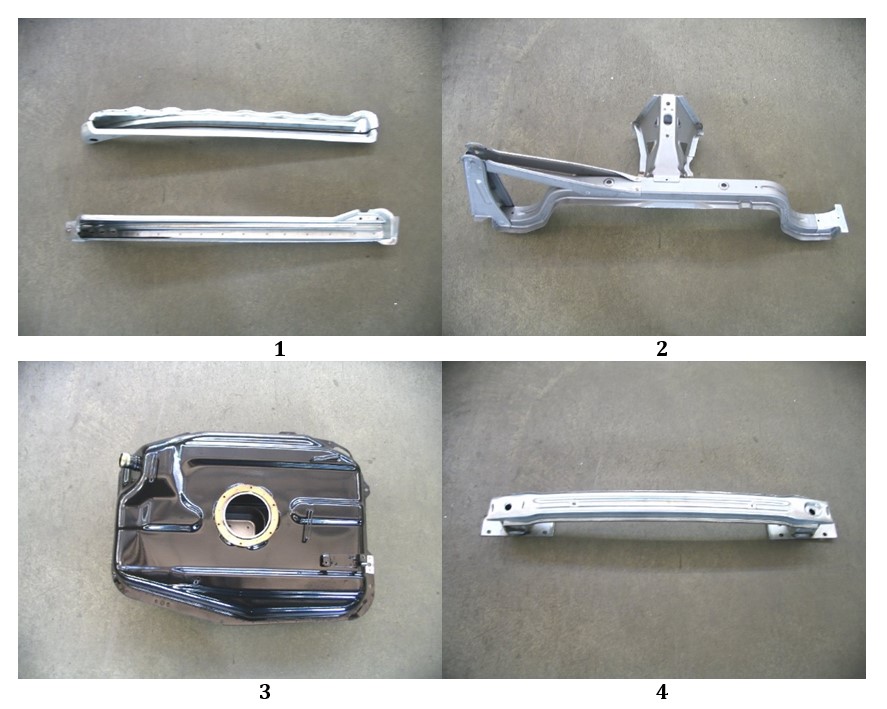
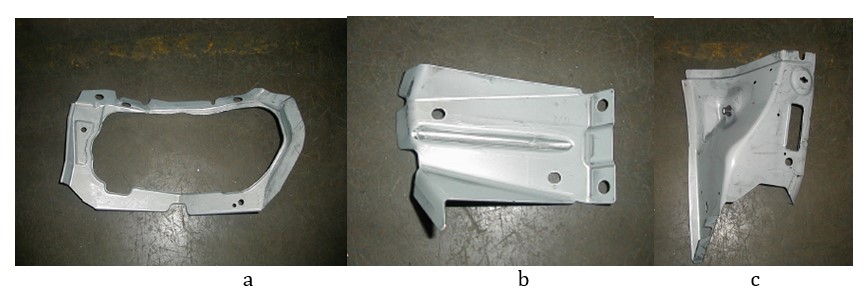
The company combines metal elements: car bodies, complex structures (front panels, steering rods) and A-class components (doors and accident protection – bumpers). Until February 2007, the factory received semi-finished products from the German factory. After the purchase and launch of the PME 630t progressive press, the company punched the semi-finished products on site, which significantly reduced logistics costs. The figures below show several finished products of the automotive industry manufactured in the Opole company.
Fig. 5. Side door guides (1), Body bracket (2), Fuel tank (3), Rear bumper (4) [own study].
Product analysis before automating the technological process
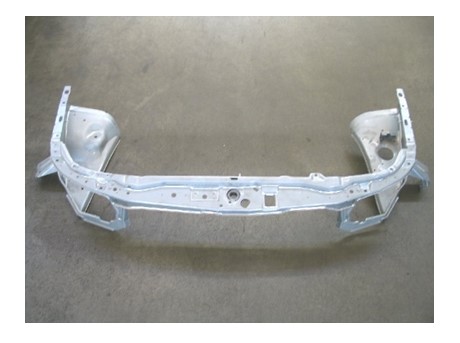
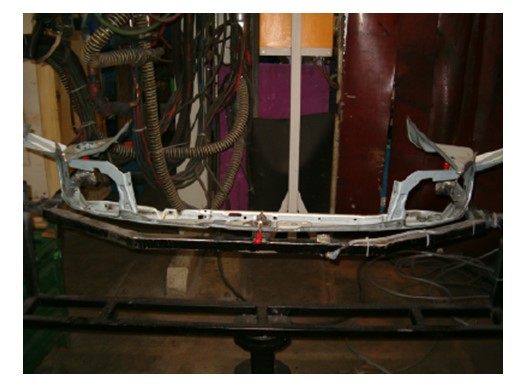
The factory received semi-finished products, which were joined by hand welding machines at 42 welding points. Three employees worked in one shift, performing the standard of 125 front panels (fig. 6).
Fig. 6. Front panel [own study].
Figure 6 shows a finished body element for the Opel Astra II consisting of 7 elements – connected by welding machines according to the following technological instructions:
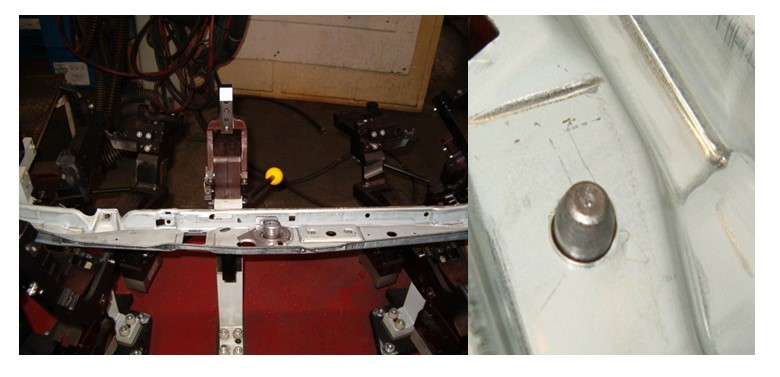
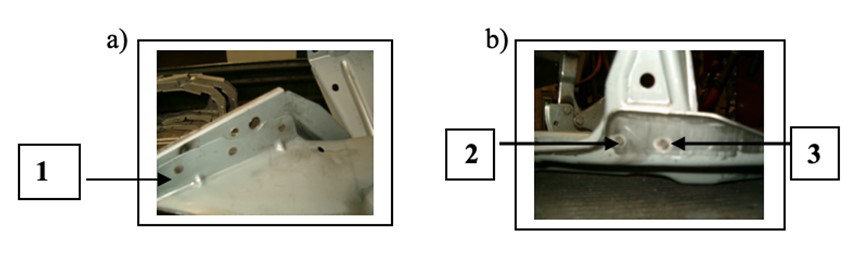
A) Prior to commencing work, the first shift has inspected the workstation according to the maintenance instructions for Z10,B) The FT-227 part of the FT-227 is fitted on the fixing studs and closed with a tensioner (Figure 7),
Fig. 7: Operation I: the FT-227 part (left), the appearance of the pin that fixes the position of the part (right) [own study].
C) Then, on the left side of the instrument,
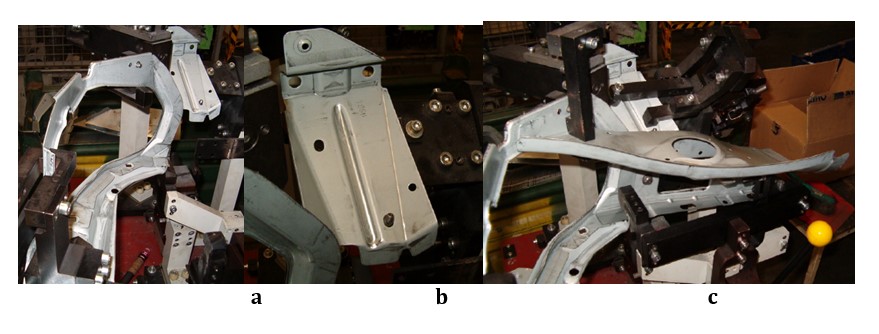
the parts KT-258, KT-262 and FT-225 are inserted (Figure 8). The clamping tensioners were tightened,
Fig. 8: Appearance of semi-finished products: a) KT-258, b) KT-262, c) FT-225 [own study].
D) The treatments were performed on the right side of the instrument. Parts KT-259, KT-263 and FT-224 have been installed (Fig. 9). The clamping tensioners were tightened,
Fig. 9: Appearance of semi-finished products: a) KT-259, b) KT-263, c) FT-224 [own study].
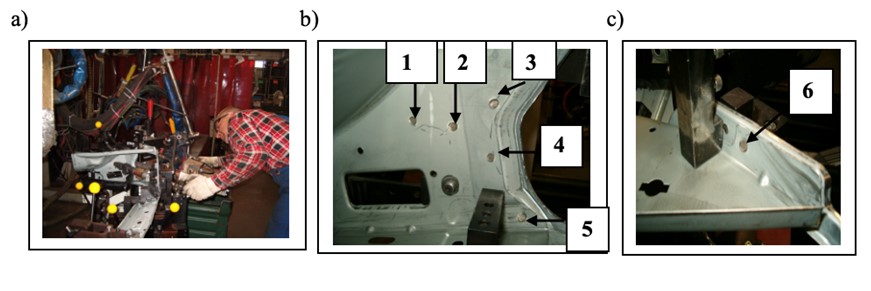
E) Welding started with welder A – on the left side with horizontal welds (fig. 10),
Fig. 10: Manual welding machine: appearance of the manual welding machine with horizontal welds (left), a worker performing the welding (right) [own study].
F) 6 side welds were made (Fig. 11). Then 2 top welds were made,
Fig.11: Side welds made with a hand welding machine with horizontal welds [own study].
G) After 8 weldings with welder A, welding with welder B (vertical welder) started. 8 welds were made – 4 on the left side of the FT-227 part and 4 on the right (Fig. 12),
Fig. 12: a) View of the welding machine electrode – working on the left side of the front panel, b) View of the welding machine – working on the right side of the panel, c) View of 4 welds on the left side of the panel, d) View of 4 welds on the right side [own study].
H) After welder B has been put away, welding with welder C (from an adjacent position with horizontal welds) started. On the right side of the device, 5 side welds and 1 top weld were made (fig. 13),
Fig. 13: Operation I with welder C: a) Worker holding welder C, b) Making 5 side welds, c) Making 1 top weld [own study].
The total number of welds made in operation I was 22: welder A made 8, welder B made 8 and welder C made 6 welds.
I) The tensioners were opened, part of the fixture was removed and handed over to the adjacent position (end of Operation I),
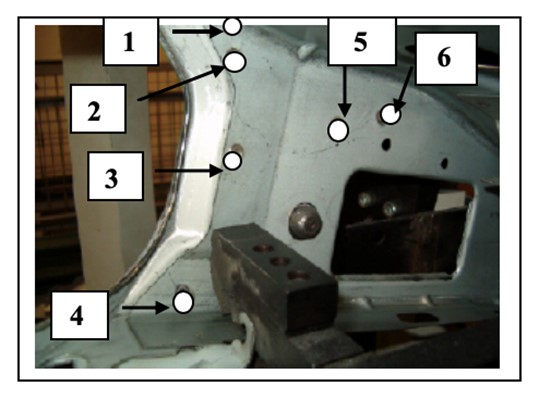
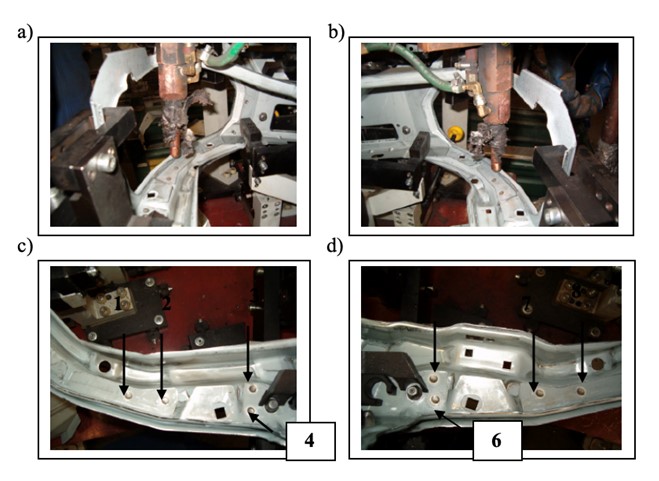
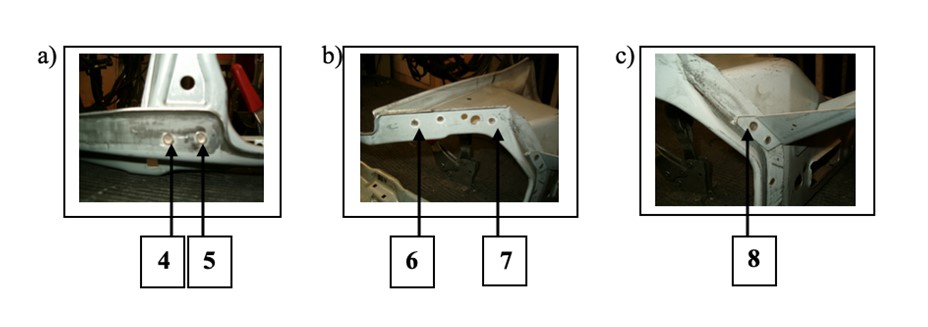
J) The part pre-welded in operation I was taken, placed on the pins fixing the FT-227 semi-finished product (Fig. 14) down, the tensioners were fastened. Welding with the C welding machine (with horizontal welds) was started. On the left side of the part, 3 welds were made (Fig. 15), and on the right side, 5 welds were made (Fig. 16),
Fig. 14: Shifting a semi-finished product and starting operation II [own study].
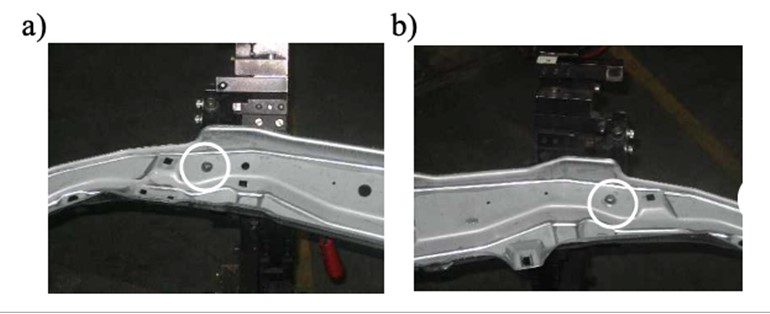
Fig. 15: Execution of 3 welds on the left side of the panel: a) View of the executed 1 weld at the end of the panel, b) View of 2 welds near the spotlight [own study].
Fig. 16: Making 5 welds on the right side of the panel: a) View of 2 welds under the headlamp, b) View of 2 welds above the headlamp, c) The weld made at the end of the panel [own study].
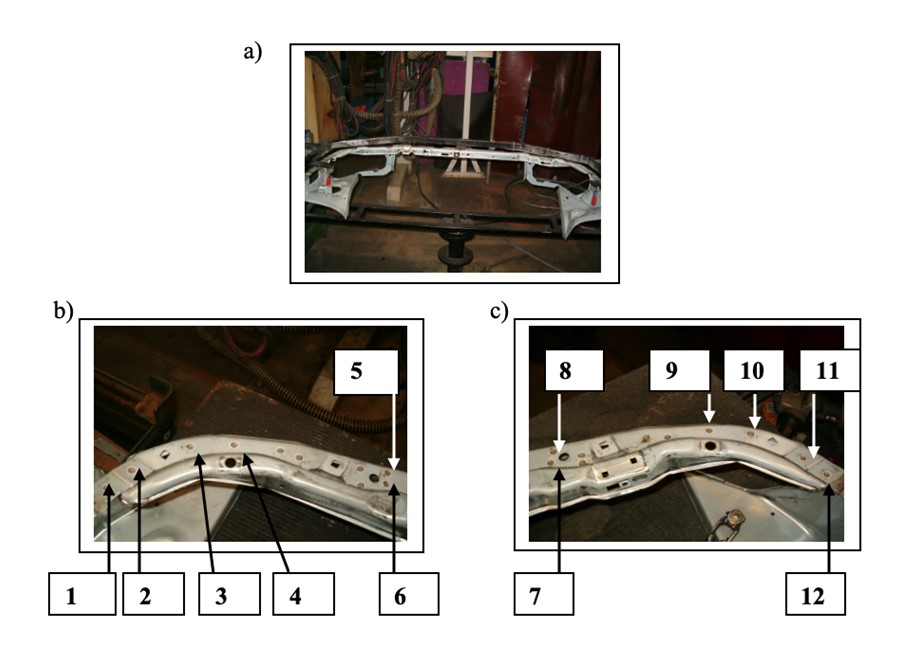
K) At the end of operation II, the instrument was turned by 180, and 12 welds were made (Fig. 17) with the D welder (with vertical welds),
Fig. 17: View of the rotated front panel a) and the arrangement of 12 welds: b) On the left side of the part, c) On the right side [own study].
The sum of welds performed in operation II was 20: welder C performed 8 welds, and welder D-performed 12 welds. The welds made by the D welder were checked for burrs. Burrs were removed with a pneumatic grinder.
L) The panel was removed from the instrumentation and controlled according to the self-control card,
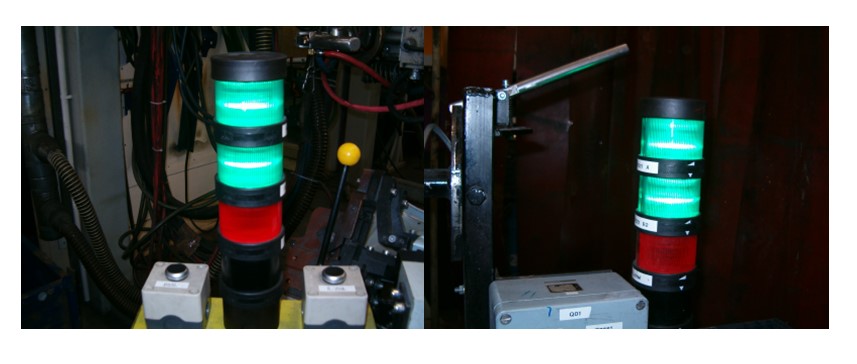
M) After operations I and II (42 welds in total), the green signal lights were lit (Fig. 18). This is a sign that the correct number of welds on each weld has been made,
Fig. 18: Lights indicating the correct number of welds made: green light indicating the left side of the device (left), signal received from the right side (right) [own study].
N) Packing of the finished product into a container.
The two operations described above were performed by 3 people in shifts, who operated 4 manual sealers. The standard was 125 finished elements for the customer. The work before automation was hard, because one sealing machine weighed 150 kg and it was very difficult to reach all the sealing points. There were a lot of burrs that had to be removed. One shift replaced 8 electrodes, which also had to be cleaned after several operations.
Product analysis after the automation of the technological process
After automating the technological process, one employee per shift produced 225 finished elements according to the following technological manual:
A) Before commencing work, the first shift has inspected the workstation according to the maintenance instructions for Z19 – the new panel welding workstation (Fig. 19 – left),
B) The FT-227 part (Fig. 19 – right) is fitted on the fixing studs (Fig. 20) and closed with a tensioner,
Fig. 19: Robotized welding station for the front panel (left) and the first part of the panel fixed with a tensioner (right) [own study].
Fig. 20. Positioning pins: a) Left hand pin of the instrument, b) Right hand pin [own study].
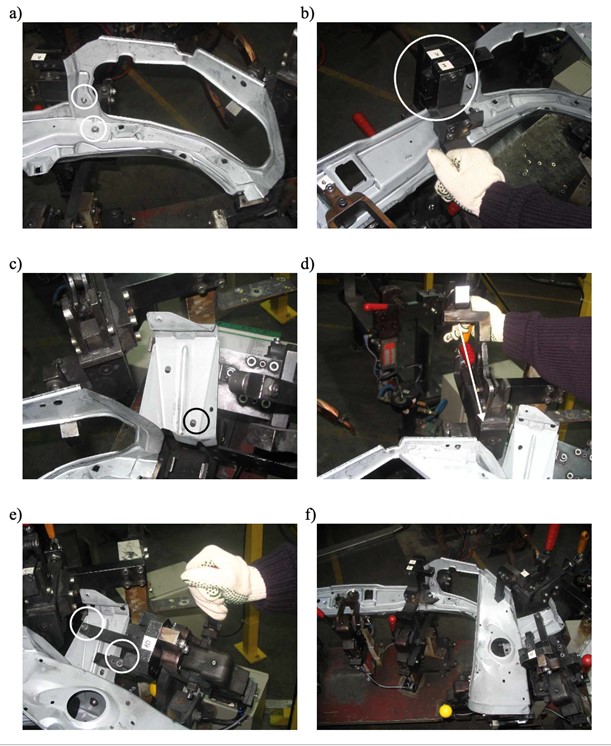
C) Then, on the right side of the instrument, the parts KT-258, KT-262 and FT-225 are put on the fixing pins. The fixing tensioners are closed. Figure 21 shows the activities discussed and performed by the station operator,
Fig. 21. Fixing the components on the right-hand side in operation I: a) Part KT-258 mounted on the position fixing pins, b) Fastening of the fastener, c) Overlapping the semi-finished product KT-262, d) Fastening of the panel, e) Fastening of the part KT-262, f) Overlapping and fastened part FT-225 [own study].
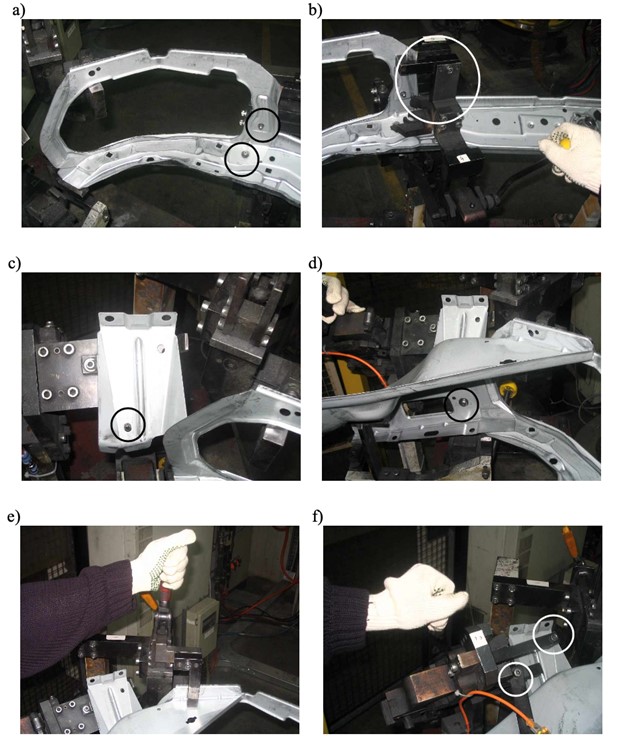
D) After this operation, the parts KT-259, KT-263 and FT-224 were placed on the left side of the instrument. They were pressed with the clamping tensioners – as shown in Fig. 22,
Fig. 22: Fixing the components on the left-hand side in operation I: a) Part of the KT-259 mounted on the positioning pins, b) Fastening of the fastening tensioner, c) KT-263 overlayed on the pin, d) Panel for tightening the KT-263 part, e) Properly closed tensioner, f) Part of the KT-263 fixed [own study].
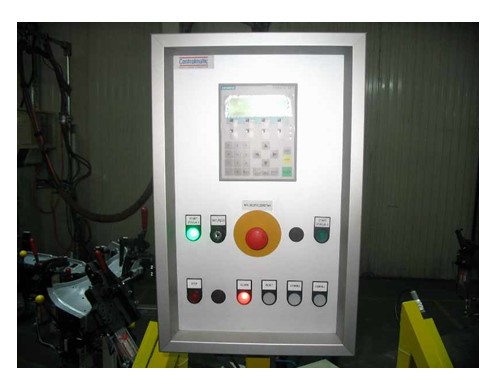
E) After all the semi-finished products have been installed, the welding cycle was started by means of a green, pulsating button (Fig. 23)
Fig. 23: Green button on the control panel, indicating that all parts are well fixed and the welding process can begin [own study].
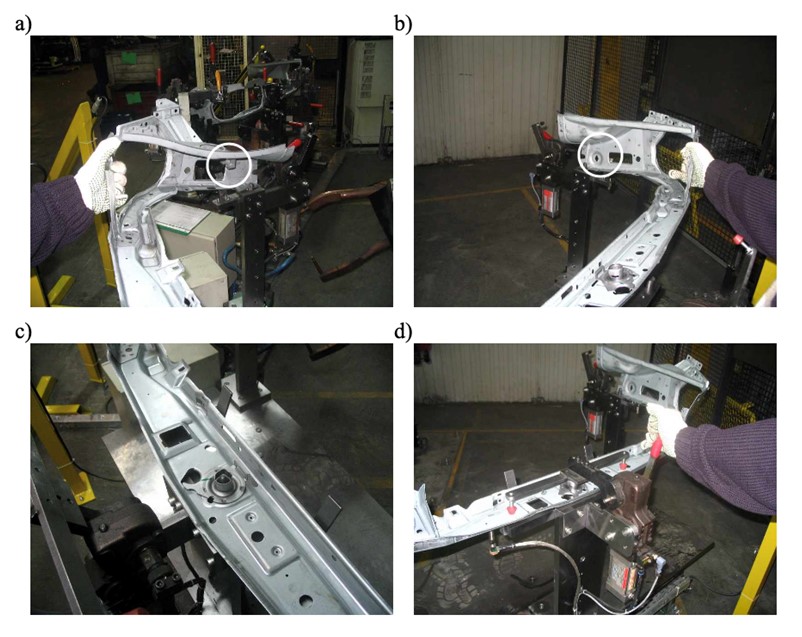
(F) The part pre-welded in operation I was removed. The FT-227 part was placed on the fixing pins (Fig. 24 a, b) and the tensioner was fastened (Fig. 24 c, d),
Fig. 24: (a) Panel overlayed by a left-handed fixing pin, (b) Right-handed fixing pin supporting the panel and Operation II: (c) Panel turned by 1800, (d) Panel fixed with a tensioner [own study].
G) The welding cycle is started with the green (flashing) button.
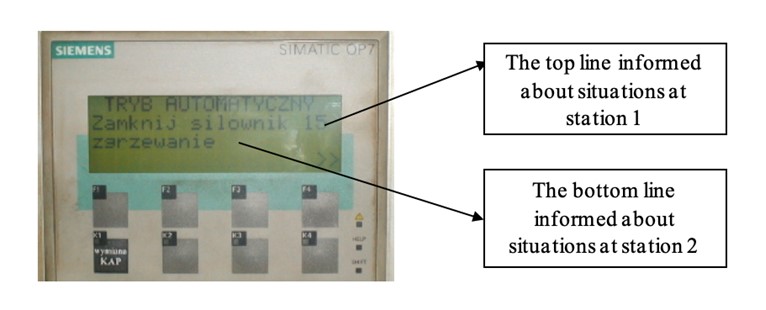
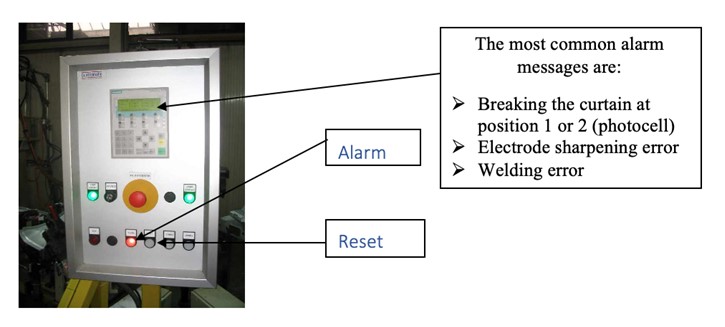
A green flashing button marked the insertion of all components and the closing of all the fastening cylinders. If the button did not flash green, the completeness of the components and the closure of all the actuators was checked. Information about the problem was shown on the display (fig. 25), and a red light was lit with the word “Alarm” (fig. 26). The “Reset” button had to be pressed at the time of the alarm. If the stand did not react, maintenance had to be notified.
Fig. 25: Siemens display, showing errors made by the operator [own study].
Fig. 26: Operator’s panel signaling the alarm [own study].
One employee made 225 finished front panels for the Opel Astra II. There were no burrs (as in the case of manual welding machines) and there were no shortages of material. The Fanuc Robotics S-420i distributed the welds very precisely and had the function of automatically sharpening the electrodes, which resulted in much less wear.
From the above analysis of the production processes, it appears that there were significant advantages for the product made with the Fanuc Robotics S-420i industrial robot, because:
– There were lower production costs (there was one operator working in one shift, who made 225 finished elements, rather than the previous one – 125 elements made by three employees), – Less fatigue of employees (one welding machine weighed about 150 kg). Three workers operating 4 manual welding machines, during one shift, made 125 finished parts, times 42 welds, which gives us 1750 welds per person! – Good funnel. A lot of space was taken up by the distribution of semi-finished products for production (near the welding station). In the case of the automated station – the distribution of materials and the production socket were at least 2 times smaller, – Production downtime was almost zero (previously caused, among others, by: frequent replacement of used electrodes or temporary rest of employees), – Very good quality parameters. In the manual welding, the welds were inaccurately distributed, there were burrs and the welded joints were not strong enough. There were many material shortages due to incomplete components and there were many returns by customers.
Conclusion
From the analysis of the product and the conclusions, it can be seen that the product quality is definitely better after using the most modern production technologies. In the automotive industry, the most common robotic applications are welding stations. An example of such an application is a station working in the Opole automotive factory, which produces pre-assembled car body parts. This workstation uses an industrial robot Fanuc Robotics S-420i, controlled by an R-J2 controller, together with a superior control unit S7 315-2DP, which – apart from supervising the robot’s work – also controls two welding devices. The first device, equipped with 15 pneumatic cylinders, is designed to ensure the repeatability of the geometry of the workpiece to be welded. While the second device, equipped with 3 pneumatic cylinders, only immobilizes the workpiece to be welded. The OP7 operator panel is used to communicate with the operator.
Applications of the robot welding process are used mainly due to very good quality parameters, their repeatability and a high increase in production efficiency – which was also confirmed by the described installation. Before the modification, the double stations equipped with a manual welding machine and a welding device with manual clamps that fix the elements to be welded – operated by three employees – achieved an output of 125 pieces of finished components per shift. After modification, 225 finished components are produced in one shift. It should be noted that the robotized station is operated by only one person (employees who are no longer required to operate the described robotized station, after training, have filled the newly created positions). In this way, the efficiency of the produced elements per one employee has increased over four times – with repeatable, very good quality parameters.
The basis for the operation of a production enterprise today is to satisfy the needs of customers at the lowest possible price. To obtain a good quality product at a low price, the company should invest in new and improved production technologies.
An excellent example is a company from Opole. After the production processes were automated, production costs dropped significantly. After the purchase of the press, the logistic costs dropped. The company achieved four times its productivity, improved working conditions and ergonomics, and invested in training. An additional motivator is job responsibility. The robot operator has become a quality controller, the number of deficiencies has decreased, and most importantly, the robot has replaced the heaviest physical work and is not exposed – like a human being – to loss of health or life. There are defects in every company. This includes a very high turnover rate of workers due to low wages. Tower Automotive Poland, despite the fact that production has quadrupled, has not been able to double its earnings, which can be explained by large technological investments.
Acknowledgment
Research financed from the NCN research project no. UMO-2012/05 / B / HS4 / 04139
Abramson S. (1999) Technika doskonalenia jakości, WSiP, Warszawa Alpeeva E. A., Volkova I. I. (2019). “The use of fuzzy cognitive maps in the development of an experimental model of automation of production accounting of material flows,” Russian Journal of Industrial Economics, MISiS.
Bigvand P. G., Fay A. (2017) Optimal path-finding in a context-aware workflow support system for process and automation engineering of plants, Emerging Technologies and Factory Automation (ETFA) 2017 22nd IEEE International Conference on, pp. 1-8.
Borczyk J. (2003) Automatyzacja procesów dyskretnych, OWPW, Warszawa Ciepiela A., Kozioł R. (1978) Automatyka kompleksowa procesów przemysłowych na przykładzie walcowni, WNT, Warszawa Cepeda T.A., Lopes I.S. (2019) Support methodology for product quality assurance: a case study in a company of the automotive industry, Procedia Manufacturing, Volume 38, pp. 957-964, https://doi.org/10.1016/j.promfg.2020.01.179
Dahlgaord J., Kristensen K., Kanji G. (2001) Podstawy zarządzania jakością, PWN, Warszawa Doroszewicz S. (2002) Techniczne i ekonomiczne aspekty jakości, SGH, Radom Daron A., Restrepo P. (2019). “Automation and New Tasks: How Technology Displaces and Reinstates Labor.” Journal of Economic Perspectives, 33 (2): 3-30 DOI: 10.1257/jep.33.2.3 Dendera-Gruszka, M., Kulińska, E., & Wojtynek, L. (2018). Methodology for planning production process with the use of decision tables in the metal industry. Research in Logistics & Production, 8(1), 67–73. http://doi.org/10.21008/j.2083-4950.2018.8.1.5 Edlinger R., Nuechter A. (2019) MARC – Modular Autonomous Adaptable Robot Concept, Safety Security and Rescue Robotics (SSRR) 2019 IEEE International Symposium on, pp. 1-7 Fiorino M., Barone C., Barone M., Mason M., Bhagat A. (2019), Quality Systems in the Food Industry, Springer, Cham, ISBN 978-3-030-22552-0, https://doi.org/10.1007/978-3-030-22553-7
Graham G., Burns L., Hennelly P., Digital Transformation in the Automotive Supply Chain, 23rd Cambridge International Manufacturing Symposium University of Cambridge, 26 – 27.09.2019 Gołębiowski M., Janasz W., Prozorowicz M. (2002) Polityka projakościowa w przedsiębiorstwie, WNUS, Szczecin
Ivanov D., Das A., et al. (2018) New Flexibility Drivers for Manufacturing Supply Chain and Service Operations, International Journal of Production Research, vol. 56, no. 10, pp. 3359-3368.
Jezierski E. (2006) Dynamika robotów, WNT, Warszawa
Knapiński M., Pietras E. (2017) Wpływ wdrożenia systemu usprawniającego procesy logistyczne na funkcjonowanie przedsiębiorstw, no. 6 Autobusy pp. 1425-1428 Kubińska-Jabcoń E., Niekurzak M. (2019) Wykorzystanie innowacyjnych narzędzi informatycznych do usprawnienia logistycznych procesów produkcyjnych, Autobusy 6/2019, pp. 315-320, DOI: 10.24136/atest.2019.170
Kulińska, E., Masłowski, D., Dendera-Gruszka, M., & Pifczyk, D. (2018). The use of flexsim simulation software for defining costs of a gradual shaft production process. In Metal 2018 : 27th International Conference on Metallurgy and Materials : May 23rd-25th 2018, Hotel Voronez I, Brno, Czech Republic, EU : conference proceedings (pp. 2020–2023). Tanger Ltd. Lowenberg-DeBoer, J., Huang, I.Y., et al. (2020). Economics of robots and automation in field crop production. Precision Agric 21, 278–299 https://doi.org/10.1007/s11119-019-09667-5
Mas-Tur, A., Modak, N.M., Merigó, J.M. et al. Half a century of Quality & Quantity: a bibliometric review. Qual Quant 53, 981–1020 (2019). https://doi.org/10.1007/s11135-018-0799-1
Masłowski, D., & Kulińska, E. (2018). Analysis of the application of FMEA method of warehouse system in metal foundry. In Metal 2018 : 27th International Conference on Metallurgy and Materials : May 23rd-25th 2018, Hotel Voronez I, Brno, Czech Republic, EU : conference proceedings (pp. 2036–2041). Tanger Ltd.
Panchev T. (2017) Increasing the Efficiency of Automation of Production Processes by Reporting the Parameters of the Parts’ Flow, ICT Information and Communications Technologies, UIKTEN – Association for Information Communication Technology Education and Science, Issue Year: 6/2017, Issue No: 3, pp: 484-487.
Yihai He, Changchao Gu, Zhenzhen He & Jiaming Cui (2018) Reliability-oriented quality control approach for production process based on RQR chain, Total Quality Management & Business Excellence, 29:5-6, 652-672, DOI: 10.1080/14783363.2016.1224086 Waluya, A.I., Iqbal, M.A. and Indradewa, R. (2019) ‘How product quality, brand image, and customer satisfaction affect the purchase decisions of Indonesian automotive customers’, Int. J. Services, Economics and Management, Vol. 10, No. 2, pp.177–193.
Wittig J. (2005) Process automation for the production of large composite parts, Reinforced Plastics, Volume 49, Issue 1, January 2005, Pages 30-33, https://doi.org/10.1016/S0034-3617(05)00519-9