Josip Juraj Strossmayer University of Osijek, Faculty of Economics in Osijek, Croatia
Volume 2019,
Article ID 400418,
IBIMA Business Review,
15 pages,
DOI: DOI: 10.5171/2019.400418
Received date: 3 April 2019; Accepted date: 3 May 2019; Published date: 17 July 2019
Academic Editor: Adam Pawliczek
Cite this Article as:
Davor DUJAK (2019)," Causal Analysis of Retail Distribution System Change from Direct Store Delivery to Centralized Distribution", IBIMA Business Review, Vol. 2019 (2019), Article ID 400418, DOI: 10.5171/2019.400418
Distribution system significantly influences not only retailers’ and their suppliers’ cost structure, but also other connected processes (e.g. ordering, inventory replenishment) with direct consequences on product availability levels and consequently on end customer satisfaction. Therefore, changing of retail distribution system causes important process and organisation changes for both retailers and their suppliers and almost never occurs without significant obstacles. The goal of this paper is to provide profound overview of retailers’ and their suppliers’ reasons for changing of distribution model from direct store delivery to centralized distribution, and to highlight centralized distribution’s main benefits and downsides. Methods used for empirical research are semi-structured deep interviews with retailers and their suppliers, as well as causal mapping for purpose of representing cause and effect analysis of research problem. Results indicate high degree of retailers’ satisfaction with centralized distribution mainly due to lower costs, and increase in sell-out traffic. While suppliers also feel cost reduction, they are not satisfied with change of distribution system model mostly due to lost control over physical product flow. Nevertheless, suppliers’ main reason for accepting change is ensuring long-term cooperation with retailers – their main path to end customers.
Keywords: distribution system, centralized distribution, direct store delivery, causes for distribution system change
Introduction
Logistics has always been a significant part of retailing. Retail marketing works on insuring demand by choosing and forming product assortment and their prices according to consumers’ needs and promoting it with the goal of pulling customers to stores (offline or online) to make a purchase. But it cannot be successful without logistics. The main emphasis of logistics activities is on the physical flow and supportive information flow with a goal of ensuring existence of desired products in the optimum quantities in the exact places and in the required time, simultaneously working on lowering costs of these activities. At the same time, retail’s part of supply chain doesn’t include product transformation like it is the case in the production part of supply chain (or those are only minimal activities like kiting, labelling or just baking of frozen bakery products). Therefore, it can be said that logistics is not only one of the retailer’s company functions, but indeed the main competence of a retailer.
Distribution system from suppliers to retail stores plays key role in logistics activities. As retailers are growing through different retail concentration processes, complexity of their distribution network is increasing by every new store or warehouse. In many European countries concentration level C10 (market share of 10 biggest food retailers) is higher than 60 %. Therefore, contemporary retail chains often have few hundreds of stores in one country, or even few thousand in few countries. In such conditions, besides characteristics of high basic logistics service and low cost of providing it, nowadays companies have to insure high levels of responsiveness, as well as possibilities of process and/or technology innovations throughout distribution channel. Two distribution system models in contemporary food retailing prevail: direct store delivery (DSD) and centralized distribution (CD). While DSD (or sometimes called decentralized distribution) as more traditional distribution model is carried out almost entirely by supplier (usually food manufacturer or wholesaler), in the last few years there is growing number of retail chains in Europe that require and implement CD as a distribution model which is mainly performed by retailer. This proves worldwide trend of increasing retailers’ power in (especially food) supply chain (Ghosh & Eriksson, 2019; Neuninger, 2019; Das Nair, 2019; Finger et al., 2018; Wood, 2013, Fuchs, 2009; Fernie & Sparks, 2018), where retailers are gaining increased control over the supply chain (Wulfraat, 2019).
The main goal of this paper is to provide deep overview of retailers’ and their suppliers’ reasons for changing of distribution model from DSD to CD, and to highlight CD’s main benefits and downsides. From the main goal, two research questions arise:
Research question 1: What are the retailer’s reasons for changing the distribution system from direct store delivery to centralized distribution?
Research question 2: What are the supplier’s reasons for changing the distribution system from direct store delivery to centralized distribution?
The empirical part of research is conducted using causal root analysis method of developing causal maps based on deep interviews with retailers and their suppliers. Two new causal maps are developed presenting detailed structure of retailers’ and suppliers’ view on change of distribution system from DSD to CD.
After introduction part, the paper proceeds with literature review; the main retail distribution systems and their characteristics are given. After research methodology, research results are divided in two parts representing interview results and developed causal maps – first from retailers’ perspective on change of distribution system model, and then from suppliers’ side. Paper concludes with summary and suggestions for improvement of supply chain relations between retailers and their suppliers with the aim of improving overall supply chain performance.
Literature Review
The term distribution system is frequently used as synonym with the term distribution network. By designing distribution network, companies in supply chain are actually building distribution structure (Dujak, 2012) and determine its distribution strategy – they decide about number, location and function of distribution facilities. Design of the distribution network is primarily a strategic, long-term issue. Also, it is important to connect each facility in distribution network with their suppliers and buyers and to determine adequate inventory levels and other levels of logistics service. Therefore, through designing a distribution network (and designing supply chain as such), it is necessary to ensure that the supply chain configuration is effective in relation to the expected conditions but also flexible enough and robust to adapt to unexpected changes in the conditions surrounding it (Goetschalckx & Fleischmann, 2005).
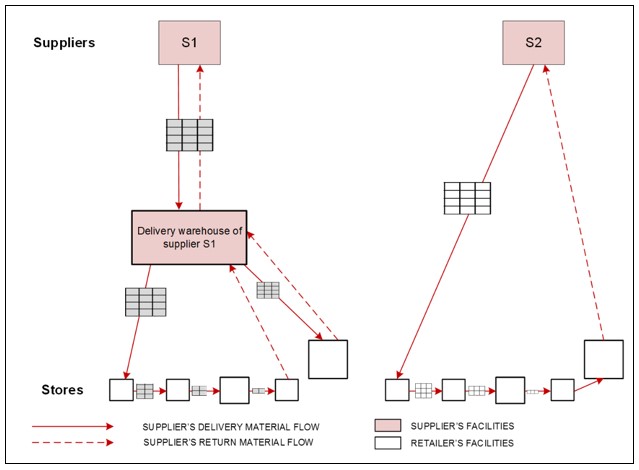
Retail distribution network could be organized in either DSD or CD model, or their combination. DSD system is based on mainly suppliers’ distribution (transport and warehousing activities) from their production and warehouse facilities to each retailer’s store (see Figure 1). In practice this means that most of the suppliers come with their trucks to each store at different time intervals – from once a week, up to once a month or even once in two months – delivering only their products. DSD is carried out either by direct transport from supplier’s manufacturing plant to retailer’s store, or through one or more levels of suppliers’ warehouses. Deliveries are made based on the store orders mainly created by store managers in certain intervals that were negotiated with suppliers. On the one side, retailers don’t want too long intervals as they don’t have enough space for storing products in their stores. But on the other hand, it is not possible for suppliers to be every or every second day in hundreds of stores – neither in operational or cost aspect (less frequently delivery means larger shipment, leading to lower transportation cost per unit for supplier).
Fig. 1: Direct store delivery distribution model
Source: author
Only small number of products directly imported by retailer or products from suppliers who have same owner as retailer, are distributed through retailer’s distribution system (through smaller number of warehouses).
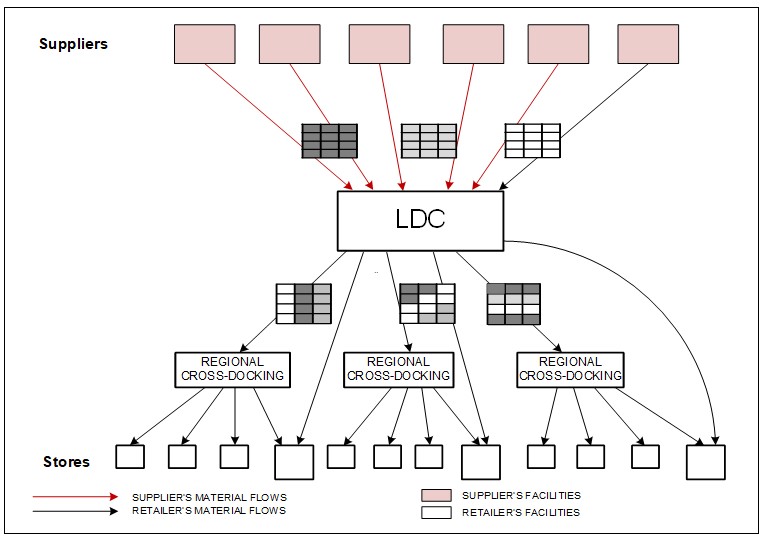
CD system is based on retailer’s earlier taking control of products in the supply chain. In practice that means retailer is responsible for the majority of transportation and warehousing activities in the distribution system. Suppliers deliver products for all retailer’s stores to one point – one retailer’s facility, usually big warehouse that becomes retailer’s logistics distribution center (LDC). Supplier’s consolidated shipments are delivered daily or every second day (sometimes less frequently), depending on demand frequency for its products. In retailer’s warehouse order picking is made. Picked and consolidated heterogeneous shipments are then controlled, packed, and loaded for transportation to stores (see Figure 2). Transportation from LDC to stores is under control of retailers as well – either done through retailer’s own transportation fleet or outsourced by retailer to the 3PL (Third Party Logistics provider, specialized logistics company).
Fig. 2: Centralized distribution model
Source: author
Although CD was earlier considered as a distribution system model with lower total costs but longer lead times to stores (Claesson & Hilletofth, 2011), with introduction of cross-docking warehouse strategies in retailer’s LDC this doesn’t have to be a case anymore. While cross-docking requires significant investments, additional coordination activities with suppliers, improved joint forecasting and improved know-how on warehouse operations, food retailers increasingly implement it because of increased speed to the stores and lower inventory levels. This way CD becomes the preferable distribution system model for most of food retail chains in Europe.
One of the key questions when retailers and their suppliers are deciding about distribution model is its influence on out-of-stock (OOS) in retail stores and at the same time on product availability level as the first assumption of their sale. Due to its crucial meaning for OOS, Milićević et al. (2018) point out that in previous research there are different results – some favouring DSD, while others think that CD is resulting in lower OOS levels. In their research conducted in one Serbian retail company, DSD is resulting in lower levels of OOS probability while Životić and Pešić Radovanović (2013) made another research in Serbia and gained opposite results – CD increases product availability. Obviously, just changing distribution model from DSD to CD doesn’t guarantee improvements in OOS levels by itself, but there is a need for implementing crossdocking, contemporary IT in picking and transport activities, well organized team and hard work with suppliers on perfecting new ways of ordering and delivering.
Though CD is the prevailing distribution model for large retail chains, most of contemporary food retail companies in Europe use both models simultaneously – i.e. DSD is used for small percentage of products that are hard to transport and store together with the rest of products (e.g. frozen products or some bottled products in crates are hard to incorporate in heterogeneous shipments with packaged chocolates or detergents), while CD is used for all the rest. In last years, some other distribution models are added to one of these two main solutions with the aim of improving the overall distribution strategy and adapting to new consumer requirements and/or new distribution channels and their combinations (e.g. omnichannel retailing). Those are different version of last mile delivery, collecting returns for reverse logistics and in-transit distribution.
Research Methodology
Two main research methods were used in this paper with the goal of answering research questions: in-depth interviews and causal maps. In-depth interviews were used to find out causals and characteristics of distribution model change, while causal maps are used for very detailed level of presenting and clarifying results of in-depth interviews – causes and their relationships.
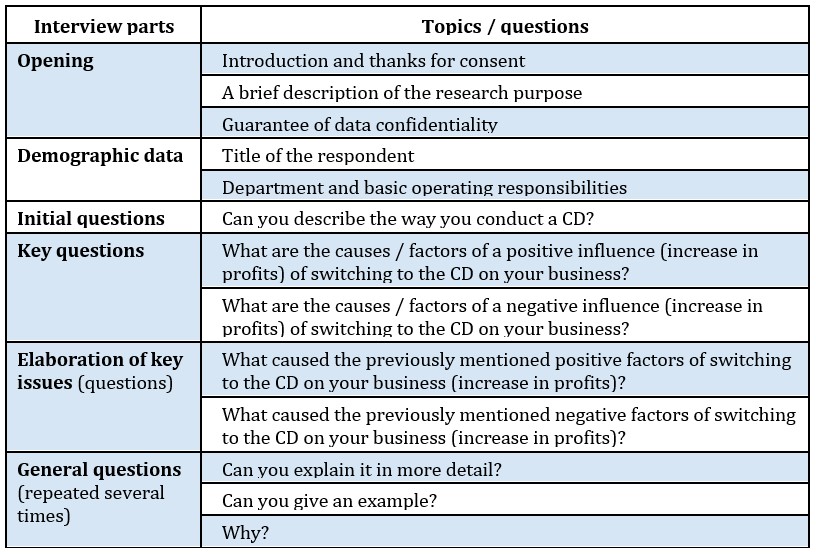
Four in-depth interviews were conducted with the employees of 4 leading retailers in the Republic of Croatia in FMCG and grocery sector (mainly food retailers), as well as 6 in-depth interviews with their suppliers from the food sector, i.e. several categories that fall into packaged food sector. Retailers were among top 10 food retailers in Croatia according to market share and they all conduct CD. The respondents were employees at the workplace of the Logistics and Supply Chain Director or their deputies. These in-depth interviews were semi-structured (i.e. semi-free style interviews). In addition to the main guidelines / questions that represented a specific orientation guide for interviewing (see Table 1), respondents were free to comment on some additional topics through more flexible approach. The interviews lasted for about 45 minutes. The interviews were recorded in the form of field survey data (in offices or warehouses of respondents).
Table 1: Main guidelines for in-depth interviews with retailers and their suppliers
Source: author
Results of interviews will be presented as a number of significant quotes and comments and explanations. Additionally, all results and new knowledge gained through these interviews will be presented through causal maps.
Mapping of two causal maps in this paper was conducted according to well recognized process causal mapping (Narayanan & Fahey, 1990; Nelson et al., 2000.; Hill, 2009). Causal maps are a group of maps (or diagrams) representing cause and effect relationships between variables or elements in a system (Hill, 2009). Geometric shapes (usually rectangles or ovals) represent two variables or elements of the system. The connecting arrows show how one idea or activity leads to another (Bryson et al., 2004), i.e. arrows between geometric characters show the direction of causality (Hill, 2009). In creating a causal map based on interviews, identifying causal relationships (concepts) through interviewing is done up to the point of redundancy or saturation. The point of redundancy is a point where further data collection would not lead to the identification of additional concepts. The point of redundancy is achieved by combining the concepts mentioned by all participants (Armstrong, 2005).
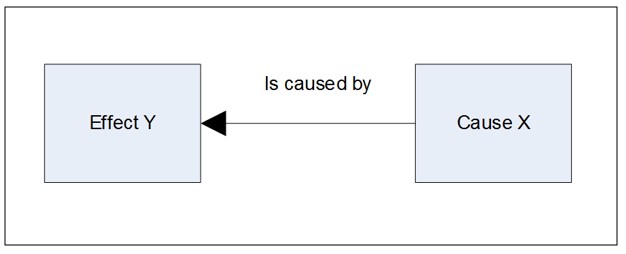
When drawing the map for the purposes of this paper, the approach recommended by Hill (2009) was used. It starts from the left side of the map and the concepts are drawn to the right. First in the left side is a research problem, i.e. the expected outcome drawn in the form of a rectangle in which the problem is written. Subsequently, the factors causing the expected outcome or problem are referred to the right side of the rectangle where the expected outcome is specified. Two rectangles are associated with an arrow pointing to a causal link (see Figure 3) in a way that the effect (or outcome) “Y” in the left rectangle is caused by the cause “X” in the right rectangle.
Fig. 3: Cause and effect relationship as a basis for developing of causal maps
Source: Hill, A. V. (2009). Causal Mapping, White paper, Clamshell Beach Press.
Factors are drawn in the order that the respondents mentioned them in the in-depth interviews conducted with retailers and suppliers. By identifying and drawing all the factors that cause the expected outcome / problem, the first level of cause is created. It is further possible for each listed factor to look for its causes and draw them in rectangle form to the right of each factor and link arrows in the direction of the outcome (from left to right). This creates another level of cause. It is possible to continue to break down the causes but care must be taken to avoid getting into the trap of excessive complications and running away from the essence of the problem.
Research Results
Survey of Retailer’s Relations Towards Centralized Distribution
The general impression after interviews with retailers is extremely positive attitude regarding change of distribution system and implementation of CD. That was expected as retailers were those who initiated this change in the distribution system. When considering CD implementation, retailers’ first goal is increasing sell-out traffic in their stores at a reduced overall cost. The main tool to achieve this is coordinated work on improving availability levels in store, i.e. decreasing OOS situations. Since retailers take over the goods earlier in supply chain and with it all the costs of further distribution (transport, warehousing and commissioning), suppliers are expected to make a payment which will also reduce the cost of the purchase. Compensation is usually charged in the form of so-called distribution costs covering, or as a discount on a purchase price.
A strategic manager responsible for managing the supply chain at a retailer states:
“Centralized distribution is expensive sport, especially when investing in initial deployment, and therefore there must be no major mistakes in implementation.“
From the quotation one can read the awareness of the responsibility that retailers take over by introducing the CD. The introduction of the centralized retail distribution is not just a question of supply chain department. It is a strategic issue for further business operations of the entire business entity and requires full support from top management.
“Actually, we’re switching the distribution from supplier to retailer!” – regional supply chain coordinator.
In order to get support from top management, it is necessary to argue the advantages of CD as well as its own ability to perform its supreme performance. Accordingly, there is a need for further training of employees at all levels. In the case of CD, decisions are made centrally for the entire distribution network (for activities of all distribution centres, warehouses and stores, and sometimes even for direct transport from suppliers). This additionally increases the number of variables to be taken into account in tactical as well as in daily planning and search for optimal solutions. Many savings are possible, primarily through the consolidation of transport, but also through the change of ordering policy. In the CD, automatic order is preferred. Automatic order is generated from day-to-day sales and stock statuses in stores through computerized inventory management system. Store staff has only limited influence on ordering in cases of discrepancy between inventory level in inventory management system and true inventory level in store (due to theft, damages, breakage, or some mistakes). It is based on collecting orders from all stores, sorting out to suppliers, and creating only one single order for each supplier. Thus, coverage of the distribution costs also includes covering a large part of order processing costs that a retailer now performs. The supplier in the CD receives only one consolidated order, while in DSD distribution there was a significantly larger number of orders that increased transaction processing costs.
“Optimization in supply chain is when everyone in supply chain carries out the activity in which he is most efficient – e.g. do the order picking if you can do it fastest and cheapest!” – Director of supply chain department at large retailer.
Large retailers today have sufficient daily turnovers, material and know how resources to take over new activities in supply chain. Prepared and state-of-the-art technologically-equipped transport fleet, developed LDCs and warehouses that are continually being promoted, as well as the organization of the entire distribution from headquarters that is continually learning, are arguments for such standpoint.
The deputy director of supply chains points to another important fact:
“It is necessary to distinguish between sell-in and sell-out traffic. They are not the same, and the difference was the stock that burdened us significantly in direct store delivery.“
In DSD distribution model, there has been a significant disparity between sell-in traffic (traffic between supplier and retailer) and sell-out traffic (traffic between retail and final customer). Sell-in traffic was considerably higher, partly because more stocks were held in stores (due to longer delivery times, i.e. shorter delivery frequency), and partly because of the ordering system that allowed store managers to order from suppliers’ sales representatives (often purchasing in advance and more than it is truly needed). All this has led to increased stocks in the store. Through CD, these stocks are completely ejected from the retail part of supply chain (moved to the supplier) or retained upstream in the retail LDC. This was possible because CD enables much more frequent deliveries in stores than in case of DSD – in average, heterogeneous delivery with needed products from almost all suppliers arrives to each store. In DSD distribution, deliveries were in different time frames ranging from once in two weeks up to once in two months.
Additionally, by using crossdocking technique in LDC, warehouse stocks have decreased and lead time from supplier to store dramatically improved.
The introduction of CD has led to the need for additional training of employees in warehouses. New cross-docking processes, new ways of commissioning, the need to accelerate activities, and continuous pursuit of improvement required techniques such as kaizen or new picking methods, exploring new technologies (e.g. RFID technology or voice picking), new packaging or working equipment (RPC packaging, roll-containers, new radio frequency scanners, new forklifts etc.). All this leads to an acceleration of daily activities and better employee and machine productivity.
The regional coordinator for logistics and supply chain reminds on some of the specifics of the distribution of different product categories:
“It is not the same whether you are working distribution of cosmetics, pasta or pet food. What is common to all product groups is that it should be no out-of-stock!”
This statement indicates different number of suppliers in different product categories, i.e. how the effects of CD depend on degree of concentration in the category or industry. In categories where the number of suppliers is small (e.g. in the pet food category), usually much better results are achieved with CD given that relationships and cooperation with a small number of suppliers are at an enviable level. On the other hand, it is more complex to harmonize a large number of suppliers in one category (e.g. in the pasta category) and optimize the category in order to have minimum rate of product unavailability.
Almost all retailers highlight the problem of negotiations with suppliers about switching to CD. In addition, when a supplier goes to a CD, sometimes there is strong resistance to the new distribution model, which prevents full potential of the CD exploited through collaboration with the retailer as well as with the supplier’s supplier. Retailers’ experience from negotiations is that:
“Suppliers have always presented distribution as their strategic advantage.”
Traditional approaches to distribution (such as DSD distribution) provided suppliers with not only physical control over the goods but also the proximity of information and the belief about the potential for additional sales impact (both sell-in and sell-out traffic). Retailers on the other hand believe that it is more important for them to gain control in supply chain as soon as possible. At the same time, they do not work on the increase of sell-out traffic only through supply chain tools, but also through other forms of marketing collaboration such as product category management which directly influences demand of final consumers.
Very important impact on profit due to switching to CD is reducing employee burdens in stores:
“… in this way, we have significantly free time for our salespeople – they are only once a day engaged in unloading, checking, receiving, etc.“
The result of a CD is one delivery per day in store, when a retailer delivers products of all suppliers needed. In the DSD distribution, there was a lot more deliveries per day – in large retail formats (hypermarkets) even up to 30 times a day, and for each delivery it was necessary to insure the salesperson’s time for receiving, checking out and stacking. Today, salespersons are doing their core activities – they are concerned about insuring product availability on shelves and improved customer service to increase sales.
Finally, retailers point out a significant impact on reducing environmental pollution by reducing the mileage in the distribution network in the CD compared to the DSD distribution system. This time only one truck visits the stores, while in DSD distribution the trucks of all suppliers crossed a similar mileage.
Negative factors of CD according to retailers don’t exist. But they just acknowledge certain challenges on a way of its successful implementation. Some of them are increased costs of work processes reorganization, higher costs of warehousing and transportation and potentially more frequent OOS situations in the first period of CD implementation. Most of these additional costs are covered by distribution cost compensation from suppliers.
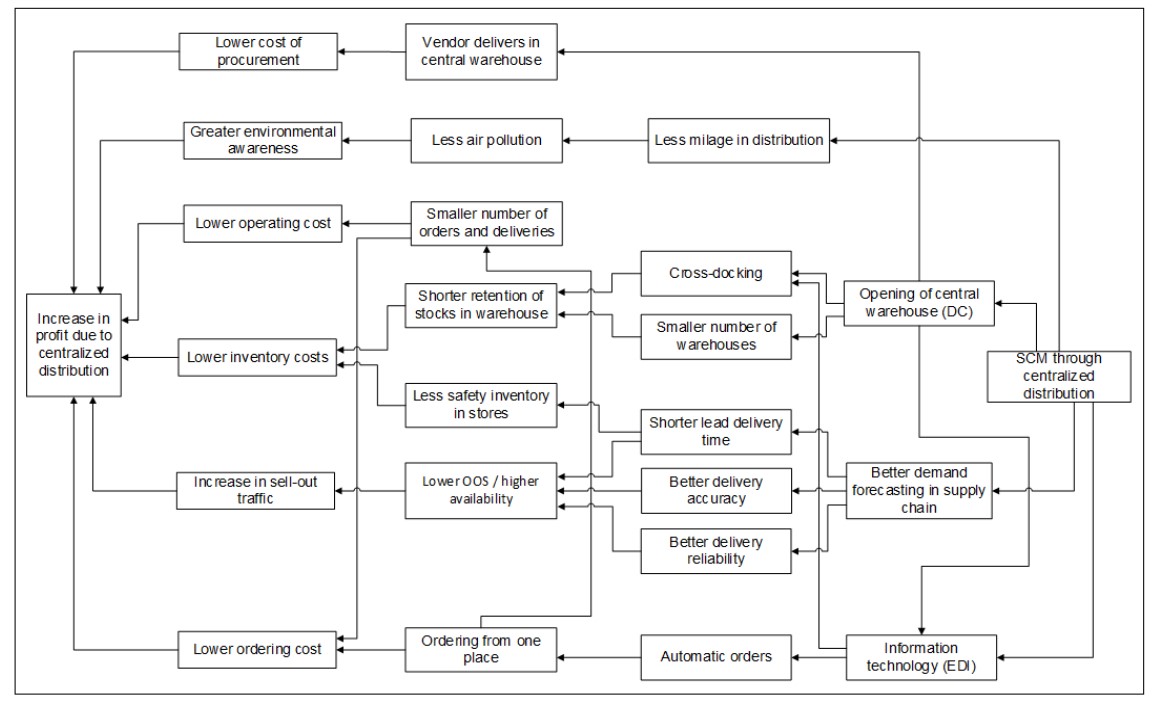
As a result of conducted interview with retailers and previous literature review, the causal map has been developed (Figure 4). This causal map identifies and presents retailers’ causal pattern in structure of decisions towards changing distribution system from DSD to CD.
Fig. 4: Causal map Moving to centralized distribution from retailers’ perspective
Source: author’s work
Survey of supplier’s relations towards centralized distribution as part of the supply chain management
In-depth interviews with retailers’ suppliers were conducted on the basis of the same interview guidelines presented in Table 1. Six in-depth interviews were conducted, with suppliers of food products in Croatia: two large food manufacturers, two small food manufacturers and two suppliers from multinational distribution companies. Based on the interviews conducted, the following eight factors were identified that cause or affect the increase of the supplier’s profits due to the switch from DSD to the CD:
greater security of long-term cooperation with a retailer,
lower commissioning (order picking) cost,
lower cost of order processing,
lower warehouse cost,
lower cost of transport,
lower cost of safety stocks,
greater ecological/environmental awareness,
increase of sell-out traffic (turnover in the retailer’s outlet realized by the end customer).
For each of these factors, an additional number of factors causing them (two to three factors) have been identified. It can be said that the overall impression after the interviews conducted is significantly different than after interviews with retailers. In fact, while retailers are more than enthusiastic about the idea of a CD, as well as convinced of the great benefits it brings to retailers and the overall supply chain, this is not entirely the case with suppliers. On the one hand, a part of the retailers’ suppliers was satisfied with the implementation of the CD and its current effects. But there are also suppliers who are not entirely contented with the CD – partly because of changes in their operations, but partly because of the changes for the entire supply chain. Some suppliers even claim that this form of distribution is worse for the final consumer than DSD distribution model.
One of the topics that occurred much more often in interviews with suppliers than with retailers was cooperation.
“Without trust there is nothing, especially supply chain management!” – a supplier from a group of multinational companies.
Emphasizing the need for trust as a basis for improving relations and cooperation in supply chain management is truly commendable. While some suppliers emphasize trust in CD and generally in supply chain management as something they have already achieved with the retailer as well as a basis for building long-term cooperation, certain suppliers look at CD as a result of lack of trust in supply chain management (i.e., they point out how change from DSD to the CD was initiated due to the lack of retailer’s trust in the supplier).
The key positive side of CD is the reduction of certain direct operating costs. One of the statements of a large supplier confirms a reduction in the cost of transport:
“The cost of transport is evidently smaller, both in kilometres and in kilometres per unit.”
Suppliers no longer transport goods to each retail store, but to only one place – retailer’s LDC. Besides that, shipments now consist of considerably larger quantities of homogenous goods.
Special progress in reducing costs is seen in the cost of order processing, as now, for the same or similar quantities, fewer orders are received and only from one place (usually from retailer’s headquarters). Suppliers also notice certain advantages of joint work on improving CD.
“Solely as a result of cooperation in the supply chain, we have provided our customers with an extra day with product before its expiry date. This is especially important if the product has had 3 days to the end of the deadline when it came to the store – in some ways, in that segment, we increased the customer service level by as much as 25%! “
– supply chain manager from large food manufacturer.
This statement refers to activities that accelerated the distribution – specifically through the work on prepacked cross-dock distribution, as part of the CD. The goods are commissioned at supplier’s facility according to store order quantities and then in the retail’s LDC directly transported from inbound to outbound truck. This shortens the time needed for cross-docking activities in the retail LDC, whereby the product comes in the store even faster (the delivery lead time is also shortened).
There are also process and organization changes in other aspects of suppliers’ business. One small food manufacturer also points out that changes due to CD can be used in the sense of greater turning towards the final customer:
“It took some time for us to reorganize and realize that we now have additional unused capacities, including time. Today we focus on product quality, and we are even more thinking about the final consumer.”
When it comes to downsides of CD, probably the most outlined issue for suppliers is OOS on retailers’ shelves. All 6 suppliers emphasize the desire to eliminate OOS. However, 4 suppliers, think that in CD system there is even more OOS situations than in DSD distribution.
“I’m afraid that this kind of centralized distribution is not good for consumers – we notice far too much out of stock.” – large food manufacturer.
Suppliers also have complaints about an automated order, because it results in a fact that store manager cannot order directly from supplier (or only in exceptional cases). They believe that the manager, as a person at the store who is closest to the buyers, had the opportunity to best estimate future demand and in cooperation with supplier’s sales representatives to make better demand forecast that will not lead to product unavailability.
All the causes of decrease of the supplier’s profit due to the switch to the CD are:
distribution coverage costs,
reduced sell-in traffic,
the availability of supplier products to a small number of retailers of “X”,
disallowance of ordering by a sales representative,
employee reorganization costs,
more frequent out of stock situations at retailer’s store.
Based on this part of research, causal map of suppliers’ perspective of moving from DSD to CD is made (Figure 5).
Fig. 5: Causal map Moving to centralized distribution from suppliers’ perspective
Source: author’s work
Conclusion
As an answer to research question 1(What are the retailer’s reasons for changing the distribution system from DSD to CD?), it can be concluded that they are numerous, and could be divided in three categories:
lower costs – procurement, operating, inventory and ordering costs,
increase in sell-out traffic – due to higher availability/lower OOS,
environmental aspect – less air polution due to less milage.
In Figure 4, all causes of these factors are presented, and their joint root cause lies in the fact of changing distribution system model from DSD to CD. These results mainly coincided with previous research results, but this paper gives clear root cause analysis and their interconnection.
Another general conclusion is that CD is better choice for retailers with smaller number of stores and for retailers whose stores represent bigger retail formats. On the other hand, DSD is more suitable for retailers with lots of stores that are smaller formats.
When it comes to research question 2 (What are the supplier’s reasons for changing the distribution system from DSD to CD?), factors influencing this decision could be divided in three categories:
fulfilling retailers’ requirements for ensuring long-lasting successful cooperation with a retailer (as the main channel for distribution of their products to end customer),
It can be concluded that positive sides of changing to CD model for supplier exist, but negative factors still probably prevail. Large manufacturers feel that a CD is either not sufficiently monitored or is not performing well in the back of the supply chain (shop) or is simply not a good model when compared to DSD. In general, suppliers feel lack of control over supply chain as they are earlier losing control over physical flow of their products.
Some of the supplier’s dissatisfaction may also be attributed to the reluctant change of the existing situation, fear of new processes, and the need for partial reorganization. Although these are understandable reasons, if they are the only problem, positive business operations and the success of the entire supply chain will reduce the impact of these reasons. Reasons for dissatisfaction that certainly need to be deeply analysed by retailers are possibly lower levels of product availability and more often OOS situation that cause the reduction of sell-out traffic.
The main limitation of research raises from relatively small number of interviews conducted in only one country. Further research could be extended to other countries of Central and Eastern Europe. Additionally, rankings of satisfaction or dissatisfaction factor could be done as a recommendation for improving relations in supply chain regarding the distribution system, with general aim of improving the overall supply chain performance.
Acknowledgment
This paper is developed as a part of project titled “Analysis of the impact of operational activities on the distribution process efficiency”, No KCiSI1/17, Poznan School of Logistics 2017-2019, founded by Polish Ministry of Science and Higher Education
Armstrong, D. J. (2005): Causal Mapping: A Discussion and Demonstration, in Narayanan, i D. J. Armstrong (Ed.): Causal Mapping in Information Technology, Idea Group Publishing Inc.
Bryson, J. M., Ackermann, F., Eden, C., & Finn, C. B. (2004). Visible thinking: Unlocking causal mapping for practical business results. John Wiley & Sons.
Claesson, F., & Hilletofth, P. (2011). In-transit distribution as a strategy in a global distribution system. International Journal of Shipping and Transport Logistics, 3(2), 198-209.
Das Nair, R. (2019). The spread and internationalisation of South African retail chains and the implications of market power. International Review of Applied Economics, 33(1), 30-50.
Dujak, D. (2012). Retail Supply Chain Management through Centralized Distribution. Business Logistics in Modern Management, 12, 47-59.
Fernie, J., & Sparks, L. (Eds.). (2018). Logistics and retail management: emerging issues and new challenges in the retail supply chain. 5th Edition, Kogan page publishers.
Finger, R., Hirsch, S., & Lanter, D. (2018, July). Profitability of Firms in EU Food Retailing. In 2018 Conference, July 28-August 2, 2018, Vancouver, British Columbia (No. 277105). International Association of Agricultural Economists.
Fuchs, D., Kalfagianni, A., & Arentsen, M. (2009). Retail power, private standards, and sustainability in the global food system. Corporate power in global agrifood governance, 29-59.
Ghosh, R., & Eriksson, M. (2019). Food waste due to retail power in supply chains: Evidence from Sweden. Global Food Security, 20, 1-8.
Goetschalckx, M. (2009): Distribution System Design. in Taylor, G. D. (Ed.): Introduction to Logistics Engineering, CRC Press, Taylor & Francis Group.
Hill, A. V. (2009). An overview of mapping tools for process improvement, Whitepaper, Clamshell Beach Press.
Hill, A. V. (2009). Causal Mapping, Whitepaper, Clamshell Beach Press.
Milićević, N., Grubor, A., Đokić, N., & Avlijaš, G. (2018). Retail Out-of-stocks in the Context of Centralized and Direct Delivery. Promet-Traffic&Transportation, 30(1), 105-114.
Narayanan, V. K. & Fahey, L. (1990). Evolution of revealed causal maps during decline: A case study of Admiral, In A. Huff (Ed.), Mapping strategic thought, John Wiley & Sons., London.
Nelson, K. M., Nadkarni, S., Narayanan, V. K., & Ghods, M. (2000). Understanding software operations support expertise: A revealed causal mapping approach. Mis Quarterly, 475-507.
Neuninger, R. (2019). The effect of concentration of retail power on the specialist knowledge of retail staff in the food and beverage sector: A case study of wine retail. In Case Studies in Food Retailing and Distribution (pp. 25-36). Woodhead Publishing.
Shriram, H. (2011). Perfecting the supply chain to gain market share, Smart Logistics , p. 38-40.
Wood, S. (2013). Revisiting the US food retail consolidation wave: regulation, market power and spatial outcomes. Journal of Economic Geography, 13(2), 299-326.
Životić, I.M. and Pešić Radovanović, Lj.S. (2013). Setting up centralised distribution, 1st Logistics International Conference – LOGIC 2013, Ed. (Vidović et al.) University of Belgrade, Faculty of Transport and Traffic Engineering.