A Study on the Effects of Quality, Price, Environmental Value and Perceived Behaviour Control towards Intension to Accept Electricity Demand Side Programs; A case study of Qatar Kahramaa
Samar Abdulrazzaq Mohammed AL-GHALEBI1, Zainon Mat SHARIF2, Ahmed Saleh Ahmed Saif AL-SHAMERI3, Saba’a Saleh Ahmed SAIF4 and Saleh Ibrahim Mohammed AL AAMRI5
1,2University Tenaga Nasional, Malaysia
3University Tun Hussein Onn Malaysia, Malaysia
4Sana’a University, Yemen
5The University of Queensland
Volume 2021,
Article ID 619799,
IBIMA Business Review,
16 pages,
DOI: 10.5171/2021.619799
Received date: 23 September 2020; Accepted date: 9 February 2021; Published date: 7 June 2021
Cite this Article as:
Samar Abdulrazzaq Mohammed AL-GHALEBI, Zainon Mat SHARIF, Ahmed Saleh Ahmed Saif AL-SHAMERI, Saba’a Saleh Ahmed SAIF and Saleh Ibrahim Mohammed AL AAMRI (2021)," A Study on the Effects of Quality, Price, Environmental Value and Perceived Behaviour Control towards Intension to Accept Electricity Demand Side Programs; A case study of Qatar Kahramaa", IBIMA Business Review, Vol. 2021 (2021), Article ID 619799, DOI: 10.5171/2021.619799
A prevalent problematic issue spreading nowadays among the global community is the increasing demand of electricity, and Demand Side Management programs are suggested to be the best method for reducing the demand of electricity. Nevertheless, implementing such technologies is still an issue because the behavior of customers is different from one region to another, and the applicability of such technologies largely depends on the perceptions and the acceptance level of that specific region. Therefore, the current quantitative study was conducted to investigate the variables that affect the intention to accept the demand side management programs among the KAHRAMAA employees in Qatar; namely, attitude, quality value, price value, environment value and the perceived behavior control. The sample size of this study consisted of 294 questionnaires. The study used SPSS 22.0 for analyzing the results. The findings revealed that all the factors were having high mean values. The study also highlighted three main factors which do have an impact on the intention to accept demand side management programs which are quality value, environment value, and perceived behavior control. Besides, some recommendations have been provided for the future research and policy makers.
Since global societies rely heavily on the energy and energy management, enormous changes and technological advancement, like the Smart Grids, can bring many social changes (Ellabban & Abu-Rub, 2016). All countries, including Qatar, are threatened by the risk of energy resources depletion due to the increasing consumption of energy as a result of the unwise usage of electricity and the increasing number of population around the world (Al-Marri, 2018). As a result, future societies are going to depend on continuous innovation, creativity and transformation which are necessary to enhance the efficiency of their energy consumption (Afroz, Higgins, Urmee & Shafiullah, 2017). Demand side management is not a new concept, but it is growing globally because it is a good opportunity for integrating the renewables generation. The world has started to focus more on the demand side management (Alasseri, Tripathi, Joji Rao & Sreekanth, 2017). Due to the complexity of the demand side programs, the intention toward accepting these programs is being studied nowadays because they cannot be implemented without the acceptance of society individuals (Park, Hwang, Ko & Kim, 2017).
During the previous decades, the electricity infrastructure and supply have faced many difficulties due to the increasing demand resulting from the over-consumption of electricity by people in all regions of the world (Ferreira, Rocha & Araujo, 2018). This created the need for a more reliable power supply, which, in turn, has pushed policy makers to the perception of smart grids. The concept of demand side management was first used by the Electric Power Research Institute in the 1980s in a form of activities that utilities go through to reduce their energy consumption. EPRI carried out all these activities to maximize benefits, delay of investment, and enhancement of reliability (Gellings, 2017). The implementation of demand response programs involves many issues. According to (Behrangrad, 2015), in the past, the most difficult problem in implementing the DSM proliferation was the technological hurdles, however, these challenges have vanished with the technological advances in the area of smart grids.
The most influential factors that affect KAHRAMAA staff’s intention to accept and use electricity demand response programs are the staff’s attitude, quality value, price value, environmental value, and perceived behavior control. This intention is believed to be translated into actual actions based on many social theories and research. Staff’s intention is affected in many factors. For instance, good impressions will be formed in the staff’s mind about accepting electricity demand response programs when they believe that these programs have many values such as quality and price values. Moreover, there are concerns about energy consumption and the rising trend into the smart grids and technological advancement in the demand side management (Behrangrad, 2015). Thus, there is a need to examine the factors affecting the intention towards accepting such programs and to identify the impact of such factors on this intention.
Per-capita consumption of electricity in Gulf countries is one of the highest electricity consumption in the world because of the very high personal incomes, the need for air conditioning throughout the whole year, and the subsidies energy (Bayram, 2019). Petroleum reserves in Gulf countries represent about 41% of the oil in the world and 24% of the gas. Because of the prosperous economy in Gulf countries, the consumption of gas, water and energy is increasing. The rapid growth in the local demand of electricity is one of the most important issues that Gulf countries confront.
Because of the increased electricity demand during the peak time, summer-time, and people’s experience with electricity shortage, they started to focus on long-run solutions, like the solar energy which has been increasing significantly. Qatar is one of the Gulf countries. Qatar’s population is predicted to increase largely as a result of the high economic growth rate. This, in turn, will increase the demand for energy, including electricity. Al-Marri, Al-Habaibeh & Abdo (2017) stated that since energy prices are low, it is fundamental to increase the awareness and knowledge of people in order to decrease the waste of resources and maintain the sustainable energy and the secured economy for Qatar. Electricity consumption per person in Qatar is one of the highest in the world. A research published by Sahin, Bayram & Koc (2019) shows the rise in total energy consumption per capita of Resource-Rich Countries between 1973 and 2017 for many countries with China having the largest increase (750%), followed by Iran, Algeria, Oman and Iraq (490%, 450%, 390%, 390%). Although, Qatar was having relatively less increase, but it was still high that is almost near to 200%.
In Qatar, however, no much research or data about its domestic electricity consumption was found (Al-Marri et al., 2017). More than half of the electricity consumption (59%) is accounted by the residential sector (Bayram, Saffouri & Koc, 2018). The Qatari people’s intention should be changed to secure their future. Sahin et al. (2019) stated that Qatari people now do not consider the value of energy, and their electricity usage is more than they need because electricity is provided to them for free. Regarding the demand side management in Qatar, there are only energy efficiency measures in a form of a national program. This program was found in 2012 by the Qatari local utility company (Kahramaa). This program is called “Tarsheed”, an Arabic word that means “awareness”. This program was successful in reducing water and electricity per capita consumption (by 18% and 17% respectively) in Qatar by the end of 2017 (Al-Marri et al., 2017).
The studies on demand side management and demand response programs in Qatar are still limited. In this research, the authors tried to provide additional insights into the significance of using demand side management programs such as the incentive based program, for which, this study has elaborated and highlighted the main variables that can contribute to motivating people to reduce their electricity usage and maintain the sustainability of the environment. This will have a significant impact on the main stakeholders (including policy makers and energy users) involved in promoting the sustainable development of Qatar in the future, and will promote sustainable energy choices as part of the national development strategy. Two main objectives were developed for conducting this study as follows: (1) To determine the influential factors affecting the intention to accept the electricity demand side programs, (2) To examine the impact of the influential factors on the intention to accept the electricity demand side programs.
Literature Review
Much research has been carried out in many countries regarding the programs that can lower the electricity consumption. These studies have different reasons. Many studies indicated that these new technologies are very important to reduce the demand for the renewable energy, to protect the environment, and to reduce the electricity bill. In addition, many factors have been found to have an influence on the customers’ acceptance of these technologies. Out of the many researches in the related area, some of the literature related to this study is discussed here.
Lackes, Siepermann& Vetter (2018) conducted a study in Germany on drivers and barriers that influence the Direct Load Control’s (DLC) acceptance among the participants. This study was a quantitative study based on a survey distributed among 653 consumers. Fishbein’s Theory of Technology Acceptance Model was utilized to conduct this study. This study was based on the assumption that DLC is a great opportunity to handle the issue of the energy turnover. The findings showed that the environmental impact or value, the increased comfort and the price value are the main factors or drivers that affect the respondents’ attitudes to accept the DLC. On the other hand, the respondents’ attitudes to accept such technology were found to be decreased because of the loss of control, unprotected usage and the technical safety. The service provider was not found significant in influencing the respondents’ attitudes. However, trust was found to have a role in affecting the participants’ perceptions towards the DLC advantages and disadvantages.
Milchram et al. (2018) conducted another study on the acceptance of smart grid technologies, focusing on the moral values. The basis of this study is that smart grid technologies are the best solution to energy systems that are more sustainable; however, the implementation of these technologies is based on the social acceptance of such technologies. Thus, the study focused on the moral concerns among the literature review. The findings show that moral values work as both derivers and barriers for the acceptance of smart grids.
Another study was conducted by (Moser, 2017) in Switzerland on the perceived control and security concerns that affect the individuals’ acceptance of electricity load-shifting programs. The study stated that the public often reject the smart metering technologies because of the lack of control over their appliances and data security problems. Thus, this study embarked on studying the way these concerns influence the social acceptance of load-shifting programs. The findings show that the acceptance levels will decrease significantly when the customers feel that they have no control over their appliances. No findings were concluded regarding the factor of the data security concerns. Furthermore, the study suggested that there are serious concerns about controlling their appliances. Thus, more understanding of these issues will help producing more socially accepted programs.
Reka & Ramesh (2015) conducted a survey to analyze the demand response evolving in many countries. The study was a comparative study between different countries, and it showed a portrayal for many demand response programs in different countries with some details. The study elaborates the demand side management scenarios developed in many countries. In other words, the study focused on reviewing the implementation of DR programs and their effect in different countries. Moreover, the study analyzed the impact that demand response programs have on electricity demand reduction during peak hours, as well as their energy efficiency.
Parrish, Heptonstall, Gross & Sovacool (2020) defined intention as the person’s willingness or readiness to perform a certain behavior. It is considered as the antecedent of any behavior, so, it is what forms the behavior of an individual. It is the indication whether the individuals will accept and use the electricity demand side programs or not. Zhang, Xiao & Zhou (2020) defined intention as the individual’s willingness to purchase energy-saving appliances. The current study attempts to examine the KAHARMA staffs’ intention to accept and use the electricity demand side programs. Thus, in this study, the behavioral intention refers to the individual’s readiness and willingness to accept these programs. The perceived effectiveness and the perceived values were added to the TPB, so that the respondents’ intention towards the electricity demand side programs can be studied thoroughly. Intensions do not always result in the actual behavior. However, the probability of conducting the behavior is increasing when the intention is stronger (Römer, Reichhart & Picot, 2015).
Methodology
This study was conducted among the staff of the KAHRAMAA Company, Dawha, Qatar. The study followed the qualitative survey approach using online questionnaires. The population was KAHRAMAA staff, with a minimum sample size of 278. The data was collected from April to May 2020. The study adopted the random sampling, as it is the most suitable type of sampling for this current study. According to KAHRAMAA website, the total population of the KAHRAMAA staff is more than 3,000. Thus, the sample size for a population more than 3,000 at the 95% confidence level is 341 respondents (Taherdoost, 2016). The data was collected by the Five-point scale questionnaire. Then, the data is analyzed using SPSS version 22.0. Some tests were used to analyze the data such as; pilot study, reliability test, descriptive analysis, correlation analysis, and regression analysis.
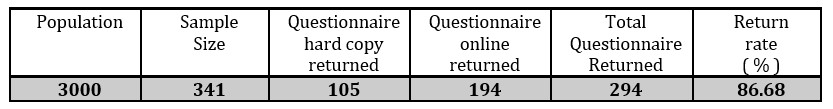
Two main methods were used in this research to collect the data. The first and main method was the hard copy questionnaires. A set of 170 hard copies were distributed at KAHRAMAA, out of which, 105 questionnaires were returned. The second method was the online soft copy questionnaires. A sum of 194 questionnaires was received from this method. Only 5 questions were not considered, because they showed that respondents did not answer them properly. Thus, the total number of questionnaires that were analyzed is 294 in total, which represents 86.21% return rate. The data and response rate are summarized in table 1.
Table 1: Questionnaire Return Rate
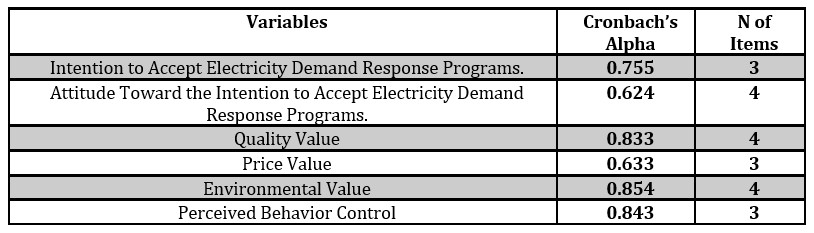
A pilot study has been conducted before the real distribution of the questionnaire. In this pilot study, 25 respondents participated to answer the questionnaire. The respondents were given the questionnaire with an introductory paragraph about the study, assuring the security of the respondents. The respondents were also asked to give their suggestions on how to enhance the questionnaire. The results were satisfying, which shows that the questions were understandable and relevant, assuring the validity of the scales. The generally agreed upon lower limit for Cronbach’s alpha is 0.70 as recommended by (Taber, 2018). Thus, the reliability of the pilot study shows satisfactory results ranging from 0.744 to 0.855.
Results and Findings
Reliability Analysis
Cronbach’s alpha is used in this study to measure the internal consistency reliability. Cronbach’s Coefficient Alpha is always used for the measurement of the reliability of questionnaire. Normally, it ranges between 0.0 to + 1.0. When it is higher, it reflects high degree or consistency. The results of the reliability of this study are presented in Table 2. The result of the Cronbach’s Coefficient Alpha for this study was 0.611, which is considered good.
Table 2: The Reliability Test of the Actual Study
Frequency Analysis of the Respondents’ Demographics
Frequency analysis is every essential in all the researches since it shows the frequency of the respondents’ answers for the questions. It is part of the descriptive analysis. In other words, it shows how many times the respondents selected certain answers.
Gender
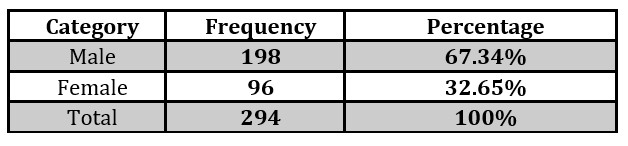
The gender information of the respondents is presented in Table 3. Based on the chart, it can be seen that 198 of the respondents participating in this study were males, whose percentage was 67.34% of the total percentage. On the other hand, the number of females participating in this study was 96 respondents, whose percentage was 32.65%. Thus, it can be concluded that male respondents were more than the female respondents in this study, as they were almost double the number of the females.
Table 3: Respondents’ Gender
Respondents’ Age
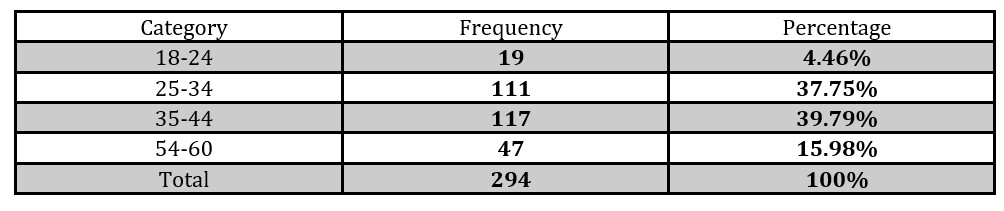
The respondents’ age was divided into three categories and the respondents were asked to choose one of these categories. The first category is for those whose age ranged between 18-24. The number of respondents from this category was 19, which account for only 4.46% of the total number. The second and the third categories were those whose age ranged between 25-34 and 35-44. Their percentages were almost similar as 37.75% and 39.79% respectively. The last category was those participants whose age ranged between 54-60, and their percentage was 15.98%. Thus, it is clear that the largest number of respondents were 35-44 years old. Table 4 summarizes the information of the respondents’ age.
Table 4: Respondents’ Age
Education Level
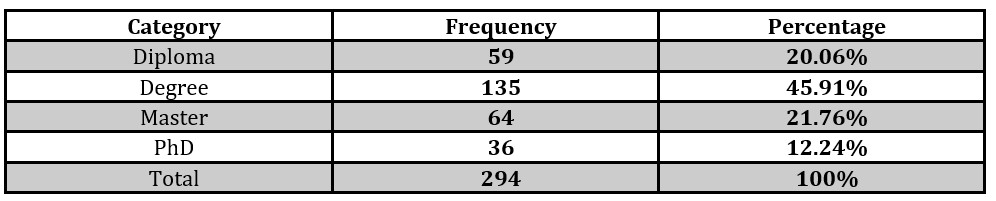
The respondents had, in the questionnaire, four education levels including diploma, degree, master, and PhD. The number of respondents having diploma was 59, which represents 20.06% of the total percentage. Those who have degree certificates were 135, accounting for 45.91% of the total number. The last two categories were those who have either master or PhD, and their numbers were 64 and 36, accounting for 21.76% and 12.24% respectively. Table 5 and Figure 6 Summarizes the information presented in this section.
Table 5: Respondents’ Education Level
Housing Condition
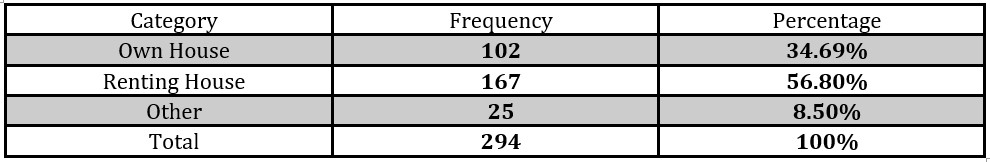
Housing condition refers to the respondent’s condition of the house he/she lives in, which can be his/her own house, renting house or others. First, the number of the respondents who live in their own house is 102, representing 34.69% of the total percentage. Second, the number of the participants who are renting a house was 167, which accounted for 56.50% of the total percentage. However, those who selected the “other option” were 25, and their percentage was 8.50%. The “other option” refers to those who are not having houses and are not renting houses. They could be living with their parents or other relative houses. In short, the majority of the respondents were renting a house. This is because of the fact that the employees of KAHRAMAA company come from about 35 worldwide countries (KAHRAMAA website, 2020). Table 6 summarizes this section.
Table 6: Respondents’ Housing Condition
Knowledge about Electricity Demand Response Programs
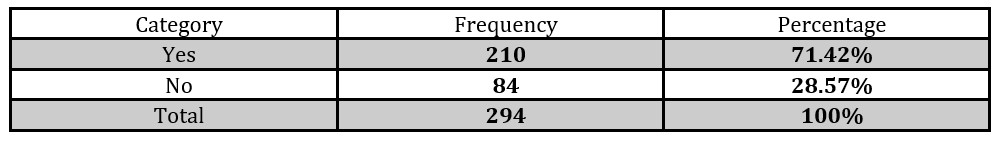
A separate section in the questionnaire was used to ask the respondents if they know about the electricity demand response programs. Interestingly, almost two thirds of the respondents answered “Yes”, representing 210 participants, with a percentage of 71.42%. This is a normal result since the respondents are working in an electricity company and have knowledge about this sector. On the other hand, only less than one third of the respondents answered “No”, representing84 participants with a percentage of 28.57%. In short, the number of the respondents who know about the electricity DRPs programs is much more than those who do not know about such programs. The information of this section is presented in Table 7.
Table 7: Respondents’ Electricity DRPS Knowledge
Descriptive Analysis
The traits and characteristics of the phenomenon or the individuals involved in the study are illustrated with the use of the descriptive analysis (Loeb et al., 2017). In other words, the descriptive analysis was used to help the researcher in presenting the characteristics of the gathered data in a quantitative way. Thus, the data was analyzed statistically. In this statistical descriptive analysis, many measures have been conducted including the measures of the variability (deviation, Kurtosis, and Skewness) and the measures of the central tendency (such as mean an median) in order to further fulfill the objectives of this study.
Findings’ First Objective
The first objective of this study was “To identify the influential factors affecting the intention to accept the electricity demand side programs”. This objective was first accomplished in chapter two with the use of the literature review. Nevertheless, this section will emphasize and highlight the importance of these factors and their influential levels on the intention to accept the electricity demand side management programs which will help reduce the demand and save the electricity. Five factors were identified in this study (attitude, quality value, price value, environmental value, and perceived behavior control). To achieve this objective, the mean analysis was effective to find the central tendency of the variables and establish their ranking and significance.
The variables of this study were measured by the use of the five-point Likert scale in the questionnaire. The scale starts with number one which means “Strongly Disagree” and ends with number five which means “Strongly Agree”. Therefore, if the mean of the variable is less than 2.32, it was considered as low. In addition, if the factor or the variable scored a mean value between 2.33 and 3.66, it was considered as average. Meanwhile, if the mean score is between 3.67 and 5.00, it was highlighted as high.
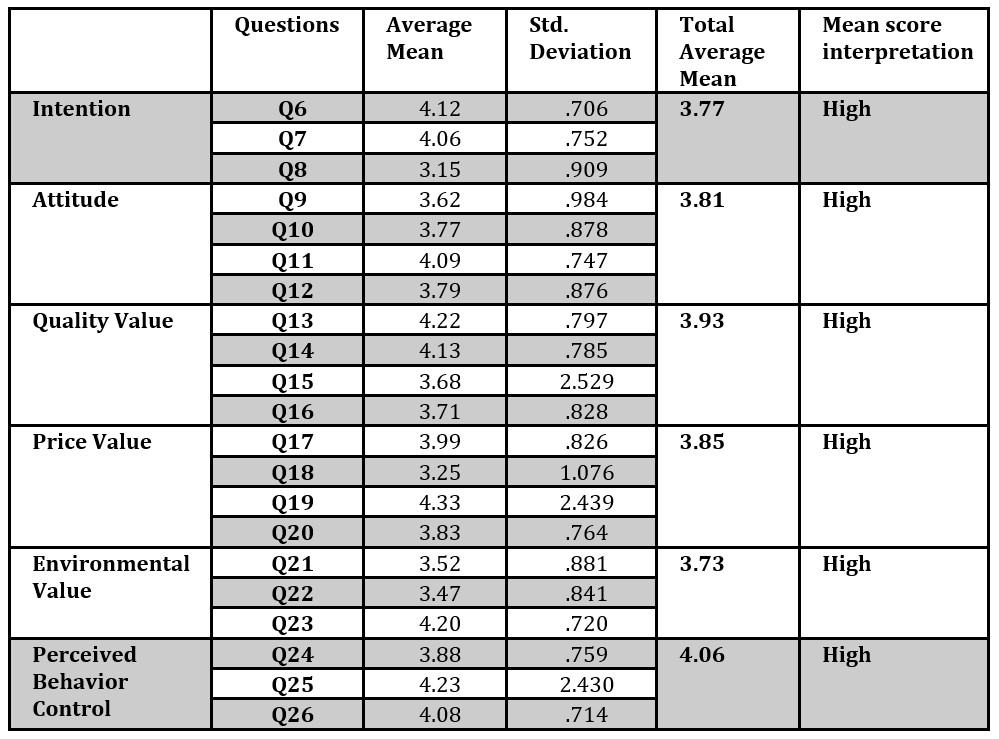
The results obtained though the mean analysis are depicted in Table 8. Overall, four factors were found to have high central tendency which are attitude, quality value, environmental value, and perceived behavioral control. However, price value was found to have an average central tendency in the analysis. Moreover, the standard deviations of the variables were also presented in table 8.
Table 8: Descriptive Statistics
Based on the statistics in Table 8, it is clear that the variables or the factors score high means. A closer look can show that the mean scores of the items were ranging from 3.15 to 4.33. Meanwhile, the table also shows the standard deviation of the items which ranged from .706 to 2.529. Standard deviation scores show the dispersion of the items from their standard. A good example is the standard deviation of Q6 which is .706, which shows that most of the respondents agreed on the statement.
The dependent variable of the study is the intention to accept Electricity Demand Side Management programs. Three statements were used in this variable to measure the respondents’ level of intention to accept the Electricity DRPs. These statements are; I think I am ready to accept any electricity demand response program, I will make every effort to reduce my electricity consumption by using demand response programs, and I have a great intention to use electricity demand response programs. The total mean score of this variable was high (3.77) with a standard deviation of (.789). This shows that the respondents have a high intention to accept the usage of the programs at their houses.
Regarding the factors affecting the intention to accept the Electricity DRPs, perceived behavior control scored the highest mean 4.06 (Std. Dev:1.301), followed by quality value 3.93 (Std. Dev:1.248). Meanwhile, Price value and attitude came next as they obtained mean values of (3.85 and 3.81 respectively), with standard deviations (1.276 and .871 respectively).
Thus, analytical and statistical analyses have been carefully conducted to achieve the first objective of this study which is to identify the factors affecting the intention to accept the electricity DRPs among the KAHRAMAA Employees. The results showed that all the factors influence the respondents’ intention with a different level of effect. Perceived behavior control was the most influential factor, scoring a mean value of 4.6. The second factor was the quality value because it scored a mean value of 3.93. The third factor was the price value with a mean value of 3.85. This was followed by attitude as it obtained a mean value of 3.81. The last factor was the environmental value which scored an average mean value of 3.73.
Findings’ Second Objective
The second objective of this study was to examine the impact of the five factors of the study (attitude, quality vale, price value, environmental value and perceived behavior control) and find the relationship between the intention to accept the electricity DRPs and these influential factors. This objective was achieved with the use of the correlation analysis and the regression analysis. Five hypotheses, which will be examined, are established under this objective. Before conducting the correlation analysis and the regression analysis, the normality analysis should be conducted to examine the normality of the distribution of the questionnaire. This will help determine which correlation analysis is effective to examine the relation between the variables.
Normality Analysis
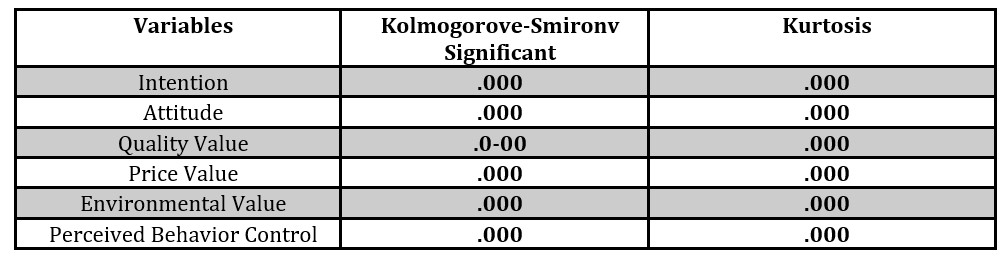
A normality test can be performed by analyzing the skewness and kurtosis. Skewness will show the symmetry of distribution, while kurtosis will show the peskedness of the data distribution. Table 9 presents the result of the normality analysis for all the variables.
Table 9: Normality Test
Since the sample of this research consisted of more than 200 questionnaires, Kolmogorov Smirnov was used to test the normality of the distribution. The result indicated that the data was not distributed normally because the significant values are less than 0.05.
Correlation Analysis
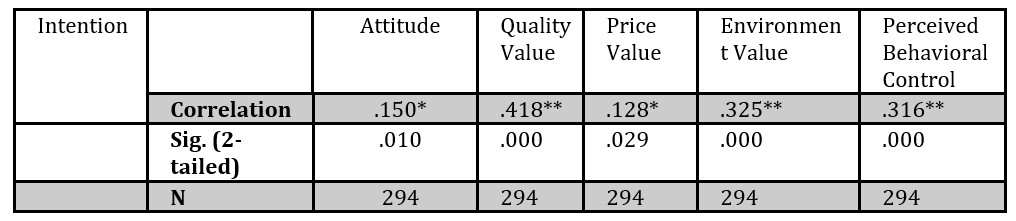
This analysis showed the correlation between the variables. Table 10 shows the statistical results of the correlation analysis. Generally, the results show that all the five variables are correlated to the dependent variable at 0.05 level because all the Sig. values are less than 0.5. It was noted that, at the 0.01 level, attitude and price value were not correlated to the intention to accept DRPs. The strength of the relation ranged between one variable to another. The strongest relation was found between Quality value and the intention to accept Electricity DRPs (.418). Meanwhile, the weakest relationship was found between the price value and the dependent value as the Sig. value for this factor was .128.
Table 10: The correlation results
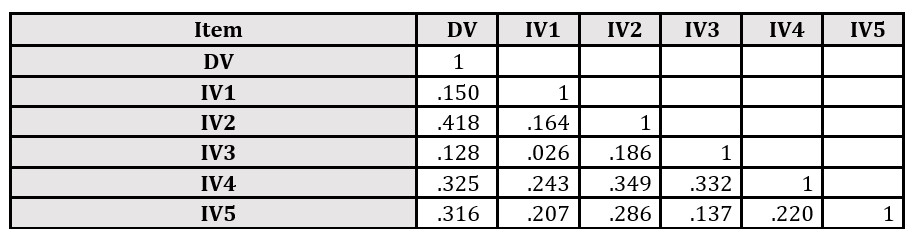
Table 11: depicts the Inter-Item Correlation matrix values of the variables. The values of the entire matrix were positive, which indicates that all the assessed items measured the same underlying attribute and that there is a relation between the dependent and the independent variable.
Table 11: Inter-Item Correlation Matrix
Regression Analysis
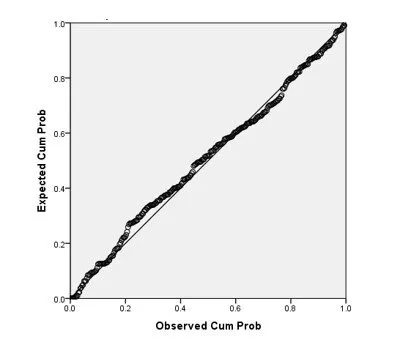
This section is devoted to conduct the regression analysis after the factor analysis and correlation analysis have been carried out. Correlation was used to test whether there is a correlation between the dependent variable and the independent variables. However, it is not enough to examine the impact of the independent variables on the dependent variable. Moreover, the correlation analysis showed the relationship between the variables, but it did not show the magnitude (how much) and the direction (positive or negative) of the relationship. Thus, the regression analysis was needed to examine the impact of the independent variables on the dependent variable in this study. Figure 1 shows the normal P-P Plot of Standardized Residual.
Figure 1: Normal P-P Plot of Standardized Residual
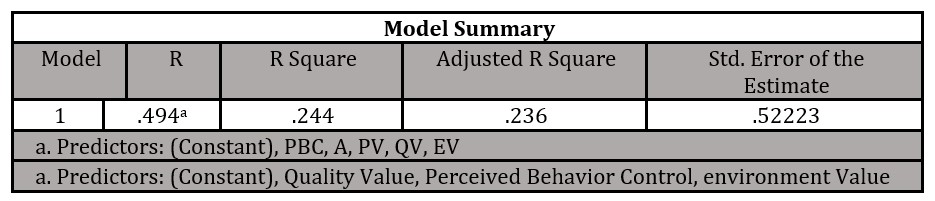
Table 12: Regression Analysis Model Summary
Table 12 shows the summary model of the regression analysis. Based on the data in the table, the R Square value is .244. This value denotes 24% of the changes in the intention to accept the electricity DSMP. Based on the regression, only three factors were included in the model as having an impact on the dependent variable, which are: quality value, perceived behavior control and the environment value. Meanwhile, two factors were excluded, which are: attitude and the price value.
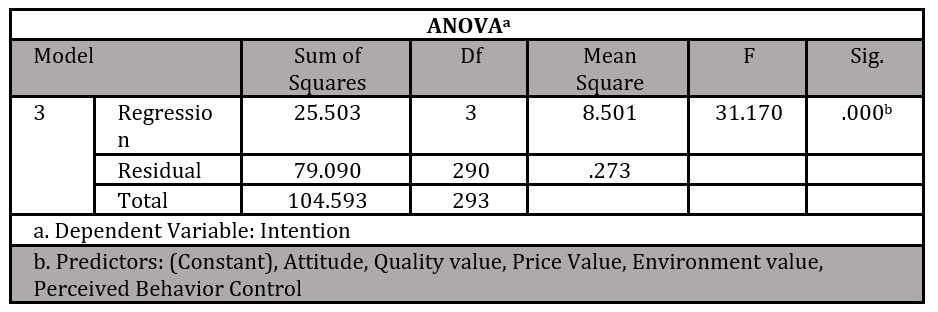
Table 13: Regression ANOVA
Table 13 depicts the ANOVA information of the regression analysis. The overall significance of this model is shown in this table. According to the table, the Sig. value of the model is .000, which is less than 0.05. This indicates that the model and the data represented by the model are significant. In addition, this Sig. value of .000 illustrates that a satisfactory level has been accomplished by the model in representing the variance of intention to accept the electricity DRPs toward the other five independent variables in this study. Thus, the results of this study are significant, and the study has been successful in predicting the relation and the impact of the independent variables on the intention to accept the electricity DRPs at a satisfactory level.
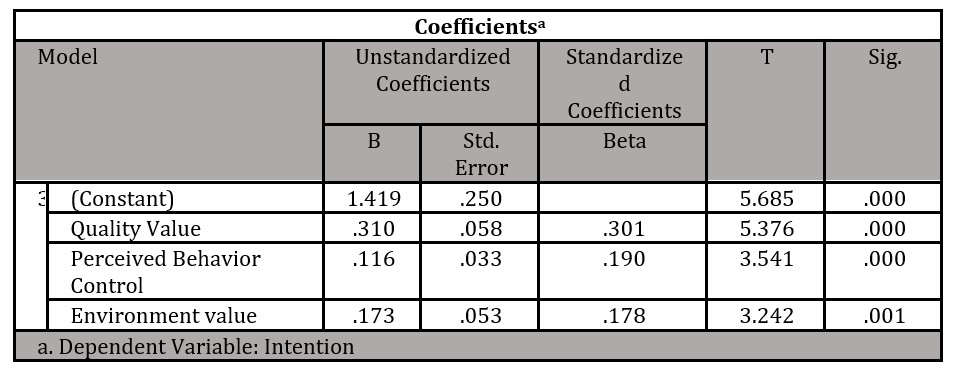
Table 14: Regression Coefficients
The results of the regression analysis of the relationship between the variables, which shows the impact of the independent variables on the intention to accept DSMP, are presented in Table 14. According to the table, the T values of the independent variables are as follows: quality value (5.376), perceived behavior control (3.541), and environment value (3.242). In addition, the results showed that the respondents’ intention to accept DRPs is affected only by quality value, environment value, and perceived behavior control because the Sig. value of these factors is as follows: .000 for quality value, .000 perceived behavior control, and .001 for the environment value. On the other hand, attitude and price value were found to have no impact on the intention to accept DRPs, and were excluded by the model.
To further illustrate the impact of the independent variables, a closer look is needed at the standard coefficients (B). It is clear that the percentage of the impact of the quality value on the intention to accept the DSMPs is the highest, as the B value of this factor is .310. The impact of quality is positive as the value of the quality increases by a value of 1 (every unit of change of quality will result in a 3.10% in the intention to accept the DRPs). Thus, when the quality value increases the intention will increase. This was followed by the environment value, as its B value was .173. In addition, the B value for perceived behavior control was .116. Thus, it is clear that all the three factors selected affect the intention toward accepting the demand side management programs.
Conclusion
This study carried out regarding the factors affecting the intention of the staff at KAHRAMAA company toward the acceptance of the demand side management programs. Five factors were studied which are attitude, quality value, price value, environment value, and perceived behavior control. All the factors scored high mean values, and all the factors were correlated with the intention to accept DRPs. However, only quality value, environment value and perceived behavior control were found to have an impact on the respondents’ intention to accept SRPs, while attitude and price value were found to have no impact on their intention. In short, this study has presented great results and discussion as a reference for policy-makers to promote the most promising DRPs in Qatar based on the factors affecting the residents’ intention to accept these programs. The results can also be used by other countries with similar characteristics for forming the best policies and enhancing the sustainability and development of the power operation systems in Qatar.
The first main limitation is the limit of the scope. This study was conducted among the staff of KAHRAM company. Thus, the results may not be generalized and might not be applicable to the other places in QATAR. Besides, only five factors were studied in this research. Therefore, the study is not inclusive. The third limitation is the short time devoted to complete this study which resulted in some of the abovementioned limitations. Nevertheless, the study has followed a scientific and systematic process to conduct all the steps of the formal research, starting from the study background, identifying objectives, collecting and analyzing the data and finally discussing the results and the findings.
The application of DRPs differs from one country to another for different reasons. Based on the findings of this study, it is recommended that policy makers should focus on the quality of the technology used in the application of the DRPs as well as raising the awareness of the residents on the benefits of the DRPs and how it will reduce the environmental pollution and save the oil resources. Besides, residents should also be knowledgeable of the usage of these programs. Moreover, future research should be on a wider scope to include a bigger population size to be able to generalize the results. In addition, more factors should be studied under this area.
Afroz, Z., Higgins, G., Urmee, T., & Shafiullah, G. (2017). Technological Advancement of Energy Management Facility of Institutional Buildings: A Case Study. Energy Procedia, 142, 3088–3095. https://doi.org/10.1016/j.egypro.2017.12.449
Al-Marri, W. (2018). An investigation of sustainability awareness and residential energy consumption in Qatar. Nottingham Trent University.
Al-Marri, W., Al-Habaibeh, A., & Abdo, H. (2017). Exploring the Relationship between Energy Cost and People’s Consumption Behaviour. Energy Procedia, 105(0), 3464–3470. https://doi.org/10.1016/j.egypro.2017.03.793
Alasseri, R., Tripathi, A., Joji Rao, T., & Sreekanth, K. J. (2017). A review on implementation strategies for demand side management (DSM) in Kuwait through incentive-based demand response programs. Renewable and Sustainable Energy Reviews, 77(April), 617–635. https://doi.org/10.1016/j.rser.2017.04.023
Bayram, I. S. (2019). Non-intrusive Electricity Sub-metering in Selected Households in Qatar. 2019 UK/China Emerging Technologies, UCET 2019, 1–4. https://doi.org/10.1109/UCET.2019.8881848
Bayram, I. S., Saffouri, F., & Koc, M. (2018). Generation, analysis, and applications of high resolution electricity load profiles in Qatar. Journal of Cleaner Production, 183, 527–543. https://doi.org/10.1016/j.jclepro.2018.02.084
Behrangrad, M. (2015). A review of demand side management business models in the electricity market. Renewable and Sustainable Energy Reviews, 47, 270–283. https://doi.org/10.1016/j.rser.2015.03.033
Ellabban, O., & Abu-Rub, H. (2016). Smart grid customers’ acceptance and engagement: An overview. Renewable and Sustainable Energy Reviews, 65, 1285–1298. https://doi.org/10.1016/j.rser.2016.06.021
Ferreira, P., Rocha, A., & Araujo, M. (2018). Awareness and attitudes towards demand response programs- A pilot study. 2018 International Conference on Smart Energy Systems and Technologies, SEST 2018 – Proceedings. https://doi.org/10.1109/SEST.2018.8495804
Gellings, C. W. (2017). Evolving practice of demand-side management. Journal of Modern Power Systems and Clean Energy, 5(1), 1–9. https://doi.org/10.1007/s40565-016-0252-1
Lackes, R., Siepermann, M., & Vetter, G. (2018). Turn it on! – User acceptance of direct load control and load shifting of home appliances. 26th European Conference on Information Systems: Beyond Digitization – Facets of Socio-Technical Change, ECIS 2018.
Loeb, S., Dynarski, S., McFarland, D., Morris, P., Reardon, S., & Reber, S. (2017). Descriptive Analysis in Education: A Guide for Researchers. NCEE 2017-4023. National Center for Education Evaluation and Regional Assistance.
Milchram, C., van de Kaa, G., Doorn, N., & Künneke, R. (2018). Moral values as factors for social acceptance of smart grid technologies. Sustainability (Switzerland), 10(8). https://doi.org/10.3390/su10082703
Moser, C. (2017). The role of perceived control over appliances in the acceptance of electricity load-shifting programmes. Energy Efficiency, 10(5), 1115–1127. https://doi.org/10.1007/s12053-017-9508-5
Park, E. S., Hwang, B. Y., Ko, K., & Kim, D. (2017). Consumer acceptance analysis of the home energy management system. Sustainability (Switzerland), 9(12). https://doi.org/10.3390/su9122351
Parrish, B., Heptonstall, P., Gross, R., & Sovacool, B. K. (2020). A systematic review of motivations, enablers and barriers for consumer engagement with residential demand response. Energy Policy, 138(December 2019), 111221. https://doi.org/10.1016/j.enpol.2019.111221
Reka, S. S., & Ramesh, V. (2015). A smart survey on demand response potential in global energy market. Indian Journal of Science and Technology, 8(May), 474–483. https://doi.org/10.17485/ijst/2015/v8iS9/55411
Römer, B., Reichhart, P., & Picot, A. (2015). Smart energy for Robinson Crusoe: an empirical analysis of the adoption of IS-enhanced electricity storage systems. Electronic Markets, 25(1), 47–60. https://doi.org/10.1007/s12525-014-0167-5
Sahin, E. S., Bayram, I. S., & Koc, M. (2019). Demand side management opportunities, framework, and implications for sustainable development in resource-rich countries: Case study Qatar. Journal of Cleaner Production, 241, 118332. https://doi.org/10.1016/j.jclepro.2019.118332
Taber, K. S. (2018). The use of Cronbach’s alpha when developing and reporting research instruments in science education. Research in Science Education, 48(6), 1273–1296.
Taherdoost, H. (2016). Sampling methods in research methodology; how to choose a sampling technique for research. How to Choose a Sampling Technique for Research (April 10, 2016).
Zhang, Y., Xiao, C., & Zhou, G. (2020). Willingness to pay a price premium for energy-saving appliances: Role of perceived value and energy efficiency labeling. Journal of Cleaner Production, 242, 118555. https://doi.org/10.1016/j.jclepro.2019.118555