Lyudmila V. OVESHNIKOVA1, Elena V. SIBIRSKAYA2, Galina D. SLEPNEVA3 and Olga G. LEBEDINSKAYA4
1,2,4Plekhanov Russian University of Economics, Moscow, Russia
3Adidas CIS, Moscow, Russia
Volume 2020,
Article ID 515342,
Journal of Eastern Europe Research in Business and Economics,
14 pages,
DOI: 10.5171/2020.515342
Received date: 1 October 2019; Accepted date: 23 November 2019; Published date: 3 March 2020
Academic Editor: Georgiy Greyz
Cite this Article as:
Lyudmila V. OVESHNIKOVA, Elena V. SIBIRSKAYA, Galina D. SLEPNEVA and Olga G. LEBEDINSKAYA (2020)," Spatio-Temporal Analysis of The Development of The Transport System: Russian And Foreign Experience", Journal of Eastern Europe Research in Business and Economics Vol. 2020 (2020), Article ID 515342, DOI: 10.5171/2020.515342
The effectiveness of the functioning of the transport system is one of the most important factors in the growth of the economies of countries which is manifested in the intensity of the development of economic relations, the transport hubs, the mobility of the population and goods. The transport system creates the conditions for the growth of labor productivity, development and production efficiency, and distribution and consumption forming a highly competitive state economy. The aim of the work is presenting a comprehensive study of the development indicators of the countries’ automobile transport system. The study is based on the structural and dynamic analysis, the use of the Logistics Performance Index (LPI), the analysis of transport safety, and the length of roads and passenger traffics which reflect on the level of automobile infrastructure development. The scientific novelty of the work lies in the substantiation of theoretical guidelines for the transport system study of the various countries using special methods. The proof of scientific novelty is the applicability of research methods to the domestic and foreign economies specifying comparability of indicators in cross-country comparison. The level of length, density and structure of roads, as well as transport costs in various countries of the total GDP are estimated using a number of indicators which reflect the position of the country’s transport system and the effectiveness of its functionality. The study has a multidimensional nature including an analysis of Russian and foreign experiences in the development of the transport system, as well as cross-country comparisons between several special indicators.
JEL Classification Codes: N71·N73· O5
Keywords: Transport System, Analysis, Road Safety, Freight and Passenger Traffic.
Introduction
The experience of Russia and some foreign countries shows that the development of the transport system determines the intensity of economic ties and is one of the most important conditions for the development of the country’s economy. Active growth of the state economy can be limited and even stopped by infrastructural restrictions, which are based on low quality roads and low throughput of infrastructure facilities. (Golovanova L.A., 2017).
A special attention in foreign countries has been paid to the modernization of transport infrastructure in recent years. Its development is one of the ways of economic growth, which is manifested in the intensity of functioning of economic relations, transport hubs, mobility of delivery and other services. Thus, comprehensive studies of its condition with the subsequent identification of priority tasks and development directions are of particular relevance.
Materials and methods (materials for usage, description of the subject area, methods and techniques of research)
The methodology of the study is based on a comprehensive study of the indicators of the transport system of Russia, Germany and the USA, it’s also based on statistical structural and dynamic analysis, the construction of new performance indicators, and the research of complex indicators reflecting the level of development of the countries transport systems.
The integrated tools, including general and special research methods, are used in this study. General research methods are found on the use of logical, expert, graphic and economic-statistical methods of information processing. Special research methods include the study of the indicators of the length of roads, the number and average age of buses in the car fleet, the bus passenger traffic and the passenger mobility, the passenger tension, the number of registered (owned) cars per 1000 people of the country’s population, the road safety, and the share of workers employed in the transport sector.
The information and empirical base of the study includes legislative and regulatory documents of federal significance, data from the Federal State Statistics Service, the official website of the Main Directorate for Road Safety of the Ministry of Internal Affairs of Russia (STSI), and information portals of State programs – Eurostat data for Germany (Database Eurostat) and the United States (Bureau of transportation Statistics). The results of the work are also based on data obtained in the process of independently conducted author’s research and conclusions made.
The study of the world’s transport systems in comparison with the transport system of the Russian Federation is concerned with the fact that indicators in different countries are collected and named differently. In this regard, eleven key indicators were selected, with the help of which it is possible to assess the state of the transport system of Russia, Germany and the USA and which coincide in content.
To justify the choice of countries for the study, authors turned to the international logistics efficiency index LPI (Logistics Performance Index). This index is calculated from 160 countries every two years by the World Data Bank. LPI is based on a worldwide survey of local operators (global freight forwarders and courier carriers) which provides feedback on the “friendliness” and satisfaction of the operation of the transport systems of countries. Operator reviews are complemented by quantitative data on the effectiveness of key components of the supply chain in the country of work. Thus, the LPI consists of both qualitative and quantitative indicators and helps to compile logistic friendliness profiles for these countries. (World Bank, 2019).
According to the LPI 2018, Germany came in the first place – the country that has been the world leader in the efficiency of the transport system since 2014. In the same LPI ranking of 2018, the United States ranks the 14th – a country that is comparable in area and population to Russian Federation (US area – 9 629 091 km2, RF – 17 125 407 km2; population to 01.01.2019 USA – 372.2 million people, RF – 144.5 million people). In 2018, the Russian Federation took 75th position in the LPI rating. For this reason, Germany, USA and Russia were chosen for analysis.
The Results
The first indicator directly characterizing the position of the country’s transport system and the effectiveness of its functioning is the length of roads. The length of roads in the United States is the longest over the entire study period, which is explained by the relatively large territory, comparing with Germany, and the greatest development, comparing with Russia, since the USA has three places in the world ranking in terms of the US territory. The area of the United States is 1.74 times smaller than the territory of Russia. Analyzing the statistical data, it is found that for the study period, from 2005 to 2017, the length of roads in the United States increased by 253.99 thousand km (3.95%), while in Russia, over the same period, 3 times more roads were built, the absolute increase in highways amounted to 808.00 thousand km, which is 94.17% more as of 2005. In Germany, there is a negative trend of roadway reduction, so in the period from 2005 to 2017, the length of road communications decreased by 2.33 thousand km, the growth rate was -1.06% (table 1).
Table 1: The length of roads in the Russian Federation and other countries for the
period from 2005 to 2017
Source: Bureau of transportation Statistics, Eurostat, Federal State Statistics Service of Russian Federation
On average, over the studied 13 years, the length of roads in Russia and the USA grew annually by 67.33 and 21.17 thousand km, respectively. In relative terms, this increase amounted to 5.69% and 0.32%. In Germany, an insignificant annual decrease in the tracks of the roadway was recorded with less than 1% (-0.09%).
The above figures reflect the positive trend of increasing roads in Russia, according to this indicator, the dynamics of the development of the Russian Federation in comparison with the dynamics observed in the USA and Germany for the study period is the best.
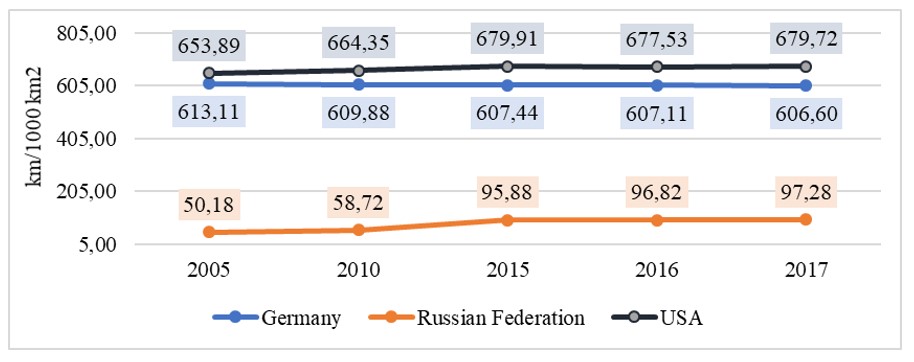
To compare the length of roads with the area of the studied countries, an indicator of the density of paved roads was calculated. So, it is clear that in Germany and the USA almost the maximums of their areas were used for the construction of new roads. For the period from 2005 to 2017, per 1000 km2, the territories of Germany and the USA accounted for 613.11 km to 679.72 km, which is about 12 times more than the density of roads in Russia in 2005.
Fig. 1: The roads density in countries for the period from 2005 to 2017, km/1000 km2
However, according to the data presented in Figure 1, by 2017, such a significant gap was reduced in 2 times, and the density of Russian roads in 2017 amounted to 97.28 km per 1000 km2 of the multi-million territory of the Russian Federation. Every year, on average, the density of communications for land transport in Russia increased by 3.93 km per 1000 km2 versus 2.15 km per 1000 km2 in the United States with an annual decrease in Germany by 0.54 km per 1000 km2. Thus, the length and density of roads lead the United States and Germany.
In America, there is a division of roads into federal (federal), interregional (state) and local destination (municipal – local). In Russia, roads are divided into public and non-public roads. In turn, public roads are divided into federal, interregional and local roads. In Germany, there are only two types of roads: federal (state roads) and inter-regional (between the lands – provincial roads), which already include local roads.
In order to ensure comparability of data, non-public roads were included in the federal roads of Russia, and local roads in inter-regional roads. The inter-regional roads of the United States of America included local roads.
Studies have shown that German roads are not characterized by a high degree of structural difference between 2005 and 2017. By calculating the three coefficients of structural differences, the identity of the structures for the specified period was revealed.
Analyzing 2005 and 2017, one can note a decrease in the total length of US federal roads by 4,741.03 thousand km and an increase in the length of interregional roads in combination with local roads by 4,995.08 thousand km (an increase in the structure of the total length of roads – by 0.43 percentage points). On average, about 416.26 thousand km of new streets and interstate roads were built per year (fig. 2).
The tendency to reduce federal roads in favor of increasing the share of interregional roads also applies to the Russian Federation. The index of structural differences named V.M. Ryabtseva showed a significant level of structural difference — 0.2244 (Table 2). The percentage of interregional roads over the specified period increased by 15.04 percentage points that this change is caused by the reduction of non-public roads, and their possible transition to general use. Over the studied 13 years, the length of non-public roads decreased by 118.00 thousand km, annually decreasing by about 4.52% (fig. 2).
Fig. 2: The roads structure in Germany, the USA and Russia for the period from 2005 to 2017
The United States of America is characterized by a similar ratio of federal highways and roads within the states. The percentage of federal roads in this country is slightly higher than in Germany and is about 20%. Strong structural differences for the period are also not observed (table 2).
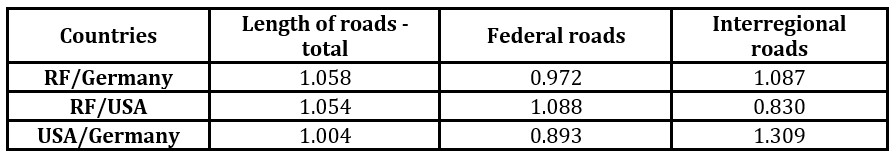
Table 2: Indices of structural differences of roads in 2017 compared to 2005
Federal roads in Russia were built 8.78% faster, during the study period, then federal roads in the United States. However, inter-regional highways were 16.98% slower to build. In relation to Germany, interregional roads in the Russian Federation were built faster by 8.67% (table 3).
Table 3: Advance (deceleration) coefficients by indicators of the countries of the world for the period from 2005 to 2017
Regarding the length of roads in general, Russia is the leader in terms of speed of road construction, it is 5.78% ahead of Germany and US 5.35%. The Russian Federation is developing at the fastest pace.
An analysis of the citizen mobility in the studied countries is associated with the condition of buses and cars. Note that in Germany, the smallest number of buses was recorded, in addition, over the years, it only decreased by about 372 units per year (by 0.45%). In the Russian Federation and the USA, the number of buses fluctuated during the period at a comparable level. Since 2005, the number of buses in both the United States and the Russian Federation increased in 2017 by 23.06% and 13.13%, respectively. In addition, in 2010, the number of buses in Russia exceeded the number of buses in the United States (fig. 3).
Fig. 3: Dynamics of the buses number in the countries for the period from 2005 to 2017
The collected statistics allow us to distribute buses in Russia, Germany and the United States into three age groups: under 5 years old, 5.1-10 years old, over 10 years old. Consider the age structure of the bus fleet in Germany and Russia and answer the following question: Due to what the number of buses in Germany has decreased over the 13 years studied but increased in Russia, on the contrary? The share of buses over 10 years increased in 2017 compared to 2005 by 1.60 percentage points and this group of buses is the largest among those studied. In 2017, of the total bus fleet in Russia – 48.60% were buses over the age of 10 years, 26.10% – at the age of 5.1 to 10 years, and 25.30% – buses that were recently commissioned, up to the age of 5 years. Thus, we can conclude that the number of buses in Russia grew mainly due to a long-term operation, and new buses for the studied period of time arrived in a smaller volume than was required to update older buses.
In addition, over the 13 years under study, the share of “new” buses up to 5 years old increased, from 32.13% to 36.05% (by 4.37 percentage points), due to decommissioning buses older than 10 years, as buses of the “middle” age also decreased by 1.34 pp. This is a positive trend for vehicle upgrades. It follows that the German bus fleet was shrinking due to the decommissioning of old buses.
The United States bus fleet is distinguished by its young generation of vehicles. So, from 2005 to 2012, the average age of buses in the United States did not exceed 7.66 years. At the beginning of the study period, however, as at its end, among the analyzed three countries, buses in America were the newest.
The condition of the buses will certainly affect the passenger turnover of this type of transport (Jiancheng Weng, Xiaojian Di, Chang Wang, Jingjing Wang and Lizeng Mao, 2018). Bus passenger traffic in the United States has changed significantly from 2005 to 2017, which is not observed in Germany and Russia. At the end of the study period, 602 683 million pass-km were transported to the United States, which is 8.04% more than in 2016 and 2.53 times more than at the beginning of the period. A high “jump” in passenger turnover was recorded in 2007 compared to 2006, an increase in the passenger flow of buses by 263,830 million pass-km (2.14 times). On average, US buses transported 475,579 million pass-km annually; the variability is estimated at 113,303 million pass-km.
In Russia, bus passenger traffic grew more slowly than in the United States from 2005 to 2017 by 8.54%. By 2017, 123,400 million passenger-km were transported by Russian buses, which is 13.28% less than at the beginning of the study period. The root-mean-square deviation from the average in Russia by the studied indicator for the period is estimated at 9580 million pass-km. In addition, there is a decline in the activity of Russians moving on buses, as the average annual passenger turnover was reduced by 1,575 million pass-km (1.18%). In Germany, there is an increase in passenger traffic by buses, so the absolute increase over 13 years, starting in 2005, amounted to 10 705 million pass-km, and the relative increase was 14.71% (fig. 4).
Fig. 4: Dynamics of buses passenger turnover of the world countries for the period from 2005 to 2017
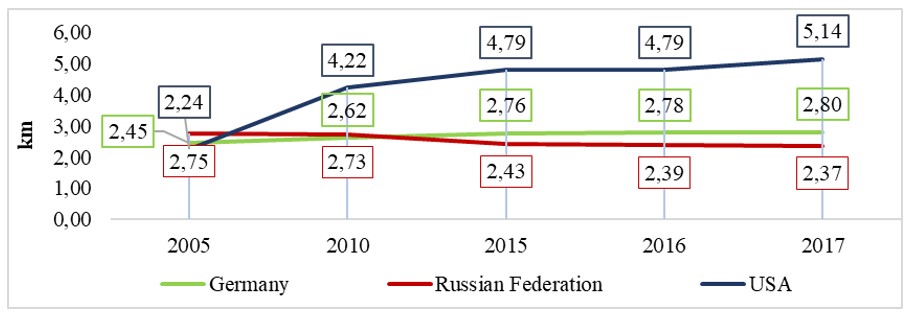
It is not entirely correct to focus on high US values on this indicator, because both Germany and Russia are primarily inferior in terms of population, which directly depends on how many citizens will be able to cover a certain distance by bus. The efficiency of the bus system in the country will be shown by the “Passenger Mobility” indicator. This indicator reflects how many kilometers a day a resident of a given state travels on average.
It is worth paying attention to the US indicators, since Russia is the world leader in terms of area, and America occupies only 4 place. Nevertheless, the mobility of US residents is almost 2.5 times higher than in Russia at the time of 2017. Russia was not always an “outsider” and in 2005, on average, every Russian traveled by bus for approximately 2.75 km, and for comparison, over the same period, every American covered a distance of 2.24 km. However, over time, the situation of Russian mobility worsened, and so we can see a decline to 2.37 km per day in 2017. Indicators in Germany are close to ideal, since the country is small in terms of area and population, but the mobility of its inhabitants is quite large and over time, it only increases; growth in 2017 was 14.22% compared to 2005 (fig. 5).
Fig. 5: Dynamics of residents’ mobility in relation to the use of buses of the countries for the period from 2005 to 2017, km per day by 1 person
The indicator of mobility of people allows you to assess how much people are able to move and how far, especially for Russia, where settlements are located quite far from each other. Continuing the theme of mobility, we analyze the passenger turnover of all countries. In relative terms, the Russian Federation is leading with an annual passenger growth rate of 1.42% compared to 0.45% in the United States. However, studying the median value, the indicator for Russia is far behind. In Germany, during the study period, the entire passenger flow can be divided into 2 parts, where one is more than 990,374 million pass-km and the other is less, while in Russia the median is 512,200 million pass-km, which is almost 2 times less than in Germany, given the fact that the German population is on average 1.75 times smaller than in the Russian Federation, and this is another confirmation that the transport system of the Russian Federation requires improvements (table 3).
Table 3: Statistical indicators of the total passenger turnover in the countries for the period from 2005 to 2017
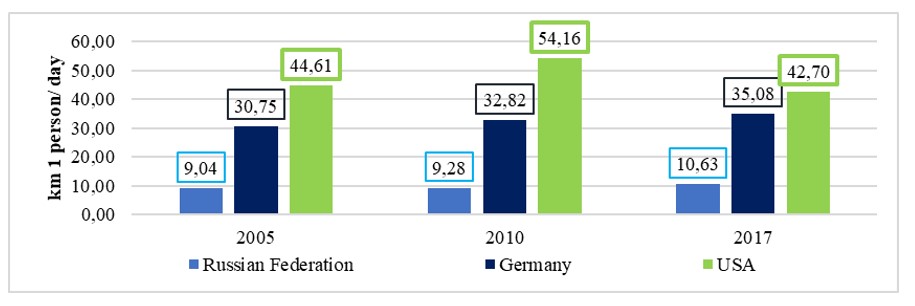
If the mobility of passengers in relation to bus transport in the Russian Federation decreased, then the mobility of Russian residents as a whole, for the study period from 2005 to 2017, increased by 5.67 km per day, and in the USA, on the contrary, it decreased by 1.89 km per day by one person. Passenger mobility in Russia grew 0.26% faster than in Germany, and 1.73% than in the United States. In America, the mobility of people who used transport in this country fell by 0.36% annually (fig. 6).
Fig. 6: Dynamics of passenger mobility in relation to the use of transport in the countries of the world for the period from 2005 to 2017, km per day by 1 person
The distance that Russians overcome by state transport and personal transport is gradually growing, given that the use of buses is falling, it follows that the inhabitants of our country prefer to get their own cars or completely different types of transport (rail, air).
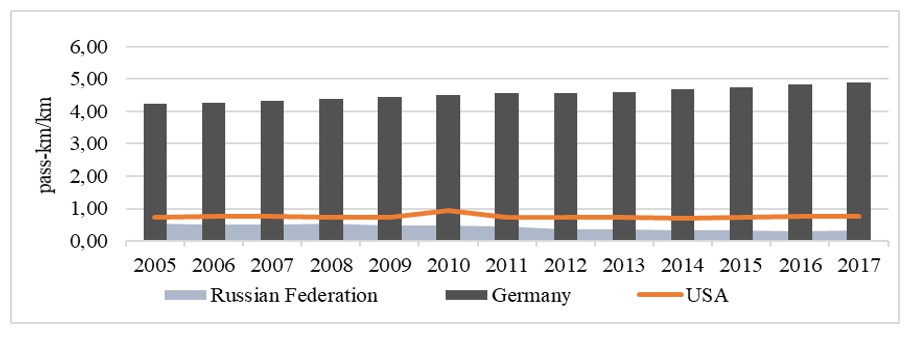
With the help of passenger traffic, you can analyze the passenger intensity, which will determine the possibilities of increasing the throughput and carrying capacity. Germany is the leader in this indicator, the average value for the period from 2005 to 2017 was 4.53 pass-km / km, which indicates a high degree of use of the country’s automobile road transport network.
Intensive operation of the German road surface can lead to complications in the operation of transport in this section of the network, since there is no reserve for passing additional vehicles. From this point of view, the situation in the United States is more positive, it is obvious that vehicles in this country move freely, the average passenger tension over the period was 0.43 pass-km / km. However, it is worth noting that a too small value of this indicator indicates the inefficiency of using the road section and can serve as a basis for closing this direction (La fabrique de la cite, 2019). Passenger traffic tension in Russia is also characterized by an insignificant load – in 2017, the value of the indicator amounted to 0.34 pass km / km, which is 0.22 km / km less than in 2005 (fig. 7)
Fig. 7: Dynamics of passenger tension in the world for the period from 2005 to 2017
Such a low value of passenger tension in the Russian Federation can be caused by the fact that the majority of the country’s population and, as a result, most vehicles are concentrated in central regions of Russia and in large cities where distances are not long.
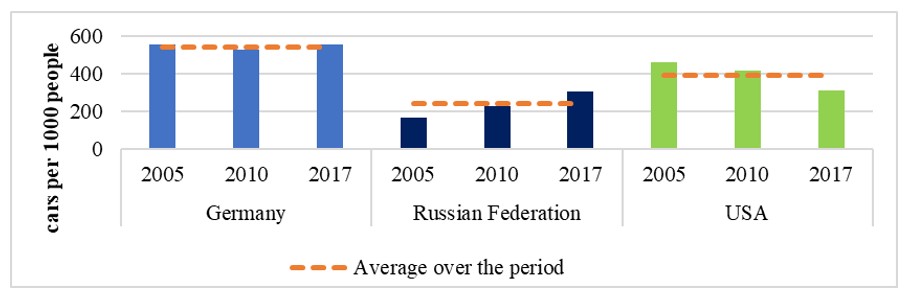
In addition to buses, a popular means of transportation on roads are cars. According to the obtained values, in the Russian Federation, there is a gradual increase in cars per 1000 population, the annual increase for the study period was 4.75%, or 11 cars per 1000 population. By 2017, the number of cars reached 305 units per 1000 population, an increase compared to 2005 is estimated at 81.12%. During the studied period of time in Germany, the number of cars did not change significantly and was approximately at an average level – 542 cars per 1000 population of the country. Since the beginning of 2005, the number of cars has been noticeably decreasing (2.39% annually) and by 2017, the number of cars per 1000 population was 313 units, which is only 2.59% higher than the same indicator in the Russian Federation for the same period (fig. 8).
Fig. 8: Dynamics of the number of cars per 1000 population in the countries of the world for the period from 2005 to 2017
An important aspect in the successful functioning of the transport system is the safety of roads along which vehicles travel (Trofimets E.N., Soshnikov M.V., 2018). To assess the quality of roads, indicators on the number of car accidents and the mortality rate on roads were studied.
In the USA, for the period from 2005 to 2017, the largest number of deaths in car accidents was recorded. Despite the fact that there is an increase in the number of deaths in 2017 compared to the period in 2010, when it was registered below the average level of deaths (36,429 people per year) for the studied 13 years – 32,999 people, on an annual average ,victims of fatal accidents in the United States decreased by 1.35% (by 546 people). A similar dynamic in the decrease in the death is observed in Russia and Germany. In Russia, by 2017, the death toll was also noted below the average – 19 100 people, as well as in Germany for the same period – 3 979 people (fig. 9).
Fig. 9: The number of people killed as a result of accidents on highways of the world for the period from 2005 to 2017
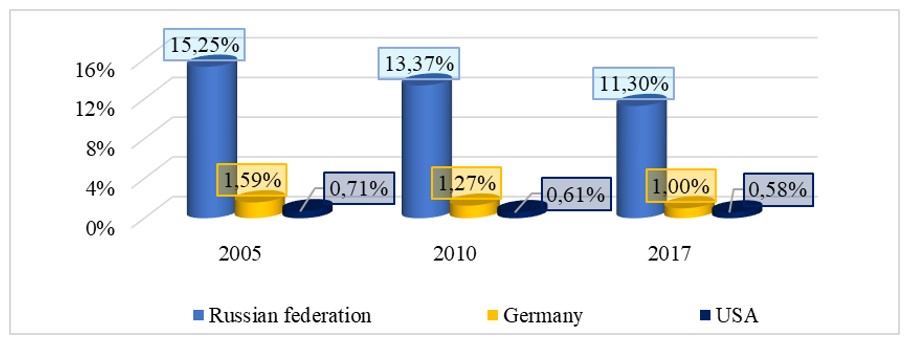
According to the mortality rate on the roads, analytical data allow us to conclude that among the selected countries, the greatest probability of an accident with a fatal outcome is in the Russian Federation (Yushkov V.S., Ovchinnikov I.G., Pugin K.G., 2018). So in 2005, 15.25% of accidents recorded in Russia claimed the lives of people, that is, for every 100 accidents, there were approximately 15 deaths. In comparison, in Germany, the similar indicator in 2005 was 1.59%, that is, only 1 death per 100 traffic accidents, while in America, road deaths are estimated to be even lower – 0.71%, which suggests that deaths of motorists on the roads are extremely rare among every 100 accidents. Over the next 13 years, the situation has changed, but not significantly. It has become safer to drive on roads in Russia – about 11 people now fall into 100 accidents, which is 25.87% less than in 2005, but still much more than in Germany – 11.29 times more than in the USA – 19.34 times. The mortality rate in Germany fell by 0.59 percentage points, while in the United States it fell by 0.12 percentage points. By the way, in a recent interview, German Federal Minister Andreas Scheyer stated that Germany has the safest roads in the world (The Local.de, 2019) (fig. 10).
Fig. 10: Mortality on the roads of the world countries for the period from 2005 to 2017
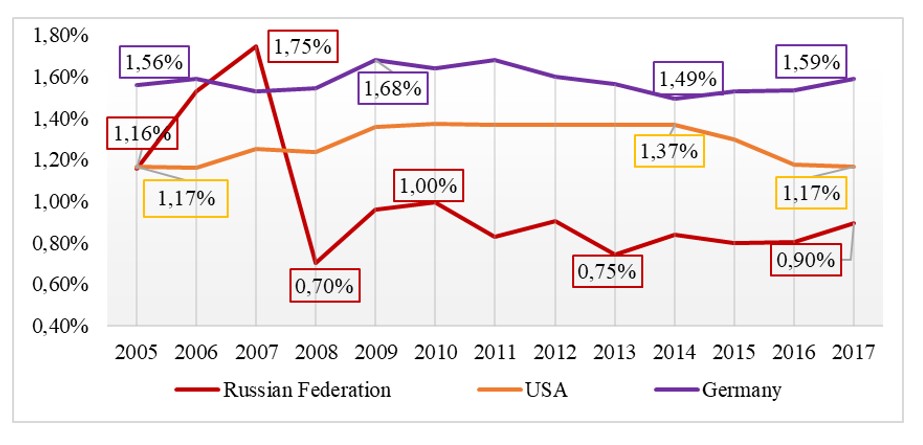
The state of the Russian Federation invests quite large sums of money in the development of transport, this is evidenced by the positive growth in the share of expenses of the consolidated budget on transport of the total GDP of the country. Since 2013, progressive growth has been noted: from 0.75% to 0.90% in 2017. Comparing between the figures for Germany and the United States, it should be noted that during the study period, the share of state investment in the development of transport was not very variable. (fig. 11).
Fig. 11: Dynamics of the country’s consolidated budget expenditures share of the total GDP for the period from 2005 to 2017
The range of the variation for Germany is 0.19 percentage points, for America – 0.21 percentage points. In Russia, this indicator is fixed at 1.04 percentage points. Moreover, in Germany, the state spends more on transport than in other countries; 1.36 times more than in the United States and 1.78 times more than in Russia in 2017.
Conclusion
Summarizing, on average between 2005 and 2017, in Russia and the USA, the length of roads annually increased by 5.69 and 0.32%. The bus fleet of the Russian Federation needs even more modernization, the purchase of new buses in today’s volumes is insufficient to reach the level of the leading countries in the world in providing transportation of citizens. In Russia, the level of auto-ownership is growing faster than in Germany and in the USA.
Analytical data allow us to conclude that among the selected countries, the Russian Federation is most likely to have a fatal accident. To increase the degree of safety on Russian roads, it is necessary to pay attention not only to the establishment of an optimal speed regime, but also to the quality of the roadway, infrastructure near the tracks, and an increase in the level of literacy of motorists.
The reduction in the workforce of the transport sector is observed in all three countries, but in the Russian Federation at the fastest pace.
The solution to the problem of improving the quality of roads in the Russian Federation should be of primary importance, which will ensure the development of road transport services, an increase in the standard of living and the well-being of the population and road safety.
The experience of developed countries of the world shows that the presence of an extensive network of transport infrastructure contributes to the rational use of the existing resource, economic and social potential of the territories through the effective implementation of transport and economic ties. Significant investments, removal of infrastructure restrictions, technological modernization of transport, as well as the development and implementation of promising transport plans, guided by the priority tasks of the economy and society, are required to solve the problem of forming a developed transport system of the country.
References
Are Germany’s autobahns really the safest highways in the world? ‘The Local.de’, [Online], [Retrieved June 15, 2019], https://www.thelocal.de/20190201/are-germanys-autobahns-really-the-safest-highways-in-the-world
Bardal A.B., Gritsko M.A., Halikova S.S., Khvan I.S. (2018), ‘Measurement of accessibility of transport services in the Far East’, Power and Management in the East of Russia, 12 (1), 12-13.
Dyachenko I.L., Zelenkina E.V., (2018), ‘Digital transformation of the economy and digitalization of road transport infrastructure’, Bulletin of the RMAT, 4, 51-61.
Eurostat (2019), ‘The official database of European Union statistics’. [Online], [Retrieved July 5, 2019], https://ec.europa.eu/eurostat/web/transport/data/database
Rosstat, (2019), ‘ Transport of Russian Federation’, [Online], [Retrieved July 5, 2019], https://www.gks.ru/
Jiancheng Weng, Xiaojian Di, Chang Wang, Jingjing Wang and Lizeng Mao (2018), ‘A Bus Service Evaluation Method from Passenger’s Perspective Based on Satisfaction Surveys’, A Case Study of Beijing, China. Sustanability, 10 (2723), 1-15
Kottasova, I. (2019), ‘Germany is opening its first electric highway for trucks’. [Online]. CNN Business. [Retrieved August 8, 2019], https://edition.cnn.com/2019/05/07/tech/e-highway-a5/index.html
Kovalenko N.V., Beznovskaya V.V., Melnikov V.V. (2017), ‘Current trends in the development of the Russian Federation road complex’, Road. Infrastructure, 3, 2-3
Combe C., Maisonneuve C. (2019), ‘La fabrique de la cite. Improving our understanding of traffic to improve our response: “It’s the economy, stupid!”. [Online], [Retrieved August 10, 2019], https://www.lafabriquedelacite.com/en/publications/improving-our-understanding-of-traffic-to-improve-our-response-its-the-economy-stupid
National Transportation Statistics (2019), ‘Bureau of transportation Statistics USA’, [Online], [Retrieved April 21, 2019], https://www.bts.gov/product/national-transportation-statistics
Pozdnyakov MN, Tsui M. (2018), ‘Management of bus traffic in transport hubs in China and Russia’ Proceedings the materials of the all-Russian Interdisciplinary Scientific Conference, 18-23 June 2018, Astrakhan, Astrakhan State Technical University, Russia, 79.
Rogavichene L.I., Gonchar M.P., Khakimov R.T. (2018), ‘Study of indicators of functional reliability of the driver’, Proceedings of the International Academy of Agricultural Education, 5 (4), 18-20
Speed limit on German autobahns (2019), ‘Overseas portal’, [Online], [Retrieved April 21, 2019], https://zagranportal.ru/germaniya/transport/avtobany-dorogi-germanii.htm
Trofimets E.N., Soshnikov M.V. (2018), ‘On the issue of solving the problem of ensuring safety on the roads of Russia’, Materials of the annual international scientific and technical conference of the security system. Academy of the State Fire Service of the Ministry of the Russian Federation for Citizens. Defense, Emergencies and Disaster Management Moscow, 2018, Moscow, Russia, 108-111
World economy (2019), ‘Germany – Roads, paved. Trading Economics’, [Online], [Retrieved August 5, 2019], https://tradingeconomics.com/germany/roads-paved-percent-of-total-roads-wb-data.html
Yushkov V.S., Ovchinnikov I.G., Pugin K.G. (2018), ‘The accident rate on the roads of Russia and abroad and the trends in the use of modern technical methods of improving safety’, Materials of the XII International scientific and technical conference of students, graduate students and young scientists. Volgograd State Technical University, 2018, Volgograd, Russia, 172-176