Cosmina Ștefania CHIRICU, Georgeta VINTILĂ and Ștefan Cristian GHERGHINA
The Bucharest University of Economic Studies, Romania
Volume 2021,
Article ID 212090,
Journal of Eastern Europe Research in Business and Economics,
10 pages,
DOI: 10.5171/2021.212090
Received date: 18 May 2021; Accepted date: 17 July 2021; Published date: 3 September 2021
Academic Editor: Adina Titei
Cite this Article as:
Cosmina Ștefania CHIRICU, Georgeta VINTILĂ and Ștefan Cristian GHERGHINA (2021)," Empirical Study Regarding the Correlation between the Fiscal Policy and Households Income in Estonia, Latvia and Lithuania ", Journal of Eastern Europe Research in Business and Economics Vol. 2021 (2021), Article ID 212090, DOI: 10.5171/2021. 212090
The main objective of the paper is to analyze the effects of fiscal policy (represented by taxes such as VAT, excises, personal income tax and net social contributions) on the inequality of households’ income in the three Baltic States. The selected explanatory variables (social – human development index, governance integrity; economic – government expenditure) cover the period between 2003 – 2019 with impact upon the Gini coefficient as dependent variable. The empirical evidence is based on the estimations of panel data regression models, highlighting the fact that indirect taxation leads to income inequality, together with social contributions which act as an incentive for the revenue disparity. Also, the factual results show that government expenditure is negatively correlated to income inequality. The paper assesses the impact of taxation on the social welfare of households by considering a robust scientific approach in an association of variables emphasizing on the successful performance of fiscal policies among Estonia, Latvia and Lithuania.
Keywords: Fiscal Policy, Income Inequality, Baltic States, Panel Data Regression Models
Introduction
The recent scientific approach in the analysis of the economic and social impact of the fiscal policy on the welfare of society in the Baltic States brings forward new traits that strengthen the positions of Estonia, Latvia, and Lithuania as the European States with a fulminating development in a historical context as post-Soviet members. In this respect, since the Baltic States have reclaimed their sovereignty from the Soviet Union, the countries have known a considerable success in the growth of economy, as well as in the rapid development of the social welfare. However, the financial crisis of the 2007 – 2008 has taken its toll on the economy in the Baltic area, and thus, all three States were faced with a serious economic decline short after. Surprisingly, the economies of the Baltic States have recovered in a quick manner, perhaps as a benefit of the three States being granted the access to the Euro Zone in 2011.
In this respect, the following study aims to emphasize the factors which best affect the social welfare in the Baltic area by estimating the impact level of an association of fiscal, social and economic related factors that make up for the explanatory variables of the model. The dependent variable is represented by the income inequality given by the Gini coefficient, developed in 1912 by the Italian statistician and sociologist Corrado Gini, and which measures the income inequality or the efficiency of the income redistribution among individuals. Furthermore, the empirical evidence is based on the econometrical analysis of a Panel data model, and with the view of obtaining a higher accuracy of the analysis, a correlation test is performed in order to verify which variables are inter-correlated. In this respect, the number of estimated equations, computed in accordance with the econometric model, is adjusted to seven. Therefore, considering the inequality of income as a dependent variable, a series of factors are taken into consideration, such as: the total VAT public revenues; excises and other consumption taxes; personal income taxes and social contributions as fiscal variables. Moreover, the Human development index (HDI) and the perception of corruption represent the social variables of the study while the government expenditure is the economic variable of control.
According to the recent average data given by the Gini coefficient, the trend in income inequality around Baltic States is of negative growth in Lithuania and Latvia, while in Estonia, a slight positive growth is visible. Moreover, the average values of the income inequality in the Baltic States are comprised between 38 points and 31 points with a significant difference of 6 points noticed between Lithuania and Estonia.
As regards the estimated values of the Gini coefficient, the World Bank publishes data on a yearly basis for the income inequality by measuring the extent to which income is redistributed among individuals and households. More precisely, the Gini coefficient is represented by a Lorenz curve that comprises the cumulative percentage of all income reported to the cumulative proportion of individuals, starting from the poorest to the richest. In this respect, the values of the coefficient vary between 0 (i.e., absolute equality) and 100 (i.e., absolute inequality).
This paper is structured in four main sections which comprise the following: the first section includes the literature review of the previous scientific research on the topic; the second section presents the methodology used and a descriptive approach of the variables; the third part includes the results together with their interpretation; and the last section of the study presents the conclusions.
Literature Review
The social impact of the fiscal policy on the income redistribution among households and individuals is based on the type of taxes applicable. By default, taxes that are regressive by nature, such as value added taxes and excises, tend to increase the inequality of the income redistribution (Albayrak, 2011; Drucker et al, 2017; Karabulut, 2020;Prasad, 2008). On the other hand, direct taxes are considered to equalize the income redistribution due to their progressive nature (Prasad, 2008). In this respect, researchers have estimated the impact of the fiscal policy on the income redistribution by analyzing the influencing factors of the Gini coefficient and by formulating solutions to minimize the negative effects given by the income inequality.
Also, during the last 20 years, specialists around the world have focused on the analysis of the income inequality and its effects on the social welfare of individuals. Certain studies have appreciated the phenomenon as a social segregation (Kozuharov et al. 2015) due to the loopholes in the modern economic systems identified among developing countries. Another scientific study, such as the one developed by Haughton and Khander (2009), is focused on the assessment of poverty and income inequality in international context while it brings forward recommendations for the audience and governments on how to better improve their fiscal and social policies. Karabulut (2020) states that direct taxation is efficient in the income redistribution while he claims that indirect taxes, such as value added taxes and special consumption taxes, are regressive and have negative social impact. Thus, his empirical evidence is based on an econometric model with two variables (i.e. Gini coefficient as dependent variable and total indirect taxes revenues as explanatory variable) on a series of data for Turkey during years 1990 to 2017. The author concludes that indirect taxation negatively impacts the poorer, and Turkish governments should focus as important objective the fair redistribution of income. Other two studies focused on the Turkish economy are developed by Albayrak (2011) and Bilgiç (2015), who focused on the analysis of the impact of fiscal policies on income redistribution while considering indirect taxes and the main explanatory variable. In this regard, Albayrak noticed that value added taxes and other consumption taxes have disturbant effects on the income redistribution as a result of the fact that any reduction in the tax rates stimulates the demand of goods on the market to the wellbeing of the richest. On the other side, Bilgiç (2015) did not find any link between indirect taxation and income redistribution, based on a simple regression estimated with the least squares method.
Drucker et al. (2017) focuses on testing the impact of taxation on the income redistribution in the OECD countries during the years 1975 – 2011 by using a Panel data regression. Their conclusions highlighted that consumption taxes may accentuate the income inequality and may also have positive impact on the economic growth, while Oboh and Eronmonsele (2018) state that indirect taxation has accentuated the income inequality in Nigeria during the years 1980 and 2014. Martinez et al. (2012) approached a regression panel data model with the view of determining the effects that fiscal policies and governmental expenditure have on the income inequality in 150 countries for a period of time between 1970 – 2009. According to the results, the personal income taxes proved to have positive impact, while consumption taxes and custom taxes have negative impacts on the redistribution of income. Prasad (2008) states that income inequality is seen as an association of taxes, services and social transfers by analysing, in a retrospective manner, the evolution of the income inequality and the way it was impacted by the changes occured at the level of national fiscal systems as well as how it was affected by the governmental expenditure in Latin America and OECD countries. Based on the results of the study, Prasad concludes that direct taxation leads to the equalisation of the income, while indirect taxation enhances the income inequality.
Ray (2019) has tested the possible correlation between the income inequality and the number of resident households which cannot afford to pay for the suitable heating of houses in the European Union member states, including Great Britain between 2009 – 2017. In this regard, the author estimates an econometric model with variables such as Gini coefficient, GDP per capita, number of days in which domestic heating is needed. Based on the least square methods that Ray applies, results demonstrate a strong bond between the variables and the author suggests the implementation of new macroeconomic policies in the European member states together with the improvement of energy policies. On the other hand, a study which includes a social variable is presented by Karakotsios et al (2020) who examined the possible connection between income inequality, taxation and fiscal freedom, with the help of empirical evidence of the causality relation between the variables. In this matter, the authors use a Panel data model estimated with the Pooled Mean Group method on a sample of 58 countries reviewed between years 1995 – 2016. Also, Baer and Galvão (2008) exposed the paradox of Brasil, where there is a high fiscal burden and a continuous concentration of income redistribution, by estimating the impact of governmental expenditure over the Gini coefficient and concluding a relatively low significance between these two variables.
Quantitative methodology
Sample selection and variables description
The analysis of the social impact that taxation exerts upon the income inequality is based on the evaluation of the effects that fiscal policies have upon individuals. As it has also been stated above, the dependent variable of the study is the Gini coefficient that measures the income inequality.
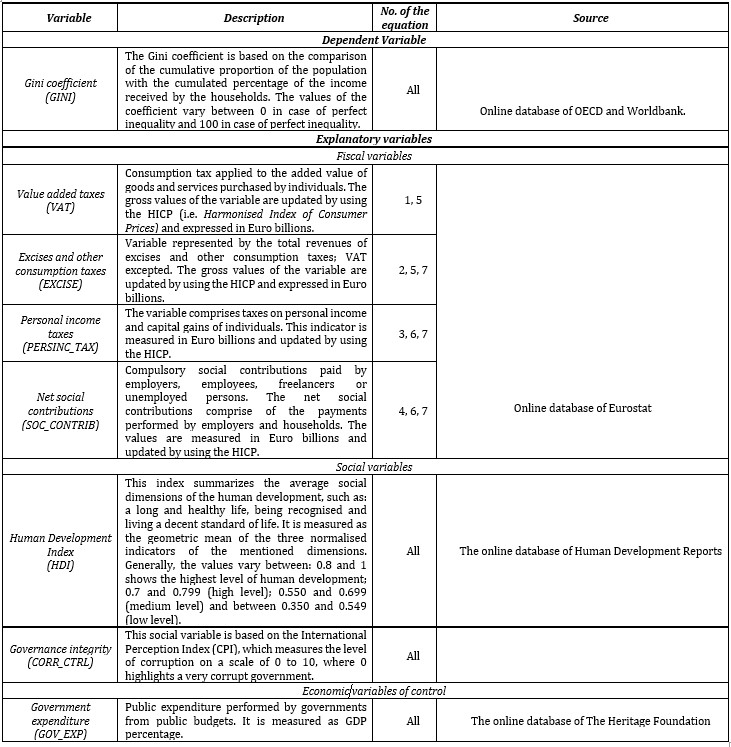
In this respect, Corrado Gini’s contribution to the worldwide statistics has brought benefits to other scientific areas such as economy, sociology, demography and also biology. Table 1 presents the variables used in the analysis together with the source, description and number of the equation in which the explanatory variable is included, due to the inter- correlation between certain explanatory variables.
Table 1. The variables of the empirical analysis
Source: Authors’ own work.
Econometric framework
The empirical analysis of the social impact that fiscal policy exerts upon the income inequality in the Baltic States is based on the econometrical estimation of a Panel data model with seven regression equations. The model comprises gradually a fiscal variable and then an association of them all, in accordance with the correlation degree. The analysed period of time is the years between 2003 to 2019 and the general form of the regression equation is as follows:
where „i” stands for the analysed country (i.e. Baltic States, namely Lithuania, Latvia and Estonia), VAR stands for the designation of the explanatory variable (i.e. VAT, EXCISE, SOC_ CONTRIB, PERSINC_TAX, CORRUPT, GOV_EXP, HDI) and „t” is the analyzed year.
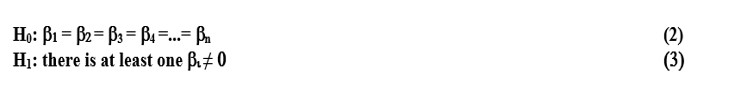
The parameters of the empirical analysis are the following:
The testing method is the Least square method (Bilgic, 2015) while the testing software program is EViews 10.
Empirical outcomes
Summary Statistics
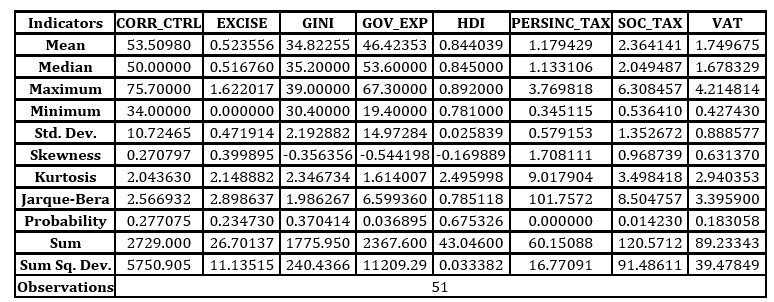
Further to the analysis, the variables are clasified in three main types as follows: fiscal, social and economic. The values of the variables are downloaded from the public database of Eurostat, Worldbank, the Human Development Reports and The Heritage Foundation. In this respect, the preliminary processing of the results imply the analysis of the descriptive statistics of the variables. Thus, Table 2 below comprises the statistics of all the variables used in the study.
As regards the maximum values of the Gini coefficient, it is worth mentioning that Latvia has reported in 2005 the highest value of 39 points, compared to Lithuania and Estonia, which reported during the same year the values of 35.3 respectively 33.4 income inequality. On the other side, the minimum value of 30.4 was reported by Estonia in 2017, while in the same year Latvia reported 35.6 and Lithuania 37.3 points income inequality.
The highest values of the fiscal variables were reported by Lithuania in 2019 from value added taxes, excises and personal income taxes, while in 2018 the same country has reported the largest revenues from social contributions. On the other side, the lowest fiscal revenues were reported by Latvia in 2003 from value added taxes, personal income taxes and social contributions.
Table 2: Descriptive statistics of the variables of the model
Source: Authors’ own computation using EViews 10.
Furthermore, the country with the highest level of human development is Estonia, with a maximum value of approximately 0.892, while in 2003 Latvia reported its minimum level of human development of just 0.78. However, considering that the values of the human development index are between 0.78 and 0.892, one can only appreciate that the living quality in the Baltic States is at a high level.
As regards the control of corruption, the results have shown that Estonia reported both the minimum and maximum values of such indicator, and thus it highlights the fact that representatives of government in
Estonia have applied efficient policies in the period under review. Also, Estonia is a flagship for the country which spent the most in governmental expenditure, while Latvia has reported the lowest levels of governmental expenditure.
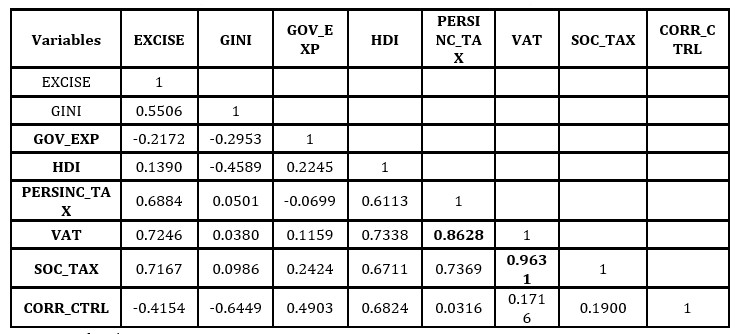
Table 3 comprises of the correlation matrix of the variables of the model. In this respect, the high-correlated variables are marked in black bold on a reasoning that their values are over the set-up threshold of 0.8, and thus, the said variables could not be estimated together in the same equation of regression.
Table 3. The correlation matrix of the variables
Source: Authors’ own computation using EViews 10.
Therefore, according to the results, value added taxes (VAT) is highly correlated to personal income taxes (PERSINC_TAX) and social contributions (SOC_TAX). Based on the findings, seven equations of regression were estimated.
Panel data regression models results
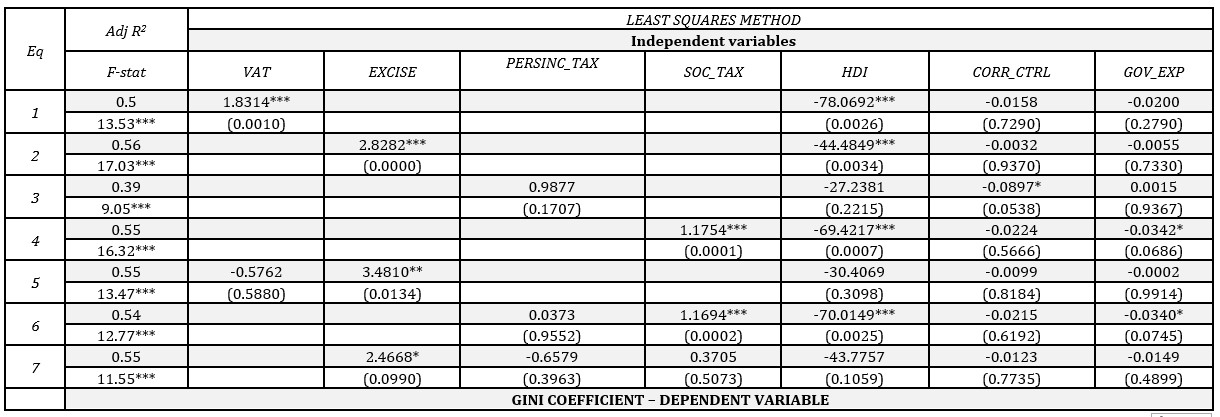
As Bilgic (2015) has analysed the impact of fiscal variables by using the least squares method, it is worth drawing the attention that the interpretation of the results should be the other way around because the results which indicate positive impact are in fact proving a slight growth of the explanatory variable’s coefficient and thus would increase the income inequality. On the other hand, the negative impact decreases the
quantitative value of Gini coefficient towards a homogeneity within the income of the households. Further to the estimation process, the results show that personal income taxes do not have significant impact on the income redistribution, fact which is rather inconsistent with the findings of Martinez et al. (2012), who demonstrated that the personal income taxes have positive impact on the redistribution of income. On the other hand, value added taxes, excises and social contributions have proven to impact the income inequality in a positive manner, which is rather a negative phenomenon as a slight increase in the explanatory variables’ coefficient would increase the Gini coefficient towards larger values close to 100 as perfect inequality. The statistical significance of the outcomes is summarized in Table 4.
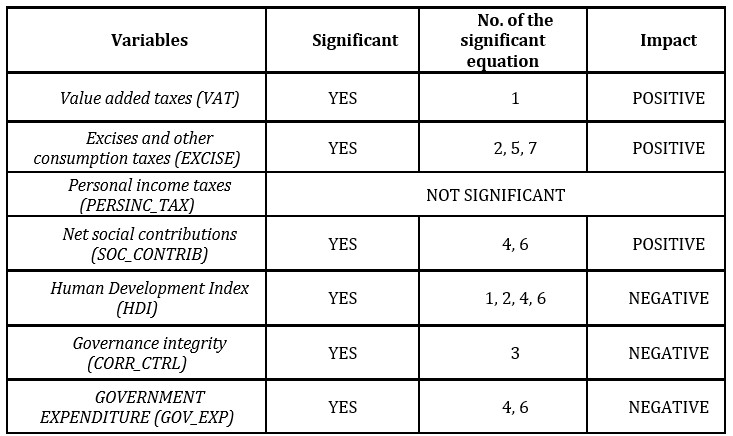
Table 4. Highlighted results of the empirical analysis
Source: Authors’ own work.
Table 5 presents the main impact of the estimated variables together with the correspondent number of the equation in which the variable is included. In this regard, the estimated coefficients of the social variables demonstrated a negative impact on the Gini coefficient mainly because of the subjective characteristics embeded in the indicators. However, the perception of corruption does not prove to have a major impact on the income redistribution, considering the results are concludent only for a 10% level of statistical significance. On the other hand, the Human
Development Index, which summarizes the main living conditions, has shown that a very good living standard improves the income inequality. Moreover, the estimated coefficients of the government expenditure (GOV_EXP) have shown that it lowers the inequality of the income redistribution.
According to Table 5 below, the adjusted R-squared coefficient of the equations has values between 0.4 and 0.56, which means that approximately 50% of the variation of the Gini coefficient is explained by the explanatory variables.
Table 5. Centralised results of the estimations in the EViews program
Source: Authors’ own processing using the EViews outputs of the estimations.
Notes: *** 1% Level of significance; **5% Level of significance; *10% Level of significance.
Variables with 1% Level of significance are value added taxes, excises and other consumption taxes, net social contributions and the human development index. To these, the human development index could be added as the social variable with the most prominent impact on the income redistribution in the Baltic States.
Concluding Remarks
The Baltic States have recently proven an efficient social and economic development driven by the establishment of public and fiscal policies oriented towards the welfare of the individuals. The general evolution of the Gini coefficient in these countries is marked by a slight decrease that emphasizes the leaning towards equilibrium in the redistribution of the income. As also expected, and confirmed by previous studies (Albayrak, 2011;Karabulut, 2020), the fiscal variables representing indirect taxes lead towards income inequality due to their regressive nature.
On the other hand, personal income taxes have no impact on the income redistribution, while social contributions also accentuate the inequality of the income. Moreover, the social variables have negative effects, highlighting good living conditions and lower levels of corruption in the Baltic States and the results related to government expenditure show low effects of the income inequality due to the efficient public policies established by governments.
As regards the limitations of the study, we noticed a lack of computed data for the Gini coefficient before the year 2002, and thus, we have proceeded to adjust the analyzed period. To add to this, we also understand that due to the chosen period and the small number of analyzed countries, the sample data are not sufficient and thus they need to be further completed. In this respect, as future research directions, we envisage to expand our Panel database with more countries in order to better reflect the social effects of the fiscal policy at a larger scale (i.e., European Union, OECD). Moreover, we understand a robustness check is also needed for better accuracy of the results.
Acknowledgement
This paper was co-financed by The Bucharest University of Economic Studies during the PhD program.
Albayrak, Ö. (2011), Finansal Krizde Uygulanan Vergi Politikalarının Gelir Dağılımı Etkileri: 2004-2009. Ankara. Üniversitesi Siyasal Bilgiler Fakültesi Dergisi, 66(2), 1-34;
Bilgiç A. (2015), Türkiye’de Uygulanan Vergilendirme Politikalarının Gelir Dağılımı Üzerindeki Etkileri: 1990-2013. Dönemi”, Yüksek Lisans Tezi, Eskişehir Osmangazi Üniversitesi, Sosyal Bilimler Enstitüsü, Eskişehir;
Drucker, L., Krill, Z. and Geva, A. (2017). The Impact of Tax Composition on Income Inequality and Economic Growth, Ministry of Finance. Publications and Reviews. Economic Data Articles Set;
Haughton, Jonathan; Khandker, Shahidur R.. (2009), Handbook on Poverty and Inequality. Washington, DC: World Bank;
Karabulut Șahin, (2020), Impact of Indirect Taxes on Income Distribution, Selçuk Üniversitesi Sosyal Bilimler Meslek Yüksekokulu Dergisi 23(1):92-100;
Karakotsios, A., Katrakilidis, C., Dimitriadis, D., & Christoforidis, T. (2020), Examining the relationship between income inequality, taxation and economic freedom: a panel cointegration approach. Economics and Business Letters, 9(3), 206-215;
Kozuharov, Sasho, Vladimir Pektovski, and Natasha Ristovska. (2015), The Impact of Taxes Measured by Gini Index in Macedonia. UTMS Journal of Economics 6 (1): 41–52;
Martinez-Vazquez, V., Vuloviç, B. and Dodson, M. (2012). The İmpact of Tax and Expenditure Policies On Income Distribution: Evidence from A Large Panel of Countries, Review of Public Economics, 200, 95-130;
Oboh, T., and Eromonsele, P.E. (2018), Taxation and Income Inequality in Nigeria, NG- Journal of Social Development. An Open Access Journal, 7(1), 63-72;
Prasad, N. (2008), Policies For Redistribution: The Use Of Taxes And Social Transfers, International Institute for Labour Studies, Discussion Paper. No:194;
Ray G. (2019), Letting the Gini out of the fuel poverty bottle? Correlating cold homes and income inequality in European Union countries, Energy Research & Social Science, Volume 58, 2019, 101255, ISSN 2214-6296;
Werner Baer ∗, Antonio Fialho Galv˜ao Jr., (2008), Tax burden, government expenditures and income distribution in Brazil, The Quarterly Review of Economics and Finance 48 (2008) 345–358;