Nicoleta PANAITE, Nicoleta PROHOZESCU (IFTIMI) and Carmen PINTILESCU
School of Economics and Business Administration, Alexandru Ioan Cuza University of Iasi, Romania
Volume 2022,
Article ID 186405,
Journal of Eastern Europe Research in Business and Economics,
10 pages,
DOI: 10.5171/2022.186405
Received date: 11 November 2021; Accepted date: 31 January 2022; Published date: 19 April 2022
Academic Editor: Gál Katalin
Cite this Article as:
Nicoleta PANAITE, Nicoleta PROHOZESCU (IFTIMI) and Carmen PINTILESCU (2022)," The Determinants of Unemployment: Estimating a Vector Error Correction Model for Romania ", Journal of Eastern Europe Research in Business and Economics Vol. 2022 (2022), Article ID 186405, DOI: 10.5171/2022.186405
The global economic crisis triggered in 2008, followed by the current health crisis, have slowed Romania’s economic progress registered after the transition to a market economy system. The main purpose of the paper is to analyze the short and long-term relationship between the unemployment rate and economic growth, inflation and public debt in Romania, considering quarterly data from 2000 to 2020. The first step of the analysis was to test the stationarity of the variables, the results of the ADF and PP showed that all the variables are non-stationary in level but stationary in first difference. After testing the potential cointegration relationship between the data series (using Johansen test), a Vector Error Correction Model (VECM) was applied. The main results suggest that economic growth, inflation and public debt impact the unemployment rate in Romania.
Keywords: unemployment, economic growth, inflation, public debt, VECM model
Introduction
The current health crisis, which followed the global economic crisis in 2008, generated one of the greatest economic recessions that impacted economies all over the world. This led to increasing unemployment and inflation levels, followed by an alarming raise of the public debt that was already on an ascending trend. A large number of countries spent unprecedented amounts of public resources in order to minimize the effects of the health crisis.
There are significant economic gaps between Central and Eastern Europe (EEC) countries and their counterparts in Western Europe. Employed in 1990 in a process of transition to a market economy, the EEC countries embarked on large-scale economic and institutional reforms in order to move to a new economic system. Among the EEC countries, Romania has one of the highest development gaps when compared to the EU. With one of the harshest political regimes before 1990, the process of transition to a market economy was slower, with economic reforms meeting great resistance among the population. The economic climate was dominated by uncertainty for a long time after the 1990s, with inflation rates of over 200% between 1992 and 1993 and an unemployment rate of over 11% in 1999. Economic restructuring measures along combined with privatization of the state sector led to a continuous increase of unemployment until 2000, after which the sharp economic growth registered after 1997 generated lower and lower unemployment rates. The economic recession in 2008 along with the current health crisis have slowed Romania’s economic progress in the past years. An analysis of the determinants of unemployment for a country unaware of this phenomenon before the 90s, in an environment characterized by instability and uncertainty, is very useful in the current context.
In this paper we intend to analyze the relationship between unemployment and economic growth, inflation and public debt in Romania, considering quarterly data for the period 2000-2020, when the Romanian economy could be considered a market economy. Economic growth is assessed by the main economic indicator GDP, expressed in the national currency (RON), and the inflation by the Consumer Price Index (CPI). By estimating a VECM model, we tested the existence of a short-term and long-term relationship between these macroeconomic variables. The paper is structured as follows: in Section 2, we present a survey of the literature on the main macroeconomic variables considered in our analysis. Section 3 describes the data and the methodology which was used for the estimation of VECM model. In Section 4, we present the empirical analysis and the last section presents the main conclusions.
Literature Review
Economic growth and unemployment are two of the most important macroeconomic phenomena of a country. The existence of a link between economic growth and unemployment was first studied by Arthur Okun, who identified in 1962, using data from the United States, an inverse link between them. In economic theory, the link between the two variables is known as Okun’s law and assumes that a 1% decrease in the cyclical unemployment rate is associated with a 2% increase in the real level of output. Some of the studies conducted so far support the existence of an inverse link between economic growth and unemployment, but the intensity of the link between the two variables differs greatly depending on the period analyzed and the context of the research.
Bean and Pissarides (1993) were the first authors to introduce frictional unemployment into a model of economic growth. They estimated a model based on the production function, where new players in the labor market must be compatible with existing job vacancies. Thus, an increase in the rate of factors of production favors economic growth and the creation of new jobs, which leads to a decrease in the unemployment rate.
Marimon and Zilibotti (1998) highlighted that structural changes have an impact on frictional unemployment, and the decline of some industries leads to the dismissal of unskilled employees and their employment in emerging sectors. Aghion and Howitt (1994) found that unemployment is affected by economic growth in three distinct ways: the development of new industries leads to the creation of new jobs; the disappearance of certain companies from the market leads to the effect of job destruction; the more new industries develop, the less companies benefit from the effects of economies of scale.
Another relationship that has been studied in the literature is between unemployment and inflation. The economist Phillips (1958) analyzed a series of data from the United Kingdom on the unemployment rate and the nominal wage over a period of almost 100 years. Following this research, the economist came to the conclusion that there is an inverse relationship between the unemployment rate and the nominal wage.
In 1960, Samuelson and Solow obtained similar results to Phillips’ analysis of the relationship between the inflation rate and unemployment in the United States using data over a 25-years period. Thus, the notion of trade-off between unemployment and inflation has emerged, which implies that the use of monetary policies can reduce the level of unemployment if inflation is high and vice versa.
Friedman and Phelps (1968) criticized Phillips’ theory, arguing that the unemployment rate is determined by fundamental factors and that its level tends to a natural rate (when the real wage is set by the market, unemployment occurs only when people do not want to work deliberately – voluntary unemployment) and the use of policies by public authorities could lead to macroeconomic imbalances.
Creating a balance between inflation and unemployment is quite difficult to achieve because if the emphasis is on fighting inflation, there will be an increase in unemployment. If the emphasis is on promoting growth for more jobs, it will increase inflation (Lipsey and Chrystal, 2007).
The study of the effects of public debt on the economy has been a topic of interest in the economic literature since the nineteenth century, when David Ricardo set up what is known as the Ricardian equivalence theorem. In the 1970s, following the Keynesian approach, advanced economies registered high ratios of public debt to GDP, which was even larger than the growth rate of GDP. The financial crisis that began in 2008 which generated significant financing difficulties in more European countries brought to the attention of economists the importance of maintaining a sustainable level of public debt. A study published by the European Central Bank in 2016 showed that high public debt values can have negative effects on the economy, being more vulnerable to macroeconomic shocks, which favors the volatility of key economic indicators. In Romania’s case this economic volatility was also generated by the political instability in 2015-2016 (Vancea, Aivaz and Duhnea, 2017).
The literature also suggests that high public debt may hinder long-term economic growth if money is used to finance non-productive activities or exceeds the optimal level (Checherita-Westphal et al., 2014). In addition, the structure of maturities, the financing methods and the composition of public debt, can have considerable effects on the economy. For example, a higher share of short-term debt can lead to greater economic instability during a crisis.
Data and Methodology
In this paper, we study the short-term and long-term relationship between the unemployment rate and economic growth, inflation and public debt in Romania, using quarterly data for the period 2000 to 2020. The data sources are the International Monetary Fund (IMF) and EUROSTAT.
The estimation of the relationship between these variables was based on a vector error correction model. VECM models represent a special form of VAR models, if the analyzed variables are integrated of order one and there are cointegration relations between them, then the optimal solution is represented by estimating a VECM model. This type of model offers the possibility to analyze the long-term relationships between variables (equilibrium relationships) and the short-term dynamics around equilibrium relationships. From an economic point of view, if there is a cointegration relationship between the analyzed variables, then there is a long-term economic balance between them.
One of the main purposes of the estimation procedure aims to analyze the relationship between the chosen variables, namely the application of the Granger causality test (first proposed in 1969). The purpose of this test is to identify the nature of the relationships between the unemployment rate, economic growth, inflation and public debt – unidirectional or bidirectional relations.
The presence of unit root in each of the series was checked by performing Augmented Dickey-Fuller (ADF) and Philips-Perron (PP) tests. Non-stationary variables were stationarized by calculating their first-order difference. For integrated variables of the same order, the existence of the cointegration relationship was tested using the Johansen test.
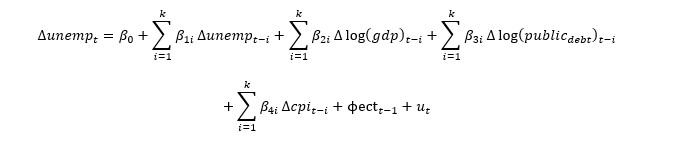
The general form of the econometric model estimated in the paper is the following:
Where,
is the first-order difference of the unemployment rate;
represents the first-order difference of the logarithmic variable GDP, expressed in RON million, in constant prices (2010);
is the first-order difference of the logarithmic variable public debt expressed in millions of RON. This variable was deflated in order to be expressed in constant prices (2010);
is the first-order difference of the variable consumer price index used as a proxy for inflation, expressed in constant prices (2010).
Empirical Results
The empirical analysis performed in this study concerns the study of the relationship between unemployment rate, economic growth, inflation and public debt in Romania, using quarterly data for the period 2000 – 2020. In Section 4.1, we undertake a brief description of the variables under consideration. The results of vector error correction model estimations are presented in Section 4.2.
Dataset Description
The evolution of the quarterly values registered in Romania by the variables unemployment rate, GDP, public debt, CPI, in the period 2000-2020, is shown in figure 1.
The quarterly unemployment rate in Romania from 2000 to 2020 shows fluctuations. If in the first quarter of 2000 the unemployment rate registered the value of 7.6%, in the same quarter of 2002 it reached 9.2% (the highest value in the analyzed period). In the period 2007Q3 – 2008Q3, unemployment followed a downward trend in the country, in the 3rd quarter of 2008 being registered the minimum threshold of this macroeconomic indicator from 2000Q1 – 2016Q3 (5.6%). Starting with the next quarter, the economic crisis led to the destabilization of the unemployment rate which led to significant increases for 4 quarters (7.4% in 2009Q4).
Starting with 2015, the Romanian economy began to recover, so the unemployment rate registered a downward trend for several years. The year 2020 is marked by alarming increases of this indicator due to the current coronavirus health crisis, reaching a maximum level in the second quarter of 2020 (5.4%).
Figure 1: Evolution of Unemployment rate, GDP, Public debt,
CPI in Romania, in 2000-2020 period
Between 2000 and 2008, Romania was in a period of economic expansion, the gross domestic product expressed in millions of RON registering an upward trend. From an economic point of view, Romania has entered in recession since 2009, following the global economic crisis triggered in 2008, when the value of GDP decreased for two consecutive quarters, compared to the values recorded in the previous quarters. This decrease was mainly due to the reduction of gross value added in all areas of activity, mainly in the field of transport, telecommunications and construction, in the field of commerce, respectively in the field of hotels and restaurants. Between 2012Q1 and 2020Q1, GDP followed an upward trend, followed by a sharp decline of 10.78% in 2020Q2 compared to 2020Q1, a decrease due to the negative effects of the COVID-19 crisis.
Regarding the country’s public debt, it can be seen that in the period 2000-2008 it has an almost linear evolution. Since the third quarter of 2008, when the side effects of the financial crisis began to appear, there have been significant increases in the level of public debt, which continued until 2020. The upward trend of this indicator is mainly due to previous years increases in wage and pension expenditures, which were also accelerated by pandemic costs.
Since 2008, the consumer price index has increased significantly until 2013, when the economy began to show signs of recovery. Until 2016, the consumer price index was kept under control by monetary policies, being interpreted as a disinflation phenomenon – at the beginning of 2017 inflation was close to zero and a year earlier it was negative. On the background of an accelerated upward evolution of the gross domestic product (4% average annual growth rate in 2013-2019) and public debt (7.3% average annual growth rate in 2013-2019) necessary to combat the economic effects of the coronavirus health crisis, the consumer price index followed the same upward trend, reaching a very high level at the end of the analyzed period.
Empirical Results
This section presents the results obtained after analyzing the relationship between unemployment rate, economic growth, inflation and public debt. After testing the stationarity of the data series and testing the cointegration relationship, a VECM model was estimated. All the results presented in this chapter were estimated using the E-views software.
Unit Root Tests
The Augmented Dickey-Fuller (ADF) and Phillips-Perron (PP) tests were used to analyze the stationarity of the data series, which were applied to both a constant and trend model and a constant only model (to ensure data robustness).
Table 1: Unit Root tests – ADF and PP
The stationarity hypothesis was rejected for the four variables expressed in level, but following the application of the operator difference of order 1, the results provided by the ADF and PP test lead us to the decision to accept the stationarity hypothesis of the data series (all the series became integrated of the same order).
Co-Integration Test
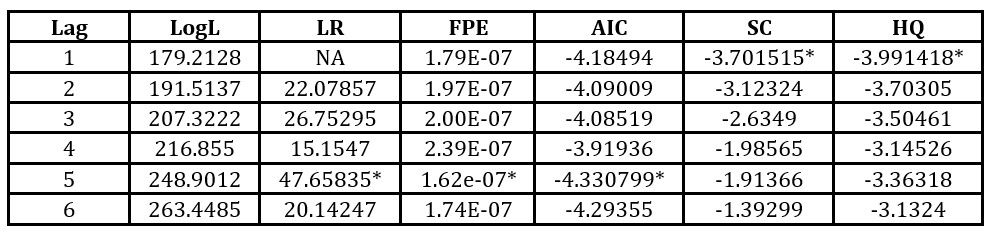
Taking into account that all the variables (unemployment rate, gross domestic product, inflation and public debt) are I(1), the next step of the analysis is to highlight the potential cointegration relationship between the data series. In order to test this relationship, the Johansen test will be used, but first it is necessary to establish the optimal number of lags in order to perform the cointegration test. The number of lags was chosen based on the information criteria Akaike (AIC), Likelihood Ratio (LR) and final prediction error (FPE).
Table 2: Lag length criteria
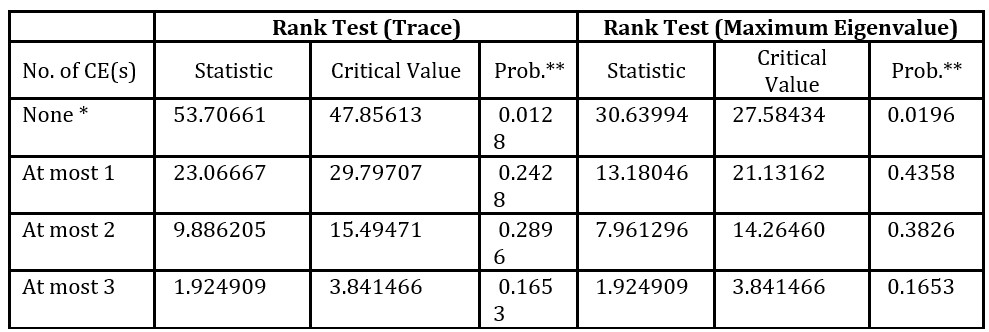
Table 3 presents the results of the Johansen test for cointegration. As can be observed, the probability associated with the 2 criteria, and , indicates the presence of a
cointegration equation, in other words, the relationship among variables is not spurious and in long run they are in equilibrium.
Table 3: Johansen cointegration test results
*Indicates the number of co-integrating relationships
Vector Error Correction Model
Having established the presence of co-integration among the variables under consideration, a VECM model can be applied. The number of lags that will be included in the model will be p-1, where p represents the order of the autoregression vector (table 2).
Table 4: Error Correction Model
*p<0.05, **p<0.1, ***p<0.01
The adjustment speed to the equilibrium relation is given by the error correction term, also known as the adjustment factor. The literature indicates that the value of this coefficient must be negative and statistically significant in order to validate the hypothesis that there is a long-term causal relationship between the data series.
In the case of the estimated model, it can be seen that the error correction coefficient registers a negative value (-0.951723) and is also statistically significant for a 5% risk (Table 4). We can conclude that the speed of adjustment for a deviation of the series from short run towards long run equilibrium relationship is high.
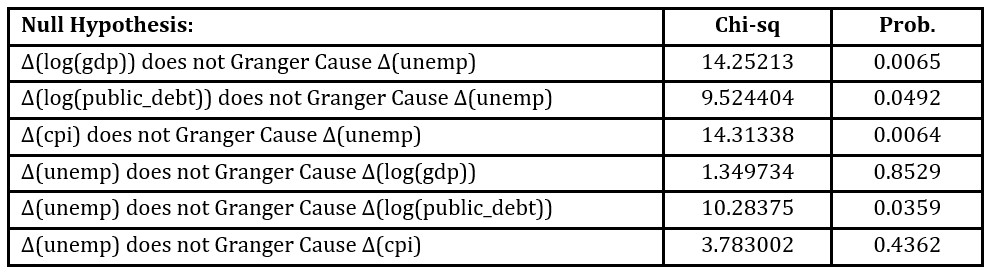
Another important step of the analysis is to test the significance of the coefficients that indicate the short-term relationship between the variables. The results in Table 5 show that on the short term the gross domestic product influences the unemployment rate, but the unemployment rate does not affect Romania’s GDP between 2000 and 2020. Thus, it can be concluded that there is a one-way relationship between the two variables. The same results are highlighted in the case of the relationship between the unemployment rate and inflation.
Table 5: Granger causality test
Regarding the link between unemployment and public debt, the Granger test indicates the presence of a bidirectional relationship, the two variables influencing each other in the short term (the probability associated with the Chi-Square test is lower than the risk assumed of 5%).
Stability testing of the VECM model
In order to determine whether the cointegration relationship between the variables has been correctly identified, it is necessary to test the stability of the model (Figure 2).
Figure 2: Testing the stability of the VECM model – Unit circle
If the estimated model is stable and correctly specified, then the values of the root of the polynomial determinant in mode are less than 1 and are inside the unit circle. Figure 2 suggests that the estimated model is stable because none of the values are positioned outside the unit circle.
The estimated model is validated if the modeling errors respect the hypothesis of independence of the modeling errors, respectively the homoscedasticity hypothesis. The two hypotheses were tested using the Portmanteau and White tests, the results obtained validating the null hypotheses (homoscedasticity and error-independent).
Conclusions
This paper aimed to analyze the short and long term relationships between the unemployment rate and gross domestic product, inflation, and public debt in Romania between 2000 and 2020. The goal was achieved by using the Johansen cointegration test and the Granger causality test. The obtained results highlighted the fact that the four analyzed variables are integrated of order one, cointegrated and the relationship between them can be estimated by a VECM model. In the short term, there is a one-way relationship between unemployment rate and economic growth, respectively inflation, while there is a two-dimensional relationship between unemployment and public debt, the two variables influencing each other. In the long run, the unemployment rate is caused by the analyzed macroeconomic variables. These results emphasize the fact that countries with significant poor economic performance cannot afford public debt increases for long periods of time because this can have a negative impact on unemployment.
References
Aghion, P., and Howitt, P. (1994), ‘Growth and Unemployment’, Review of Economic Studies, 61 (3), 477-494.
Banerjee, A., and Hendry, D. (1992), ‘Testing Integration and Cointegration’, Oxford Bulletin of Economics and Statistics, 54 (3).
Bean C. R., and Pissarides, C. (1993), ‘Unemployment Consumption and Growth’, European Economic Review, 37 (4), 837-854.
Brooks, C. (2008), Introductory Econometrics for Finance, Second Edition, Cambridge University Press.
Checherita-Westphal, C., Hallett, A.H. and Rother, P. (2014) ‘Fiscal Sustainability using Growth-Maximizing Debt Targets’, Applied economics, 46 (6), 638–647.
Freeman, D. G. (2000), ‘Regional tests of Okun’s Law’, International Advances in Economic Research, 6 (3), 557-570.
Friedman, M. (1968), ‘The Role of Monetary Policy, American Economic Review, 58 (1), 1-17.
Granger, C. (1998), ‘Some Recent Developments in a Concept of Causality’, Journal of Econometrics, 39 (1-2), 199-211.
Gujarati, D. (2004), Basic econometrics, Fourth Edition, United Millitary Academy, West Point.
Johansen, S. (1991), ‘Estimation and Hypothesis Testing of Cointegration Vectors in Gaussian Vector Autoregressive Models’, Econometrica, Vol. 59 (6), 1551-1580.
Johansen, S. (1995), ‘Likelihood-Based Inference in Cointegrated Vector Autoregressive, Models’, Oxford University Press.
Lipsey and Christal (2007), Economics, Eleventh Edition, Oxford, United States.
Maddala, G. S. (1992), Introduction to Econometrics, Second Edition, Macmillan Publishing, New York.
Marimon, R., and Zilibotti, F. (1999), ‘Unemployment vs. Mismatch of Talents: Reconsidering unemployment benefits’, The Economic Journal, Vol 109 (455), 266-291.
Mignon, V. (2008), Économétrie: Théorie et applications, Economica, Paris.
Okun, A.M. (1962). ‘Potential GNP: Its Measurement and Significance’, Cowles Foundation Paper 190.
Phillips, A. W. (1958). ‘The Relations Between Unemployment and the Rate of Change of Money Wage Rates in the United Kingdom’, Economica 25 Vol (100), 283-375.
Samuelson, P.A. and Solow, R M. (1960). ‘Analytical Aspects of Anti-Inflation Policy’, American Economic Review 50 (2), 177-194.
Vancea, D.P.C., Kamer, A.A., and Duhnea, C., (2017). ‘Political Uncertainty and Volatility on the Financial Markets – the Case of Romania’, Transformation in Business & Economics, 16, No 2A (41A), 457-477.
Wooldridge, J.M., (2013) Introductory Econometrics: A modern Approach, 5th Edition, South-Western College.
https://ec.europa.eu/eurostat/data/database [Accessed on October 2021].
https://www.imf.org/en/Data [Accessed on October 2021].