Mohamed Yacine Haddoud, Paul Jones and Robert Newbery
Futures Entrepreneurship Centre, Mast House, Plymouth University, Plymouth, Devon, England
Volume 2015 (2015),
Article ID 143938,
Journal of North African Research in Business,
16 pages,
DOI: 10.5171/2015.143938
Received date: 15 September 2014; Accepted date: 8 January 2015; Published date: 7 December 2015
Academic Editor: Ionela Mituko VLAD
Cite this Article as:
Mohamed Yacine Haddoud, Paul Jones and Robert Newbery (2015), "Regional Trade Agreements and Developing Countries’ Trade Performance: Evidence from Algeria and the European Union Association Agreement," Journal of North African Research in Business, Vol. 2015 (2015), Article ID 143938, DOI: 10.5171/2015.143938
In the North African region, efforts to boost trade through regional trade agreements are wide spread. The aim of this study is to provide empirical evidence from Algeria and the European Union Regional Trade Agreement (Algeria-EU RTA) on the impact of such agreements on developing countries’ foreign trade and economic welfare. This study involves both ex-ante and ex-post analyses. It is based on a quantitative assessment using the Lloyd and McLaren model and a descriptive analysis evaluation using a Vinerian Approach. Both ex-ante and ex-post analyses demonstrated that the agreement has positively influenced Algerian trade behaviour and led to an increase in economic welfare (non-oil).
In the last fifteen years, the phenomenon of Regional Trade Agreements (RTAs), also known as Free Trade Agreements (FTAs), has experienced a significant and constant increase. Most of the industrial, developed and developing countries are either members or in a process of negotiating a regional trade partnership (Wang, 2010). It is acknowledged that the European Union (EU) has the most extensive network of RTAs including both developed and developing countries (Panagravia, 2002).
Among these partnerships, the Euro-Mediterranean agreements (Euro-Med) are raising many debates concerning the actual impact of these agreements on trade performance (Peridy, 2005). In particular, it is argued that despite these trade agreements, Mediterranean countries have been experiencing disappointing trade performances for the last two decades. It is reported that the share of the North African countries (combined with the Middle-Eastern nations) in the global trade has dropped from 8% in 1981 to 2.5% in 2004 (Dennis, 2006). In this respect, it is warned that RTAs can negatively impact the trade performance of both members and non-members by diverting more trade from non-members than it would create among members (Freund and Ornelas, 2010).
The purpose of this study is to provide empirical evidence from the Algeria-EU RTA on the impact of free trade agreements on developing countries’ foreign trade and economic welfare. This work represents the first study investigating the effect of Algeria-EU trade agreement. It is structured as follow; (1) a brief review of literature is conducted covering the debate over the creation and diversion effects of RTAs, (2) the research methodology is presented and (3) the results are discussed and conclusions presented.
Literature Review: Trade Creation and Trade Diversion
In theory, RTAs are expected to increase the volume of trade, and enhance economic welfare among members. The deeper integration brought by the new wave of RTAs has constituted an essential inspiration for the expansion of the FTAs in the last decade. However, since Viner’s (1950) study on the customs’ union issue, a debate has taken place on whether the expansion of intra-bloc trade under RTAs is not at the expanse of extra-bloc trade. Viner’s approach involves two important concepts, namely; trade creation and trade diversion. According to this approach, trade creation refers to “the expansion of overall trade by a Preferential Trade Agreement (PTA) country to the benefit of its economy”, whereas, trade diversion is considered as “the expansion of trade between PTA partners, that supplants erstwhile imports from non-PTA countries at a higher resource cost than would be otherwise” (De Rosa, 2007: 2).
Several studies have claimed that RTAs significantly contribute to increasing trade among the country members and thus would positively impact the economic welfare of these countries (Allen et al., 1996; Sapir, 2000; Clausing, 2001; Magee, 2008). In this regard, Allen et al. (1996) conducted research on the EU-RTA, using an econometric approach. Based on data such as demand between home producers, other EU producers, and non-EU producers, the authors concluded that the European FTA created trade for both EU and non-EU producers. Similarly, Sapir (2000) found that Andean community, Closer Economic Relations (CER), Association of Southeast Asian Nations (ASEAN) Free Trade Area (AFTA) and European Free Trade Area (EFTA) have created more trade internally than they have diverted from the rest of the world. However, the effects of Latin American Integration Association (LAIA) and Southern Common Market (MERCOSUR) were inconclusive. Only the North American Free Trade Agreement (NAFTA) has been found to be net trade diverting. Moreover, Clausing (2001) investigated the effect of the Canada-United States trade agreement (CUSFTA) of 1988 and concluded that trade creation occurred in most sectors. Equally, Magee (2008) used a panel of 133 countries between 1980 and 1998. The author found that although the RTAs’ positive impact was limited, the latter has created more trade than it had diverted.
Conversely, other studies have demonstrated that RTAs may improve intra-regional trade at the expense of trade with outsiders (diversion), thus reducing economic welfare (Adams et al., 2003; Krugman and Obstfield, 2003; Romalis, 2007). In this respect, Adams et al. (2003: 100) have severely criticised past studies conducted on RTAs’ effects on trade, and where they have been found to create trade. They stated “these studies have been assessed, at best, only by reference to the point estimates from various cross sections”, and argued that new research has been conducted using more rigorous statistical tests. They found that among the 18 RTAs examined, 12 have resulted in more trade diversion from non-members than trade creation with members (concerning merchandise trade provisions). Moreover, they suggested that RTAs with high levels of liberalisation, such as the EU, NAFTA and MERCOSUR, have been unsuccessful at creating significant trade inside the region and therefore have reduced economic welfare effect. To summarise, the empirical results found by Adams et al. (2003) totally contradict the results mentioned previously. Furthermore, Krugman and Obstfeld (2003) illustrated these negative effects through the South American example. When in 1991 Argentina, Brazil, Paraguay and Uruguay created a free trade area called MERCSOUR, the volume of trade among these countries tripled within four years following the agreement.
Nonetheless, the authors stated that a study in 1996, conducted by the World Bank’s chief trade economist, showed that the increase in the volume of trade within the region was at the expense of the trade that would have taken place with the rest of the world. The report argued that member countries were purchasing higher cost products from neighbours instead of lower cost products still heavily taxed from non-member countries. Thus, the pact actually diverted trade instead of creating it, and therefore reduced world welfare. Equally, Romalis (2007) studied the creation/diversion effect in the NAFTA agreement. The author found that the agreement had diverted more trade from EU countries.
Eventually, scholars acknowledged that the creation and diversion effects depend on several factors that may influence the RTA’s impact. In fact, Wonnacot and Lutz (1989), Bhagwati (2008); and Freund and Omelas (2010) argued that RTAs are more likely to create trade and enhance economic welfare when formed with nearby countries that already trade extensively with each other (natural trading partner). Frankel et al. (1995) confirmed that factors such as physical proximity, similarity in sizes and Gross National Product (GNP), common borders and shared languages improve the probability for trade creation. Additionally, Grimwade (2000) has argued that the effects of RTAs on trade and economic welfare depend on the nature of the agreement. The author suggested that a number of factors may lead the agreement to create or divert trade. The author explained that the larger the area covered by the agreement, the higher the degree of complementarity between countries, the higher the level of competition between members and the lower the external tariffs (for non-members), the greater the trade creation. Similarly, Plummer et al (2010) have added other factors that may also lead the RTAs to be trade creating. These included being natural trading partners and having different comparative advantage.
Methodology: Assessing the RTA’s Impact
The evaluation of the potential and actual impacts of a RTA is conducted essentially using trade statistics and employing a number of assessment methods. The study’s results are often dependant on assumptions employed in the models and the availability of data. It is important to conduct the economic assessment of the RTA’s influence both before (ex-ante) and after (ex-post) the enforcement. The analysis of the potential effects prior to the RTA implementation helps to clarify the position of the country before joining the partnership, as well as its potential impact. Similarly, assessing the actual impact of the RTA after its implementation indicates whether the outcomes of the partnership match the expectations. Overall, the purpose of such assessment is to determine whether creating or joining an RTA is advantageous for the countries involved (Plummer et al., 2010).
Ex-ante Evaluation
This part is conducted using economic trade indicators covering imports and exports data in order to determine the level of the country’s interdependence; in other words, the extent to which the potential country member of RTA already trades with the region’s member (prior to joining the partnership). This analysis is mainly based on observations of trade movements and trade indicator. These are: regional interdependence, revealed comparative advantages and regional orientation indicators (See appendix 1 for formulas).
Ex-post Evaluation
For the ex-post assessment, both quantitative and descriptive evaluations are conducted. This is undertaken by observing and calculating changes in Algerian imports and exports after the RTA’s entry into force. With respect to the descriptive assessment, a Vinerian approach is applied. The latter is based on a comparison between imports and production movements prior to and after implementing the RTA. Nonetheless, the main disadvantage of this method is that it is a purely descriptive technique and does not quantify the creation or diversion of trade (Plummer et al., 2010). The interpretation of these comparisons is based on the following principles:
A rise in imports from RTA partners which would be accompanied by a decline in domestic production leads to trade creation
An augmentation in imports from RTA partners which would be accompanied by a fall in non-RTA partners’ imports leads to trade diversion
An increase in total imports where imports from non-RTA partners are constant or rising indicates that there is no trade diversion (positive welfare effect)
An increase in total imports where both imports from non-RTA partners and domestic production decline, and
o The drop in imports from non-RTA partners is greater than the drop in domestic production, implying that trade diversion exceeds trade creation, thus indicating a negative welfare effect; or
o The fall in imports from non-RTA partners is smaller than the fall in domestic production, implying that trade creation exceeds trade diversion, thus indicating a positive welfare effect.
A decline in total imports indicates that there is no trade creation (negative welfare effect).
Turning to the quantitative evaluation, it attempts to quantify the welfare effect that the RTA would have on the member countries. Lloyd and Maclaren (2004) reported that the economic welfare of a member country is related to three indicators – trade volume, intra-union terms of trade and extra-union terms of trade. The authors mentioned that a positive relationship exists between these indicators and the member country’s welfare. Consequently, an increase in trade volume as a result of the RTA leads to an improvement in economic welfare. In order to calculate the trade movements after the RTA implementation, a model developed by Lloyd and Maclaren (2004) based on observed trade values is employed. This model computes changes in trade volume, terms of trade, and economic welfare. The formula for the change in trade volume is as follows (Plummer et al., 2010: 83).
The addition of changes in trade volumes and terms of trade allows the quantification of the welfare effect of the RTA on the involved economy. Nevertheless, this method does not separate the effects on trade due to the RTA’s entry into force or due to other factors such as changes in incomes, prices and transports. Therefore, in order to solve this issue, it is necessary to calculate trade movements before the establishment of the partnership and compare them with actual values.
The data employed are mainly statistics regarding foreign trade figures, such as imports, exports and trade balances. Reliable sources are used, such as the United Nations Commodity Trade Statistics Database (UNCTAD STAT) and the Algerian Customs Board (Direction Générale des Douanes). Access to these sources was through their official websites. Finally, it is important to emphasise that as regards the Algerian websites, some technical issues were faced when collecting data. Thus, certain statistics have been collected by direct communication with these organisations’ employees.
Results
This section first presents the results obtained from the ex-ante and ex-post analyses.
Ex-ante Analysis
To begin with, the ex-ante analysis covers a five-year period prior to the Association Agreement (A.A.) implementation (2000-2005). It determines the economic regions that Algeria trades with most frequently. Thereafter, it examines a number of trade indicators regarding the EU-Algeria economic region. These are: (1) Intraregional Trade Indicator, (2) Intraregional Trade Intensity. (3) Revealed Comparative Advantages and (4) Regional Orientation Index. These trade indicators allow the researcher to determine the potential effect of the RTA on the Algerian foreign trade performance.
Dynamics of Algerian Foreign Trade
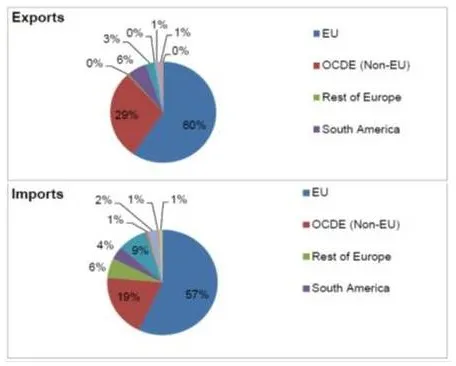
The following graph (Figure 1) illustrates the Algerian trade share averages by destination during the period 2000-2005 for both imports and exports. It can be seen that between 2000 and 2005, the EU shares of imports and exports were on average around 57% and 60% respectively. Next were the Convention on the Organisation for Economic Co-operation and Development (OECD) countries with a 19% share for imports and 29% for exports. As for the remaining economic regions, it can be seen that their overall share did not account for more than 20% in both imports and exports. It is therefore concluded that prior to the implementation of the Association Agreement, the EU was the largest trading partner of Algeria.
Figure 1. Average of Algerian Trade share by Economic Regions (2000-2005)
Source: Direction Générale des Douanes (2011)
Trade Indicators
A trade indicator is defined as “an index or a ratio used to describe and assess the state of trade flows and trade patterns of a particular economy” (Mikic and Gilbert, 2007: 30). The following reports the values of the calculated trade indicators.
(1) Regional Trade Interdependence and Intra-regional Trade Share
Regional Trade Interdependence indicators are a set of ratios that calculate the extent to which countries already trade with each other (before joining a RTA). Two main indicators are generally used for this purpose, namely, Intraregional Trade Share and Intra-regional Trade Intensity. These can be used for a single country or a group of countries to measure the regional direction of trade. High values for both indicators mean that countries in the proposed RTA have low trade costs compared with outsiders. Hence, the RTA may be beneficial as it boosts trade between “natural” trading partners (Plummer et al., 2010).
As for the Intra Trade Share (ITS), it is defined as “the ratio of trade between countries in the proposed region over the total trade of all those countries”. This indicator illustrates the level of trade within the region compared to the overall trade of all regional members (Plummer et al., 2004: 33).
Figure 2. ITS and ETS Shares for Algeria-EU FTA (2000-2005)
Source: UNCTAD STAT (2011).
As demonstrated by Figure 2, it is clear that throughout the period shares for Algeria-EU FTA were constantly high. A gradual increase can be observed between 2000 and 2005 from 0.85 to 0.97. However, concerning the ETS, it is apparent that shares were relatively low over the whole period. This reflects the high level of intra-regional trade in the EU-Algeria area already existing before the A.A.
(1) Inter-regional Trade Intensity
Intraregional trade intensity is defined as “the intraregional trade share divided by the share of the region’s total trade in world trade”. This indicator shows whether countries tend to trade more with member countries inside the agreement area (when the indicator is more than 1) or more with outsiders (when the indicator is less than 1) (Plummer et al., 2004:34).
Figure 3. ITT Shares of the Algeria-EU FTA (2000-2005)
Source: UNCTAD STAT (2011)
As it may be seen from figure 3, apart from the year 2000 where the share was the highest, shares were gradually increasing in much of the period. From 2001 to 2005, it increased from 2.2 to 2.4. This shows that the EU-Algeria FTA tends to have bias toward trading between its members rather than trading with outsiders.
(1) Revealed Comparative Advantage
It is stated that in international trade theory, gains from trade result from specialisation in a country’s efficient areas, in other words sectors in which a country has comparative advantage. Balassa (1965) proposed the Revealed Comparative
Advantage (RCA) index as a tool to identify commodities in which a country has a comparative advantage. It is defined as “the ratio of a country’s share of the commodity in the country’s total exports to the share of world exports of the commodity in total world exports” (Plummer et al., 2010:38).
A country is considered to have a comparative advantage on a selected sector if the index is greater than one. The following graph (Figure 4) shows average RCAs of Algeria between 2000 and 2005 for its six major sectors using the Standard International Trade Classification, Rev.3 (SITC) (UNCTAD STAT, 2011).
Figure 4. RCA of the Main Sectors of Algeria (2000-2005)
Source: UNCTAD STAT (2011).
From Figure 4, it can be seen that apart from the energy sector (SITC 3), where the RCA was on average approximately around nine, all the remaining sectors had a RCA below one. This shows that the energy sector is the only sector where Algeria has a comparative advantage. The next graph (Figure 5) deals with the RCA of the EU.
Figure 5. RCA of the Main Sectors of the EU (2000-2005)
Source: UNCTAD STAT (2011)
From Figure 5, it is clear that the EU has three RCAs. Indeed, in 2005, values of 1.14, 2.66 and 1.12 were recorded for food and live animals (SITC 0), machinery and transport equipment (SITC 7) and chemicals and related products sectors respectively. Nonetheless, in both the energy and the beverage and tobacco sectors, the EU did not have a comparative advantage. To sum up, from the Figures 4 and 5, it can be concluded that Algeria and the EU have large differences in their respective RCAs.
(1) Regional Orientation Index
The Regional Orientation Index (ROI) reflects whether a country’s exports of a product are more oriented toward a particular region than other destinations. It is defined “as the ratio of two shares. The numerator is the share of the country’s exports of the product to the region of interest in the country’s total exports to the region”. A country is considered to have a regional bias in exports of a certain product when the index is greater than one (Plummer et al, 2010: 39).
Figure 6. Regional Orientation Index of Algeria with EU and Non-EU Countries Classified by Sector
Source: UNCTAD STAT (2011)
From Figure 6, it can be seen that food and live animals, beverage and tobacco, manufactured goods, chemicals and related products, and energy sectors were higher than one. While the machinery and transport equipment sector was lower than one. This result suggests that Algerian trade is more oriented toward the EU area as most of the ROI indexes exceeded one.
Overall, it can be concluded that before joining the A.A. Algerian trade patterns were oriented mostly toward the EU area. Precisely, regional interdependence trade indicators were high, which indicates that the two partners were initially natural trading partners. Furthermore, the revealed comparative advantages’ indexes of both parties were considerably different. It is therefore concluded that the agreement was potentially more likely to create trade and improve economic welfare. Nonetheless, combining the revealed comparative advantage index and regional orientation, it is stated that when the former is below one and the second is above one, it may lead to a trade diversion (Plummer et al., 2010). The next analysis examines actual trade effects of the A.A.
Ex-post Analysis
The ex-post analysis covers a four year period after the A.A. implementation (2005-2009). It assesses the trade effect of the RTA by comparing the exports and imports movements of the county before and after its entry into force. Thereafter, it attempts to capture potential trade creation (or diversion) that may have resulted from the RTA by comparing the changes in imports with the domestic production using a Vinerian approach.
Dynamics of the Algerian Trade Movements
Observing the dynamics of trade movements before and after the establishment of the RTA allows the researcher to capture whether trade has increased or decreased as a result of trade agreement. Figure 7 shows the trade movements of the Algerian trade before and after the RTAs entry.
Figure 7. Evolution of Algerian Non-hydrocarbon Trade in $ Millions (2000-2010)
Source: Direction Générale des Douanes (2011)
From Figure 7, it is clear that non-hydrocarbon imports were considerably greater than the non-hydrocarbon exports; which illustrates the high dependence of the Algerian economy on hydrocarbon exports. Moreover, it can be seen that Algerian imports were significantly increasing all through the period. However, after the implementation of the A.A. faster growth was recorded, as between 2000 and 2005 the rise was around $11 billion, whereas between 2005 and 2010 the increase was approximately $20 billion.
With the exports, the same pattern was observed and once more the progression appeared to be faster. The rise between 2000 and 2005 was around $295 million, while the increase between 2005 and 2010 was about $700 million. Nonetheless, these movements do not illustrate necessarily the direct influence of the A.A. on the trade patterns. Thus, it would be useful to compare Algerian trade patterns’ changes between the EU and the non-EU countries (Figure 8).
Figure 8. Evolution of Trade’s Values of the EU and the non-EU Partners of Algeria in $ Millions (2005-2010)
Source: Direction Générale des Douanes (2011)
From the Figure 8, it can be concluded that both imports and exports from and to the EU were increasing more rapidly after the entry into force of the A.A. Between 2000 and 2005, the rise was by $300 million for exports and $5 billion for imports, whereas, between 2005 and 2010 the increase was by $500 million for exports and $10 billion for imports. However, it is also noticed that Algerian trade with non-EU countries was increasing over much of the period for both imports and exports. Moreover, between 2005 and 2010, imports from non-EU countries were higher and increasing considerably faster than imports from the EU countries. The drop in Algerian exports in the year 2008 was probably due to the worldwide financial crisis in 2008. Furthermore, it is important to note that although non-hydrocarbon exports increased after the A.A. implementation, its value remains marginal compared with the imports’ share. Finally, it can be concluded that the EU-Algeria FTA has positively influenced Algerian trade. Nonetheless, this cannot show whether such increase was at the expense of trade with non-members (trade diversion) or not. It is therefore useful to apply the Vinerian approach to capture the RTA’s trade effect.
Applying the Vinerian Approach
As mentioned above, the Vinerian approach is a descriptive technique comparing the trade movements and the production figures. Precisely, this study looks at the dynamics of Algerian exports and imports in comparison with the domestic production changes in order to capture the RTA’s trade effects. Figure 9 analyses the Algerian imports with EU and non-EU countries in comparison with the domestic production, by sector, between 2005 and 2008 (data for 2009 was unavailable). The selected sectors are the most traded sectors in the Algerian economy. These sectors are classified using Standard International Trade Classification, Rev.3 (SITC), they are; food and live animals (SITC 0), chemicals and related products (SITC 5), manufactured goods (SITC 6) and machinery and transport equipment (SITC 7). From these figures, it can be concluded that both Algerian imports and domestic production in all four sectors have increased since 2005 (the RTA enforcement).
Figure 9: Evolution of Algerian Imports and Domestic Production in the Most Traded Sectors, in $ Thousands
Overall, and based on the Vinerian approach, the descriptive study confirms the potential impact identified in the ex-ante analysis. It shows that both Algerian imports and exports from and to EU and non-EU countries have significantly increased since the implementation of the A.A. This growth was faster between 2005 and 2010 than in the period 2000-2005. This suggests that:
(1) No trade diversion has occurred as both imports and exports towards non-EU countries have increased, and
(2) Trade creation has taken place as the total Algerian trade has increased.
In other words, it reflects that the Association Agreement had increased trade between Algeria and the EU, and this was not at the expense of trade with non-EU partners. Furthermore, the examination of the most traded sectors in the Algerian economy demonstrates that, in sectors such as chemicals and related products and machinery and transport equipment, both total imports and imports from non-EU countries have improved. This confirms that no trade diversion has occurred, and therefore a positive economic welfare has resulted. Nonetheless, the increase noted in non-hydrocarbon exports was marginal compared with the growth in imports’ shares. This means that the Algerian trade still has a considerable disproportion in the trade balance and the agreement did not contribute to regulate it. The next analysis attempts to approximately quantify the rise in economic welfare observed in the Algerian economy after the Association Agreement implementation.
Quantitative Analysis
This analysis uses observed trade values to compute changes in volumes and terms of trade. The computation is realised according to a model developed by Lloyd and Maclaren (2004). This evaluation attempts to quantify the gain or loss engendered by Algeria from the EU partnership. It is important to note that the evaluation is limited to only the most traded products. These are classified by sector, and do not include hydrocarbons which was not involved in the agreement. The selected sectors are classified using the SITC classification:
SITC 0: food and live animals
SITC 5: chemicals and related products
SITC 6: manufactured goods
SITC 7: machinery and transport equipment
The ex-ante analysis has shown that changes in exports were relatively marginal compared with changes in imports. Therefore, changes in trade volume calculations involve only imports. According to Lloyd and Maclaren’s model, the total of bilateral changes in volumes should be weighted by tariffs in a base period. In the present evaluation, 2004 is used as the base period, whereas 2009 is considered as the new period. Data on applied import tariffs are extracted from the International Customs Tariffs Bureau (ICTB). The changes in trade volume are computed using the following formula stated in the methodology section.
The following table 1 shows the computations’ results for changes in trade volume. 2004 has been chosen as the base period, while 2009 is the new period (See appendix 1 for formulas):
Source: UNCTAD STAT (2011).
Table 1 shows that after implementation of the EU-Algeria A.A. Algerian trade has increased with both EU and non-EU countries. The rise is estimated to be around $460 million during the four first years of the agreement. This is positive, indicating that the EU-Algeria FTA has created trade internally and externally. However, this value is based only on the most imported products and not on all Algerian imports. Thus, this estimation should be considered as a representative value, and not the real value. Source: UNCTAD STAT (2011).
In order to complete the evaluation, changes in Algeria’s terms of trade with respect to EU and non-EU partners are also calculated. According to Lloyd and Maclaren’s model (2004), change in the terms of trade should be weighted by base period trade quantities. The formula presented in the methodology is used. Table 2 shows the computations’ results for changes in terms of trade between 2004 and 2009.
Source: UNCTAD STAT (2011)
It is clear from Table 2 that changes in the terms of trade with respect to EU countries and non-EU countries were approximately –$2.7 billion. This is negative, which reflects that 4 years after the entry into force of the A.A. economic welfare was reduced. Nevertheless, it is important to note that this trade index is based only on the non-hydrocarbon sector.
Overall, the quantitative study indicates that the EU-Algeria A.A. has led to positive trade creation through an increase in intra-regional and extra-regional trade. However, the agreement was unable to regulate the “huge” imbalance in Algerian imports and non-oil exports. This has led to a decline in the non-oil sector, in terms of trade, estimated at around $2.7 billion between 2004 and 2009.
Discussion and Conclusion
The ex-ante analysis has shown that the EU-Algeria RTA was expected to increase trade within the region. This increase would not be at the expense of extra-regional trade as indicators showed that the two partners were initially natural trading partners and therefore the agreement was more likely to be trade creating rather than trade diverting. The literature review revealed that if a RTA is undertaken with natural trading partners, trade creation will be greater than trade diversion and economic welfare will increase (Bhagwati, 2008). This was confirmed by the ex-post analysis. The descriptive study showed that the A.A. has positively influenced Algerian trade and led to trade creation in most of the sectors. This indicates that Algerian economic welfare increased after the A.A. implementation and confirms the statement and findings of a number of past studies (Allen et al., 1996; Sapir, 2000; Bhagwati, 2008).
Nevertheless, the quantitative study indicated that although economic welfare increased after the A.A. implementation, it remains negative. The evaluation, based on the general equilibrium model revealed that the loss in terms of trade was estimated at around $2.7 billion from the entry into force of the partnership. It can be suggested that, with respect to the EU-Algeria FTA’s trade effects, the impact was positive yet still insufficient to cover the existing imbalance between Algeria’s imports and its non-hydrocarbon exports. This leads to the conclusion that the agreement did not fulfil the objective set by the Algerian government, which was reducing the non-hydrocarbon trade imbalance.
It is argued that an RTA alone is not sufficient to regulate this imbalance. An appropriate environment for exports has to be provided and companies should be also ready. This is not the case in Algeria. It is stated that although the government provides assistance to exporting companies, this remains insufficient and ineffective. It is also argued that most of the domestic companies do not consider exports as a priority and are more locally oriented; managers tend to focus on the growing and advantageous local market rather than on risky foreign markets (Nancy et al., 2009). Therefore, future research should investigate the role of government in increasing the non-hydrocarbon exports. This research has been limited by the difficulties of accessing data on Algerian trade and investment. Certain data had to be collected via direct private communication and through contacts working for the organisations concerned. Furthermore, some data displayed in these organisations’ websites appeared to be inaccurate and imprecise. In addition, the research has suffered from inconsistencies of data. Indeed, it was observed that for particular trade data, organisations were providing different values. Consequently, it is important to highlight that, especially for the quantitative analysis, numerical findings should be considered only as indicative estimates and not as definitive values.
1.Adams, R, Dee., Gali, J. & McGuire, G. (2003). ‘The Trade and Investment Effects of Preferential Trading Arrangements: Old and New Evidence,’ Staff Working Paper. Australia Productivity Commission. Canberra.
2.Allen, B., Gasiorek, A & Smith, M. (1996). “Trade Creation And Trade Diversion,” The Single Market Review Series. Luxembourg: The European Commission.
13.Krugman, P. R. & Obstfield, M. (2003). ‘International Economics: Theory and Policy. 6th edition,’ USA: Pearson education International.
14.Lapadre, L. & Proietti, A. (2009). ‘Statistical Analysis of International Trade and Production: Towards a Scoreboard of Indicators,’ OECD Trade Indicators Project.
17.Mikic, M. & Gilbert, J. (2007). ‘Trade Statistics in Policymaking—A Handbook of Commonly Used Trade Indices and Indicators,’ Studies in Trade and Investment, Trade Policy Section, Trade and Investment Division. UNESCAP.
18.Nancy, G., Kreitem, B. & Picot, B. (2009). ‘Evaluation de l’etat d’execution de l’Accord d’Association Algerie-UE,’ Algeria: Ministere du commerce. Translated from French by M. Haddoud.
25.Viner, J. (1950). ‘The Customs Union Issue’’. Washington, D.C.: Carnegie Endowment for International Peace. In World Bank. (2000). “Trade blocs,”Research Policy Report. Oxford: University Press.