Volume 2026,
Article ID 581133,
Journal of Organizational Management Studies,
11 pages,
DOI: https://doi.org/10.5171/2026.581133
Received date: 12 December 2025; Accepted date: 7 February 2026; Published date: 10 June 2026
Academic Editor: Ragheed Ibrahim
Cite this Article as:
Severina Marsovna KHAMIDOVA and Yanqing WANG (2026)," How EFQM Excellence Model Enablers Foster Innovation and Business Performance in Russia”, The Journal of Organizational Management Studies, Vol. 2026 (2026), Article ID 581133, https://doi.org/10.5171/2026.581133
The research examines the impact of EFQM Excellence Model enablers on innovation and business performance in the Russian context. Despite economic instability, Russian organizations have increasingly adopted the EFQM framework, a trend that accelerated after the official release of the Russian-language version of the Model in 2019. Using empirical data from 110 questionnaires completed by EFQM award-winning organizations, the research employs structural equation modeling (SPSS and AMOS) to test the hypotheses. The results confirm that strengthening EFQM Excellence enablers positively influences both innovation outcomes and overall business performance. The findings highlight the Model’s significant value for organizations operating in challenging economic environments and provide practical insights for the wider international business community.
Keywords: EFQM, enablers criteria, innovation performance, business performance, Russia
Introduction
The rising adoption of the EFQM Excellence Model in new markets presents opportunities to evaluate its effectiveness (EFQM, 2021). The EFQM Excellence Model, which features five enablers criteria and four results criteria, became available in the Russian language in 2019 (EFQM Rus, 2019), which led to an increased rate of adoption of the model in Russia.
This research effort offers a new model which replaces all four of the results criteria of the EFQM Excellence Model with two latent factors: innovation performance and business performance. This decision to change the EFQM Excellence Model was inspired by Gomez et al., (2011), who found that the society results criteria reduced the integrity of the EFQM model excellence and could be replaced by other variables. The modified model, offered by this research undertaking, evaluates the link between the EFQM EME and the two proposed latent factors. This link is measured using statistical analysis of empirical data to determine the existence of direct or indirect relationships between the enablers criteria and the two proposed latent factors in Russian organizations that have won the EFQM Prize for Excellence. The research will help to assess if such a replacement option constitutes an improvement for measuring organizational performance.
This research is structured as follows. Section 2 presents a literature review. Section 3 describes the research hypotheses. Section 4 outlines the methodology. Section 5 focuses on hypothesis testing and analysis of results. Finally, Section 6 summarizes the research limitations.
Literature Review
The EFQM EME
The EFQM Excellence Model was invented in the early 1990s by CEOs from leading European organizations. While the model did not immediately become the basis for the business processes of European organizations, by the early 2000s, it gained significant recognition and adoption in several jurisdictions.
The rise in the implementation of the EFQM Excellence Model in both Europe and beyond occurred despite two antagonistic factors: economic stagnation in several European countries; and the lack of translated documents of the European Excellence Model into the languages of the Commonwealth of Independent States’ member countries (EFQM Article, 2017; EFQM, 2021).
Notwithstanding the above-mentioned barriers, including the historical lack of the EFQM Excellence Model documents in Russian until September 2019, more than 100 Russian organizations have since won the EFQM Prize for Excellence (EFQM Representative, 2021). Having outlined the adoption rate of the EFQM Excellence Model in Russia, it is important to review the way in which the enablers of the model are evaluated.
The EFQM Excellence Model comprises five enablers and four results criteria (EFQM, 2021). This research however proposes modifications to the model. The research replaces the four results criteria with two constructs that are made up of 20 additional innovation performance items and five business performance items. The decision to substitute the four results criteria with two constructs was guided by the findings of Gomez et al., (2011).
This research also brings changes to the 24 definitions that are associated with the five EFQM enablers. Prior research combined the enablers criteria into a single second-order latent factor, which explains the results of innovation and performance (Kafetzopoulos et al., 2019). This research similarly deployed the second-order latent factor approach for enablers with 24 items.
Innovation Performance
Innovation is important for economic growth. In order to better understand innovative performance, it is necessary to study the effects of implementing different types of innovation (Kim et al., 2012; Kafetzopoulos et al., 2019).
Radical innovations fundamentally change the actual activities of an organization and its organizational competence (Escrig-Tena et al., 2021). The opposite of radical innovation is incremental innovation. Incremental innovations take the form of small deviations from current practices (Chang et al., 2015; Escrig-Tena et al., 2021). Thus, incremental innovation is based on small changes in an organization’s current technical capabilities (Escrig-Tena et al., 2021). The complementary role of improving products and processes has also been emphasized (Idris et al., 2021). Process innovation refers to a new process, software, equipment, and new elements to produce products and services (Kafetzopoulos et al., 2019). Product innovation refers to a new product and service in a market that is organized for customers (Idris et al., 2021). Finally, administrative innovation combines the development and implementation of new ideas, systems, products, and technologies to improve organizational structures (Gunday et al., 2011).
The literature review provides grounds for measuring innovation performance by considering both radical and incremental innovations. Therefore, this research unlike those before adopts an innovation performance construct as a second-order latent factor with five criteria (radical product, radical process, incremental product, incremental process and administrative innovation). Research proves that if the first-order factors have a strong correlation, they can be represented as a single second-order factor (Brown, 2006). Therefore, it is reasonable to utilize, for this research, five criteria which collectively contain 20 items.
Business Performance
Building and maintaining partnerships, as well as achieving organizational goals, have become important marketing elements for improving business performance (Chen and Huang, 2009). Business performance is an improvement in overall market positioning that meets or exceeds customer expectations (Lam et al., 2011).
Due to the lack of willingness of Russian organizations to share confidential financial data, this research uses an indirect approach to collecting data which included a survey. The survey asked respondents to indicate their level of agreement with statements about the performance of the product/service offered by their organization and the effectiveness of working with customers over the last 12 months. In this research, business performance is considered a single latent factor that includes five items. The items within the business performance construct, meanwhile, were consolidated in accordance with research findings from Hughes and Morgan (2007) and Shan et al., (2016).
Hypotheses
In order to be competitive and prosperous in a changing market, organizations need both a quality system and to systematically create different types of innovations (Gunday et al., 2011; Kafetzopoulos et al., 2019). Studying the effects of various types of innovation provides a better understanding of how organizations handle innovation performance (Escrig-Tena et al., 2021). Some researchers state that there is only a direct and positive relationship between innovation performance and QM practices (Abrunhosa and Sa, 2008). However, another camp of researchers refutes the link between innovation and QM (Prajogo and Sohal, 2004). In this research, the following hypothesis is proposed:
Hypothesis 1. The EFQM EME positively affects innovation performance.
A wide body of research has found that the development and implementation of various types of innovations contribute to discovering, studying and capturing new market areas (Hughes and Morgan, 2007). Thus, product innovation is responsible for customer satisfaction (Chang et al., 2015). Technical innovations, meanwhile, are responsible for maintaining the proper level of product and service production systems (Chen and Huang, 2009). Administrative innovations are responsible for coordinating internal structures (Gunday et al., 2011), and technical innovations maintain excellence in the external market by responding to external changes in market conditions (Gunday et al., 2011). Moreover, both administrative innovation and technical innovations (radical and incremental) affect business performance (Gunday et al., 2011; Chang et al., 2015). Based on the above, the following hypothesis is proposed:
Hypothesis 2. Innovation performance positively affects business performance.
To increase an organization’s ability to produce a quality product and satisfy its customers, it is necessary for organizations to constantly monitor processes (Idris et al., 2021). To do this, organizations implement various QM standards (Lam et al., 2011; Kim et al., 2012). The results of an empirical study of Malaysian service firms (Lam et al., 2011) confirmed a positive and significant relationship between total quality management and market performance. Similarly, a literature review revealed a direct link between QM and business performance (Kim et al., 2012; Kafetzopoulos et al., 2019). The current research also aimed to assess the relationship between the EFQM EME and business performance in Russia. Accordingly, the following research hypothesis is proposed:
Hypothesis 3. The EFQM EME positively affects business performance.
Maintaining and acquiring market share often requires organizations to innovate (Shan et al., 2016). This finding justifies the need for a more effective QM to enhance market performance (Tsai and Yang, 2013). The above was discovered when a group of researchers attempted to understand the mediating role of innovation and investigated the relationship between the EFQM EME and business performance (Kafetzopoulos et al., 2019). These researchers found that the EFQM EME and innovation performance directly contribute to business performance. They also showed that innovation performance played a partially mediating role. Earlier studies have shown that there is still no evidence of a link between EFQM activities and the five types of innovation (Kim et al., 2012). Therefore, the research model of the current study builds on the proposed research vectors and analyses the impact of the EFQM EME on the business performance of Russian organizations, mediated by five types of innovations. Accordingly, it is hypothesized that:
Hypothesis 4. Innovation performance partially mediates the relationship between the EFQM EME and business performance.
Methodology
Sample and Data Collection
A structured survey questionnaire was used as a data collection method. The population was selected from among the Russian organizations that have received European recognition and won the EFQM prize for excellence. A total of 130 questionnaires were returned from respondents who filled out an anonymous survey individually between February and March 2020. Each variable in the survey questionnaire was examined for unique or extreme outliers. Upon examination, 20 questionnaires were deleted because they were incomplete. The analysis was therefore based on a sample of 110 questionnaires. The study’s 110 observations were considered acceptable by academic standards. Some authors (Hair et al., 2010) claim that a sample size should contain at least 50 observations; while others have relied on a sample with a minimum of 100 respondents (Bezdrob, 2019; Shee et al., 2021).
Test of Non-response Bias and Common Method Bias
The result of the t-test between early and late respondents indicated no statistically significant difference (p>0.05) between these groups. After performing a t-test, a one-way ANOVA test was conducted in order to identify possible differences using the mean value of the measured variables among the organizations’ fields of activity based on their demographic profile: organizations with 1-49 employees (19;17.3%), organizations with 50-249 employees (13;11.8%), organizations with 250-499 employees (26;23.6%), and more than 500 employees (52;47.3%). The ANOVA results confirmed that no statistically significant differences were detected among the four groups. From the above, the data appear to be free from non-response bias, and this is unlikely to be an issue in the final sample.
The homogeneity of the data was measured before principal component analysis was performed. In order to measure the homogeneity of the data, both a Kaisure of Sampling Adequacy (KMO) and Bartlett’s test of sphericity were utilized. The results show that the KMO is bordering with the “marvellous” index of 0.9 (KMO=0.864) (Kaiser and Rice, 1974; Sarmento and Costa, 2017). With respect to Bartlett’s test of sphericity, it resulted in an associated level of significance that is less than 0.05. Such a small significance level (approx. Chi-Square=4624.200, df=1176, p<0.000) indicates that factor analysis may be useful with the data. Therefore, the data sample reflects homogeneity and adequacy, and principal component analysis could be performed.
The single-factor Harman’s test was performed after the KMO and Bartlett’s test of sphericity. A single factor accounted for 32.982% of the total variance. Since the single factor resulted in less than 50% of the threshold, it was concluded that the common method variance was not a serious threat in this research (Podsakoff et al., 2003).
Measurement Analysis
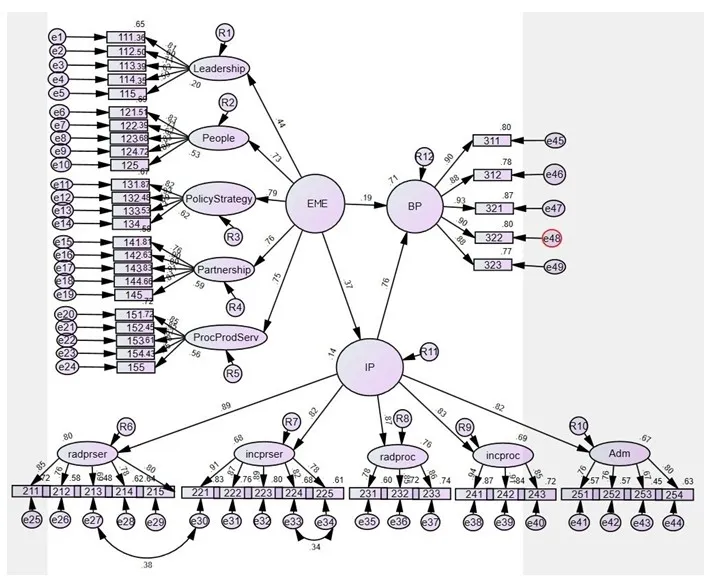
The research conducted exploratory factor analysis (EFA) using the principal component extraction method with varimax orthogonal rotation. Next, confirmatory factor analysis (CFA) was used to confirm the number of factors found in accordance with the EFQM EME. Scale reliability, unidimensionality, construct validity and multicollinearity of the measures were undertaken (Hair et al., 2006). Then, the measurement model and proposed hypotheses were tested using structural equation modelling (SEM) via path analysis (Figure 1). The measurement model was assessed by examining the goodness-of-fit statistics indices: absolute fit indices, incremental fit indices and parsimonious fit indices.
Fig 1. Structural model and path analysis
Results
Unidimensionality, Reliability and Validity
In the first stage, EFA was applied to extract the latent factors and confirm their quantity and compliance to the EFQM EME. The EFA identified five latent factors, which correspond to the EFQM EME, based on items loaded on them. The five latent factors resulted in: KMO=0.876, extraction>0.3, MSA>0.8, p=0.000, and eigenvalues>1. They accounted for 69.147% of the total variance. The number of identified factors and the EFQM EME was the same.
In the second stage, EFA was also applied to extract the latent construct of innovation performance. Five latent factors were established, and the results were as follows: KMO=0.927, extraction>0.3, MSA>0.80, and p=0.000. They accounted for 76.857% of the total variance, and they were named as follows: radical product innovation; incremental product innovation; radical process innovation; incremental process innovation; and administrative innovation.
In the third stage, EFA was applied to the business performance construct, extracting one latent factor, with the following results: KMO=0.912, extraction>0.3, MSA>0.8, p=0.000, and eigenvalues>1. The latent factor accounted for 84.291% of the total variance and was labelled business performance.
After testing the tolerance value and variance inflation factor, it was found that multicollinearity was not an issue in the data, because they were within acceptable limits, as set out by Hair et al., (2010). Based on the output, the collinearity statistics measures are as follows: all the values of the tolerance are above 0.377, which is not below 0.1; and the highest value of the variance inflation factor is 2.867, which is less than the generally accepted threshold of 4 and is within the tolerated range (Hair et al., 2010). From the above-mentioned results, it can be concluded that there is no multicollinearity.
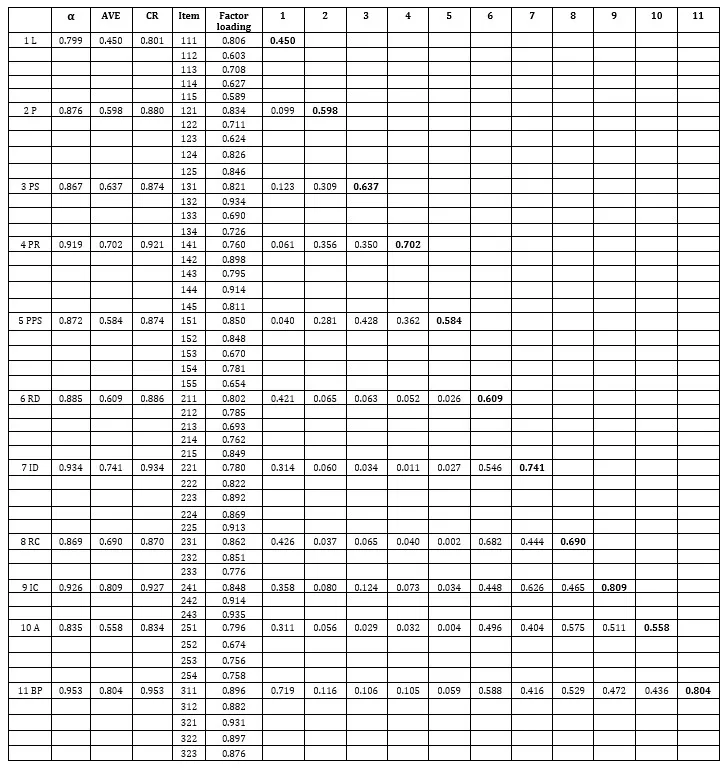
Convergent validity and reliability measures were also tested using the CFA (Table 1). Composite reliability (CR) and average variance extracted (AVE) were analysed using the results of the CFA. The CR and AVE were calculated using estimates of the standardized regression weights of the CFA results for each construct.
Rules of thumb suggest that the CR should be 0.7 or higher to indicate adequate convergence or internal consistency. Moreover, these rules assume that the AVE should be≥0.5, to suggest adequate convergent validity (Hair et al., 2010). Some researchers claim that an AVE value greater than 0.4 is also acceptable (Nunnally and Bemstein, 1994).
As shown in Table 1, the CR was contained between 0.801 to 0.953, while the AVE stayed between 0.450 to 0.809. According to Fornell and Larcker (1981), this value is acceptable because the CR is higher than 0.6 (0.801). These results prove that all measures have a reasonable level of reliability (Hair et al., 2010; Tsai and Yang, 2013).
In addition to the above, the unidimensionality of the measurement scale was tested. With unidimensionality, the factor loadings between the constructs and items were assessed by conducting an EFA. The analysis of factor loadings showed that the factor loadings of all subjects varied from 0.603 to 0.935, which were all above the desired 0.5 level (Hair et al., 2010). Thus, 49 measurement items were retained and used in the CFA. Thereafter, Cronbach’s alpha coefficient was used as a measure of internal consistency. The results showed that the Cronbach’s alpha coefficient of all factors was greater than 0.799, which exceeds the recommended threshold of 0.70. This indicates that all factors and constructs were measured by fairly reliable items (Hair et al., 2010) and confirm the assumed structural model
Notes: α, Cronbach alpha; L, leadership; P, people; PS, policy and strategy; PR, partnership and resources; PPS, processes, product and services; RD, radical product innovation; ID, incremental product innovation; RC, radical process innovation; IC, incremental process innovation; A, administrative innovation; BP, business performance.
Model Fit
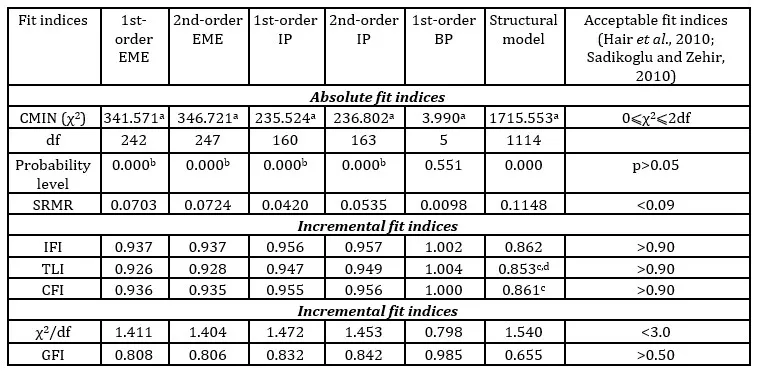
In order to evaluate the model fit, after testing Cronbach’s alpha coefficient, the first-order CFA and second-order CFA were applied. The results indicated that the fit statistics represent a good fit of the data to the proposed measurement model (Table 2) (Hair et al., 2010; Sadikoglu and Zehir, 2010). Then, the SEM technique was applied for the structural model with maximum likelihood estimation. Given the large number of items (49) and the small sample size (110), it became necessary to use more liberal cut-off values for normalized indices (0.80) (Sharma et al., 2005; Portela, 2012). As shown in Table 2, the overall fit statistics for the structural model demonstrated a tolerable and liberal fit (Sharma et al., 2005; Portela, 2012). The goodness-of-fit indices showed that the structural model was a good fit for the data.
Next, a discriminant validity test was performed among the three constructs by comparing the AVE and the square of the correlation between any latent variable (Fornell and Larcker, 1981; Hair et al., 2006). Research has established that the value of AVE must be greater than the value of the squared correlation (Fornell and Larcker, 1981). The test results in Table 1 show that the squared correlation is less than the AVE for each construct, indicating discriminant validity (Hair et al., 2006). The analysis of the measurement models confirmed that the measures used in this research are reliable, unidimensional, valid and multicollinear
Table 2: Fit indices and the overall measurement of the structural model
Notes: a, significant p-values expected (Hair et al., 2010; Sadikoglu and Zehir, 2010); b, acceptable when n<250, the number of the measured variables range between 12 and 30, SRMR<0.09 and CFI>0.92 (Hair et al., 2010); c, between 0.8 and 0.9 it is considered tolerable (Portela, 2012); d, 0.80 is a liberal cut-off value based on a large number of indicators and small sample size (Sharma et al., 2005); EME, EFQM Excellence Model enablers; IP, innovation performance; BP, business performance.
Hypothesis Testing
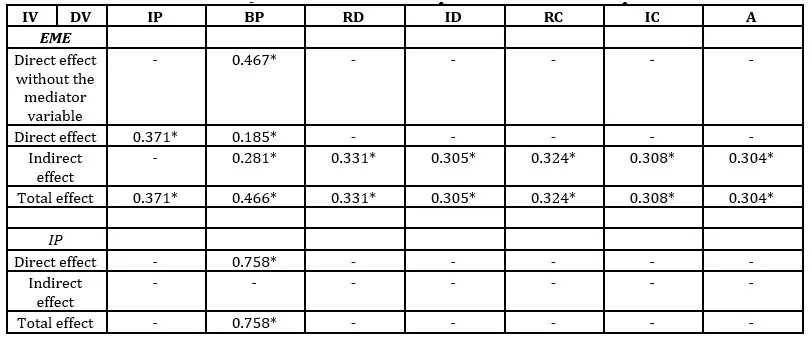
The results in Table 3 are highlighted by three significant direct relationships: the construct of the EFQM EME directly affects innovation performance (0.371), which confirms the validity of Hypothesis 1; innovation performance directly affects business performance (0.758), which confirms the validity of Hypothesis 2; and the construct of the EFQM EME directly affects business performance (0.185), confirming Hypothesis 3’s validity.
The findings prove that the implementation of the EFQM EME contributes not only to innovation performance but also to business performance. Improving innovation performance increases business performance. In this research, the mediator variable is represented by the innovation performance between the EFQM EME and business performance. The results in Table 3 showcase that the construct of the EFQM EME (without a mediator) has a significant direct impact on business performance (0.467). However, after introducing innovation performance as a mediation variable, the construct of the EFQM EME saw its direct impact reduced by 2.5 times on business performance (0.185). In addition, the indirect effect of the construct of the EFQM EME on business performance (through innovation performance) reached a score of 0.281 (0.371×0.758), which is 1.5 times higher than the expected direct effect (0.185).
The results confirm that the mediation structural model is better suited to the data than the non-mediating model. This is proved by the statistically significant difference in the values of χ2(Δχ2=1699.594-1693.681=5.913 at Δdf=1) between the two competing models. The non-mediating model has a poor fit because the value of χ2(1699.594) is greater than the value of χ2(1693.681) in the mediating model. Since the relationship between the EFQM EME and business performance remains significant, even when innovation performance is included in the model as an additional predictor, innovation performance plays a partial mediation role. Therefore, the above results confirm the validity of Hypothesis 4.
Table 3: Effects of the EFQM EMEand innovation performance on the dependent variable
Notes: *p<.001; IV, independent variables; DV, dependent variables; EME, EFQM Excellence Model enablers; IP, innovation performance; BP, business performance; RD, radical product innovation; ID, incremental product innovation; RC, radical process innovation; IC, incremental process innovation; A, administrative innovation.
Discussion
Based on the above findings, the research leads to the following conclusions:
First, the research provides empirical evidence that the EFQM EME and business performance have a strong total relationship. This is illustrated in Table 3, where the regression coefficient equals 0.466 (0.185+0.281). In Figure 1, it is estimated that the predictors of business performance account for 71.2% of its variance in the path model between the EFQM EME and business performance.
Second, there is empirical evidence that the EFQM EME and innovation performance have a strong direct relationship. As shown in Table 3, the regression coefficient equals 0.371.
Third, this research provides empirical evidence that innovation performance and business performance have a strong, direct relationship. Table 3 illustrates this phenomenon, as the regression coefficient is 0.758.
These strong and positive relationships found between the constructs confirm the benefit of a replacement of all four of the results criteria of the EFQM Excellence Model with two latent constructs. It constitutes an improvement for measuring the competitive advantage of Russian organizational performance.
The results of this research show that the justification of the EFQM Excellence Model, widely used by European enterprises, is also relevant in the Russian market. The EFQM EME can have a positive impact on the business performance of Russian organizations.
Limitations
Some limitations of this research should be noted. The first limitation is related to the relatively low questionnaire response rate. A larger sample size could both increase the reflectivity of the study and lower its margin of error. This is because a larger sample size requires stricter criteria for evaluation with multiple fit indices (Hair et al., 2010; Portela, 2012).
The effectiveness of using anonymous surveys is another element to consider when discussing the limitations of this research. For example, Lelkes et al. (2011) cautioned that complete anonymity in surveys can result in increased reporting of socially undesirable attributes, and does not guarantee an increase in the accuracy of answers reported. Since both anonymous and non-anonymous survey methods present respective advantages, such trade-offs should be considered in future research designs. Future research undertakings are encouraged to adopt a case study approach to incorporate financial data from organizations.
Acknowledgements
The authors are grateful to Sacha Alaby for his insightful comments and suggestions that enhanced the quality of the article.
References
Abrunhosa, A. and Sa, PME. (2008), ‘Are TQM principles supporting innovation in the Portuguese footwear industry?,’ Technovation, 28(4), 208-221.
Bezdrob, M. (2019) ‘Long-Term Performance Implications of Management Innovation,’ Journal of East European Management Studies, 24 (2), 210-234.
Brown, T (2006) Confirmatory factor analysis for applied research, New York: The Guilford Press.
Chang, J., Bai, X. and Li, JJ. (2015), ‘The influence of leadership on product and process innovations in China: The contingent role of knowledge acquisition capability,’ Industrial Marketing Management, 50, 18-29.
Chen, C. J. and Huang, JW. (2009), ‘Strategic human resource practices and innovation performance: the mediating role of knowledge management capacity,’ Journal of Business Research, 62 (1), 104-114.
EFQM (2021), EFQM [Online], Available at: https://www.efqm.org
EFQM Representative (2021), Признание [Recognition]. EFQM Representative, [Online], http://efqm-rus.ru/recognition/successful-organization/
EFQM Rus (2019), Модель EFQM теперь в свободном доступе и на русском языке [The EFQM model is now freely available in Russian]. EFQM Representative, [Online], http://efqm-rus.ru/2019/09/
Escrig-Tena, AB., Segarra-Cipres, M. and Garcia-Juan, B. (2021) ‘Incremental and radical product innovation capabilities in a quality management context: exploring the moderating effects of control mechanism,’ International Journal of Production Economics, 232 (2), 107994.
Fornell, C. and Larcker, DF. (1981), ‘Evaluating structural equation models with unobservable variables and measurement error,’ Journal of Marketing Research, 18(1), 39-50.
Gomez, JG., Costa, MM. and Lorente, ARM. (2011), ‘A critical evaluation of the EFQM model,’ International Journal of Quality & Reliability Management, 28 (5), 484-502.
Gunday, G. et al. (2011) ‘Effects of innovation types on firm performance,’ International Journal of Production Economics, 133 (2), 662-676.
Hair, J. F. et al. (2010) Multivariate Data Analysis (7th ed.), Pearson/Prentice Hall, Upper Saddle River, NJ.
Hair, J. F. et al. (2006) Multivariate Data Analysis (6th ed.), Pearson/Prentice Hall, Upper Saddle River, NJ.
Hughes, M. and Morgan, RE. (2007), ‘Deeconstructing the Relationship Between Entrepreneurial Orientation and Business Performance at the Embryonic Stage of Firm Growth,’ Industrial marketing management, 36(5), 651-661.
Idris, B., Saridakis, G. and Khan, Z. (2021), ‘The effect of outward and inward internationalisation on different types of innovation: evidence from UK SMEs,’ Journal of International Management, https://doi.org/10.1016/j.intman.2021.100903
Kafetzopoulos, D. and Gotzamani, K. (2019), ‘Investigating the role of EFQM enablers in innovation performanc,’ The TQM Journal, 31 (2), 239-256.
Kafetzopoulos, D., Gotzamani, K. and Skalkos. D. (2019), ‘The relationship between EFQM enablers and business performance: The mediating role of innovation,’ Journal of Manufacturing Technology Management, 30 (4), 684-706.
Kaiser, HF. and Rice, J. (1974), Little Jiffy, Mark IV. Educational and Psychological Measurement, 34 (1), 111-117.
Kim, DY., Kumar, V. and Kumar, U. (2012), ‘Relationship between quality management practices and innovation,’ Journal of Operations Management, 30 (4), 295-315.
Lam, SY. et al. (2011), ‘The relationship between TQM oriented training and market efficiency in service organizations: an empirical analysis, total quality management and business excellence,’ Total Quality Management & Business Excellence, 22 (12), 1277-1297.
Lelkes, Y. et al. (2011), ‘Complete Anonymity Compromises the Accuracy of Self-Reports,’ Journal of Experimental Social Psychology, 48, 1291-1299.
Nunnally, JC. and Bernstein, IH. (1994), Psychometric theory (3rd ed.). New York: McGraw-Hill.
Podsakoff, PM. et al. (2003), ‘Common method biases in behavioral research: a critical review of the literature and recommended remedies,’ Journal of Applied Psychology, 88 (5), 879-903.
Portela, DMP. (2012), Contributo das Tecnicas de Analise Fatorial para o Estudo do Programa “Ocupacao Cientifica de Jovens nas Ferias”. Universidade aberta.
Prajogo, DI. and Sohal, AS. (2004), ‘The multidimensionality of TQM practices in determining quality and innovation performance-an empirical examination,’ Technovation, 24 (6), 443-453.
Sadikoglu, E. and Zehir, C. (2010), ‘Investigating the effects of innovation and employee performance on the relationship between total quality management practices and firm performance: an empirical study of Turkish firms,’ International Journal of Production Economics, 127 (1), 13-26.
Sarmento, R. and Costa, V. (2017), Comparative Approaches to Using R and Python for Statistical Data Analysis, IGI Global.
Shan, P., Song, M. and Ju, X. (2016), ‘Entrepreneurial orientation and performance: is innovation speed a missing link?,’ Journal of Business Research, 69 (2), 683-690.
Sharma, S. et al. (2005), ‘A simulation study to investigate the use of cutoff values for assessing model fit in covariance structure models,’ Journal Of Business Research, 58 (7), 935-943.
Shee HS., Miah, SJ. and De Vass, T. (2021), ‘Impact of smart logistics on smart city sustainable performance: an empirical investigation,’ The International Journal of Logistics Management, 32 (3), 821-845.
Tsai, KH. and Yang, CY. (2013), ‘Firm innovativeness and business performance: the joint moderating effects of market turbulence and competition,’ Industrial Marketing Management, 42 (8), 1279-1294.