1André Filipe Domingos Gomes, 2Ana Cristina Wanzeller Guedes de Lacerda and 3Joana Rita da Silva Fialho
1Polytechnic of Viseu, Viseu, Portugal
2Research Center in Digital Services, Polytechnic of Viseu, Viseu, Portugal
3Centre for Studies in Education and Innovation, Polytechnic of Viseu, Viseu, Portugal
Volume 2022,
Article ID 607107,
Journal of Software and Systems Development,
16 pages,
DOI: 10.5171/2022.607107
Received date: 21 October 2021; Accepted date: 9 February 2022; Published date: 27 July 2022
Cite this Article as:
André Filipe Domingos Gomes, Ana Cristina Wanzeller Guedes de Lacerda and Joana Rita da Silva Fialho (2022)," Using Process Mining to Analyze an Emergency Service", Journal of Software & Systems Development, Vol. 2022 (2022), Article ID 607107,
DOI: 10.5171/2022.607107
Digital solutions open up advances in institutions and in the services they provide. Many organizations collect large amounts of data (Big Data), but the value of these data is not readily available. Any possible solution to solve this problem is seen as an opportunity to obtain innovative indications for improving the functioning of the institutions.
The health area is an important example in the context of the Big Data problem. Data collected in hospitals, combining log records from various sources, allow for a broader picture of medical processes. The scarcity and onerousness of resources and the growing need to provide health care to the population generate increasing pressures for good management of those processes.
A possible solution to solve the mentioned problem is the usage of techniques of knowledge extraction from data, more precisely Process Mining. Thus, this work aims to show the benefits of using Process Mining to improve health processes, in this case in an emergency room.
The results of this work are models that allow the analysis of the real functioning on care units, making it possible to draw conclusions about their management, as well as their resources’ use. With this type of information, professionals from each unit can act on existing inefficiencies, allowing them to improve a service that is of great importance to the population.
Keywords: Process Mining, Big Data in Healthcare, Emergency Service, Process Management, Disco Tool
Introduction
Currently, digitization processes facilitate the availability of large amounts of data. (Big Data). However, the underlying value of these data is not easily accessible (L’Heureux et al., 2017). A possible solution to this problem, which is also seen as an opportunity to obtain indications for improving the functioning of institutions, is to appeal to knowledge extraction processes from data. These processes require, precisely, large amounts of data and allow extracting useful knowledge to leverage opportunities (Mbassegue et al., 2016).
In recent years, there has been a huge increase in information systems in the health area to support hospital activities. Despite this advance, the interoperability of digital systems remains an open issue, leading to challenges in data integration. As a result, the potential that hospital data offer, in terms of understanding and improving care, is not yet fully utilized (Johnson et al., 2016).
Any issue related to health is always sensitive, given its importance to the population. It is directly related to people’s well-being and, especially, to the sense of security they want to have in providing basic health care. Statistical data show that the population is increasingly aging, reinforcing the importance of the existence of a good National Health System (NHS) (Bárrios et al., 2020).
However, the management and planning of emergency service are complex, causing hospitals to fail to respond within the expected time. Moreover, they imply the provision of a service conditioned by resources, which are often scarce and expensive. This situation is further aggravated by the high number of patients, which can lead health professionals to make decisions under pressure (Sakellarides, 2020).
Process Mining may help organizations, since it is oriented to obtain knowledge about a certain process in execution and allows having a real model of the process behavior. It is possible to evaluate it to improve its implementation (Hendricks, 2019). In an ideal scenario, it will be possible to describe what happened, why it happened, what will happen and what can be improved on what will happen (Kurniati et al., 2018).
It is intended, therefore, to analyze an emergency service and understand how Process Mining can help to provide information to managers. The idea is to help them to identify and act on existing inefficiencies, in order to design interventions that can reduce waiting time, reduce patient congestion and increase the quality of care with cost savings.
The experimental scenario presented in this paper uses a dataset from the MIMIC-III database (Kurniati et al., 2018), with the information and structure necessary for the application of process discovery algorithms. For the discovery of the real model, the Disco (Lohmann, 2012) proved to be the simplest and most intuitive tool to use, confirming the thesis that process analysts need a tool that, above all, makes Process Mining faster and easier (Lohmann, 2012).
This document is organized into 5 sections. In Section 2, the main concepts that will be used throughout this paper are analyzed. Section 3 explains the data and experimental setting. Section 4 intends to present the results and the respective analyses. Finally, Section 5 concludes and sets out possible future work.
State of art
In this section, the basic concepts and ideas that will be explored throughout this article are described, with Process Mining being the main research area and MIMIC-III the data source used in this experiment. The concept of the Emergency Service is also analyzed because, in addition to being the area under study, it is intended to understand the base model used in this type of service to subsequently analyze, if possible, the conformity between the real model and the expected model.
Process Mining
In the last decade, Process Mining has emerged as a new field of research that focuses on process analysis using event data. Classic data mining techniques such as classification, clustering, regression and learning association rules do not focus on business process models and are generally only used to analyze a specific step of the overall process (Van Der Aalst, 2012). Process mining focuses on end-to-end processes and its evaluation is possible by the increasing availability of event data and new techniques for process discovery and compliance verification (Mans et al., 2015).
Process models are used for analysis and execution by Business Process Management/Workflow Management (BPM/WFM) systems, which are process models normally made by hand, without using event data. However, the activities performed by people, machines and software, leave traces in the so-called event logs (Van Der Aalst, 2012). Figure 1 shows that process mining techniques use these logs to discover, analyze and improve business processes (Batista & Solanas, 2019).
Process Mining is implemented to achieve three goals: process discovery, process implementation compliance, and process enrichment (Mans et al., 2015). Process discovery reveals the most frequent paths and unusual sequences through the visualization of the event log, for example, in a Petri net. In verifying compliance, the process model and flows discovered in the event logs are analyzed, and it is verified if the process is performed as identified in its model (Breitmayer, 2018). The compliance check then measures the differences between the executed process and the model specification in order to identify gaps that create the opportunity to improve the process model or the process execution.
Fig 1. Process Mining (Adapted from Mans et al., 2015)
Thus, data mining is used to find patterns and understand the causes of certain process behaviors, while, on the other hand, it helps to understand how these are being performed. For this purpose, specialized mining algorithms are applied to identify patterns from the event data that are registered in the information management system (Rojas et al., 2019).
There are mining tools that use specialized mining algorithms to identify patterns from event data recorded in information management systems (Rojas et al., 2019). The articles (Gomes et al., 2021b) and (Gomes et al., 2022) make a comparative analysis of some of the main available algorithms. Already in (Gomes et al., 2021a), a comparative analysis of tools is carried out and it is concluded that Disco is the most suitable to use, despite the need for a license in its most complete versions.
The Disco software presents itself as a proprietary solution with extended and improved functionalities (Batista & Solanas, 2019). As for licensing, this tool offers two free options. When installing the Disco for the first time, it is possible to get automatically a demo license. This demo license limits the import to 100 events per file, cannot be used commercially, and places a note on the exported process maps that says the map was created with the demo version of Disco. Apart from that, the Disco is fully functional. Another license, used in this work, is academic. This limits the import to 5 million events, and it cannot be used commercially either. For this it is necessary to request an academic license from one of the various academic partners of Disco.
Disco is designed to make mining processes easy and fast, starting with really simple data import, automatically detecting the type of the various fields in the records in order to load the datasets as quickly as possible. But the main functionality of this tool is the automated discovery of process maps, and once the import is finished, the process model visualization automatically appears, where is possible to see quickly and objectively how it was actually executed. Path thickness and activity coloring show the main paths of process flows. Unnecessary loops and point cases are quickly discovered.
The algorithm used in Disco is based on the Fuzzy Miner algorithm, with a proprietary customization. This was the first mining algorithm to introduce the “map metaphor” into process mining, including advanced features such as continuous process simplification and highlighting frequent paths and activities. Disco uses a Fuzzy Miner approach that allows reliable results for datasets of any complexity and can be efficiently operated and understood by anyone.
Disco also allows the users to obtain all the information and statistics about the dataset used, but a highly important feature is the possibility to see the list of variants in the process, which are a very important part of the process analysis. Finally, it also provides a set of filters that allow an exploitation of the various directions and, on the other hand, it answers to specific questions about the process, quickly and interactively.
MIMIC-III
Medical Information Mart for Intensive Care III (MIMIC-III) is a large, freely available database that includes unidentified health-related data associated with more than forty thousand patients who remained in intensive care units at Beth Israel Deaconess Medical Center between 2001 and 2012 (Johnson et al., 2016).
MIMIC supports a wide range of analytical studies covering epidemiology, improving clinical decision rules, and developing electronic tools. In terms of advantages, the following stand out: free availability, after a strict authorization process; its reach with a diverse and very large patient population; it contains comprehensive, high temporal resolution clinical data, including laboratory results, electronic documentation, and more (Johnson et al., 2016).
The MIMIC-III database was filled with data that were acquired during routine hospital care, so there was no overload associated with health professionals and no interference in their workflow. Data were recorded from a variety of sources, including critical care information systems files, hospital electronic software databases, and the social security administration’s master death file (Johnson et al., 2016).
Before the data were incorporated into the MIMIC-III database, they were de-identified in accordance with the Health Insurance Accountability and Portability Act (HIPAA) standards, using structured data cleansing and date change. In particular, dates were shifted into the future by a random shift for each individual patient in a consistent manner to preserve intervals (Johnson et al., 2016).
Emergency Service
The Emergency Service works in a close coordination with the Intensive Care Unit and other specialties, namely those that support the realization of the various complementary means of diagnosis (Yousefi & Yousefi, 2020).
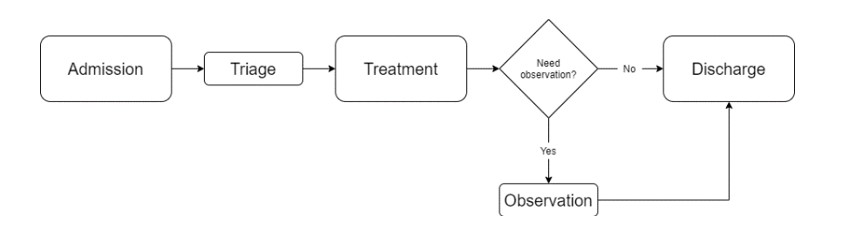
The flow of patients can be seen in Figure 2, where they arrive at the emergency services and then wait for care after they register for admission. Afterwards, patients await the availability of the triage room for assistance. In the triage room, the severity of each patient is checked based on the Manchester Triage System (MTS) (Azeredo et al., 2015) which categorizes patients into five priority groups: Immediate (Red), Very Urgent (Orange), Urgency (Yellow), Standard (Green) and Non-Urgent (Blue).
Then, each patient waits for care. While he is being attended, he can go through different care units, receiving the necessary treatment. Finally, they go to observation, if they need this care before leaving, or are discharged immediately after treatment (Yousefi & Yousefi, 2020).
Fig 2. General model of the emergency department (Adapted from Yousefi & Yousefi, 2020)
Data and Experimental Scenario
For the development of this work, it was necessary to prepare the data and the experimental scenario to be used. Thus, in this section, we started by presenting the data processing. This step consisted in selecting the data of interest from the MIMIC-III database. Afterwards, from this collection, the data were converted to the format necessary for the application of the process discovery algorithms. In the last part of the section, the types of configurations and the types of analysis that the dataset and the Disco tool allow are presented, as well as the configurations chosen so that the analysis of the process is the best possible.
Data
Dataset creation began by choosing the information of interest for the analysis in question. PATIENTS table, which contains patient data, was chosen, since the analysis focused on the paths taken by the patients.
Next, the information related to the patient’s visit to the hospital was selected. The tables chosen were ADMISSIONS and TRANSFERS, obtained from the hospital’s database.
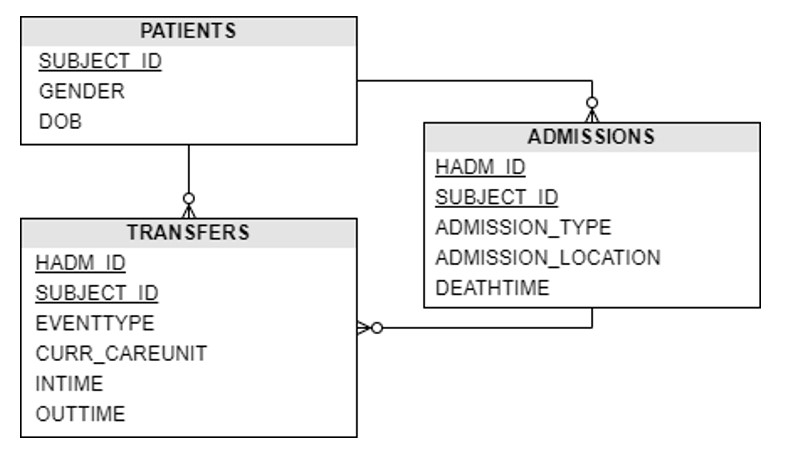
The table scheme satisfying the necessary requirements is presented in Figure 3.
Fig 3. Data scheme
The main table is TRANSFERS. It contains the physical locations of patients during hospitalization. The main attributes of this table are: the care unit (CURR_CAREUNIT) where the patient was, if it is a specialty; the date and time of entry (INTIME) and exit (OUTTIME) of the unit; the event type (EVENTTYPE), being “admit” for procedures performed in the patient admission/assessment phase, “transfer” for the patient transfer/stay phases and “discharge” for the patient’s discharge phases.
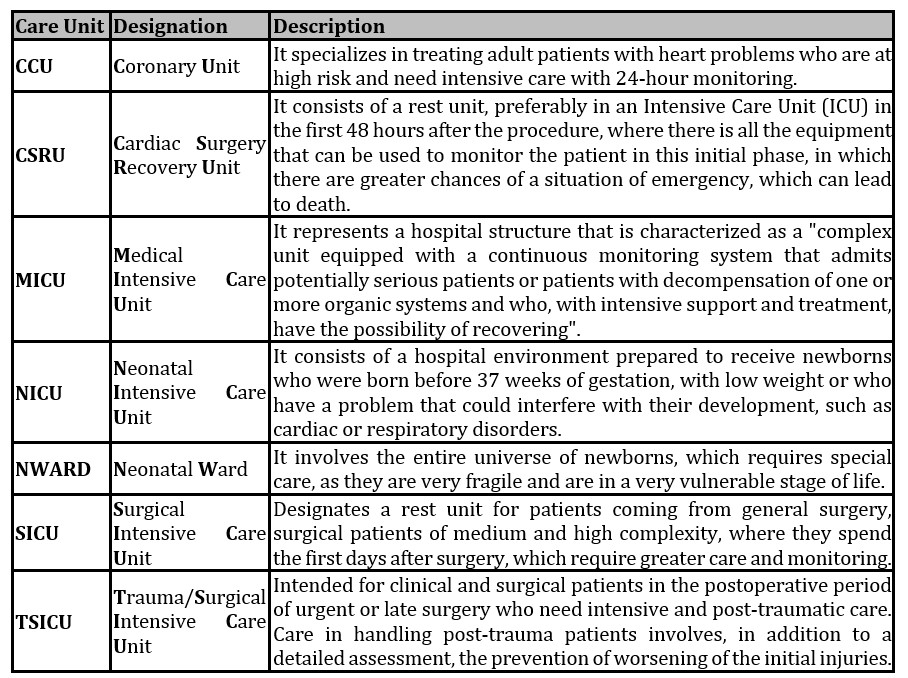
The description of the acronyms of the specialized care units are presented in Table 1.
Then, using the SUBJECT_ID attribute, the connection to the PATIENTS table was made, in order to access information on the patients in question, namely the gender (GENDER) and date of birth (DOB) attributes.
Subsequently, the HADM_ID and SUBJECT_ID attributes were used to access the ADMISSIONS table, which contains information about the patient’s admission. This table allowed collecting information about the type (ADMISSION_TYPE) and place (ADMISSION_LOCATION) of admission, and about the date of death (DEATHTIME).
Pre-processing and Dataset
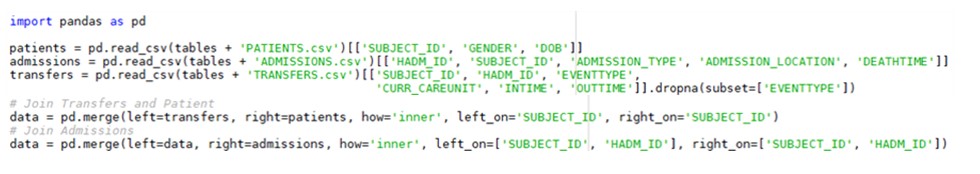
The pre-processing step was implemented in Python. This begins with importing the data, from Excel files, using the pandas library. Then the tables were combined. So, the TRANSFERS table was merged with the PATIENTS table, starting from the SUBJECT_ID. The result of this operation was deposited with the ADMISSIONS table, by HADM_ID, Figure 4.
Fig 4. Importing and joining data in Python
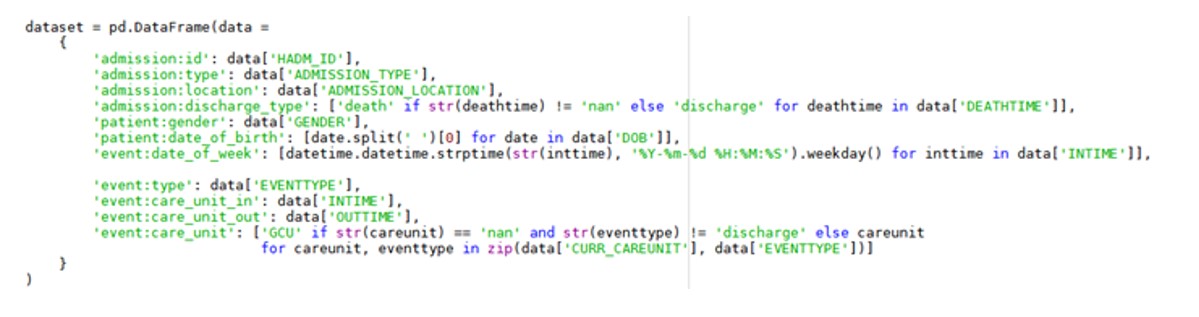
Finally, it was possible to create a dataset, where some data processing was done. As can be seen in Figure 5, an identifier, the type of admission and the type of discharge, were defined for the admission. For the later, it was verified whether the patient’s admission had a date of death, if so, the identification “death” was inserted, otherwise “discharge” was added.
As for the patient, the patient’s gender and date of birth were defined, where the time was removed, as it makes no sense in this type of analysis. For each event, the type was saved and the day of the week on which the event occurred was calculated, based on the date of entry into the unit.
The unit where the patient was, with the date of entry and exit, was also kept. Notice that, in order to complete all care units, where there is no specialty, the acronym GCU was inserted, translated to General Care Unit, unless the type of event is discharge, where it makes no sense to relate the units.
Fig 5. Initial dataset schema
In addition to the pre-processing performed previously, it was necessary to obtain the standard format of the data set to apply the process discovery algorithms. The format consists of 3 types of information:
Case ID: Unique identifier of each process.
Event: Process step, any activity that is part of the process being analyzed.
Timestamp: Date and time of a given event.
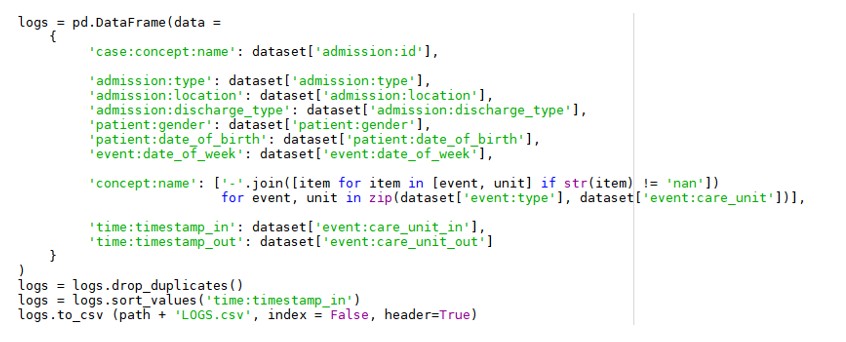
The schema of the final dataset is shown in Figure 6. As you can see, the unique admission identifier was used as the process identifier. For each step of the process, were used the type of event (admission, transfer or discharge) and the care unit.
For the initial and final timestamps of the step, were used the dates of entry and exit from the ward of the care unit.
The extra parameters were the type and place of admission, the type of discharge, through which the patient died or was discharged, the patient’s date of birth, gender and the day of the week in which the event occurred.
Finally, possible duplications resulting from the synchronization of procedures with physical locations were removed. Note that, in order to enable the use of this dataset by the algorithms, it was converted into log format, ordered by initial timestamp.
Fig 6. Final dataset scheme
Process Analysis
To analyze the process, the types of configurations and analysis that the dataset and the Disco tool allow were dissected. Thus, it was considered important to filter by the most common variants of the process, in order to eliminate invalid or punctual cases that exist in the data. However, in this type of application, the difficulties are in understanding which variants are noise, under penalty of eliminating cases of interest for analysis. Notice that a variant consists of a process path, from the initial stage to the final stage. In the process under analysis, there are patients doing a set of steps, but there are others doing other sets.
In relation to the generated model, the available configurations are related to the metrics to be considered in the analysis and to the percentage of steps and connections to show. The tool allows defining the metrics to consider: frequency and performance. Frequency corresponds to the number of occurrences of steps and connections, and performance is measured by the duration of steps and connections. Thus, considering the objectives of this project, the analysis by frequency is the most suitable. As the tool allows the configuration of a second metric to be presented, it was considered of interest to present a performance metric, the average duration of steps and connections.
The percentage of steps and links to be considered, based on the number of occurrences they present, is something that should be used with extreme care. Despite wanting a simple model that allows an optimized analysis, with the most common variants, in a first analysis, cases or variants should not be excluded, otherwise relevant information can be lost.
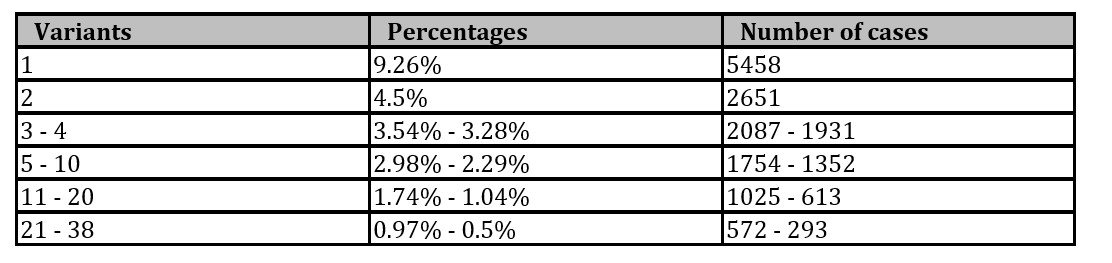
With the configurations defined, the existing variants were analyzed, in order to eliminate the noise and keep only the most relevant to the process model. As can be seen in Table 2, the variants were grouped by percentage for easier observation, as there were 3,936 variants in total. From Table 2 it can be seen that the variants above 0.5% were considered in the analysis.
Table 2: List of process variants
As an analysis of the emergency services is intended, filtering by type of admission makes perfect sense. In this case, the filter will be by Emergency and Urgency. These two values are commonly used together in this type of work (Johnson et al., 2016).
Results
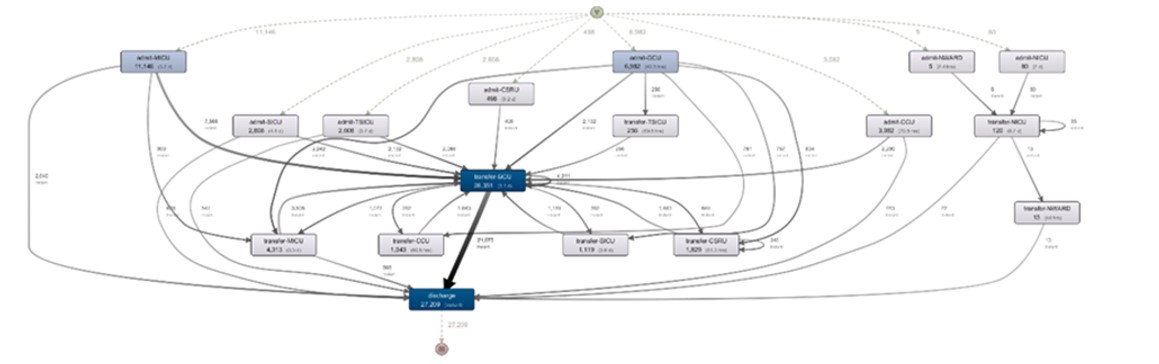
In this section the results of the study are presented. Thus, Figure 7 shows the model generated by Disco, with the configurations previously explained. Since it was given as a priority to encompass all care units and the model was not simplified in order to not miss steps and links that may be of interest, naturally the result is a large model that is difficult to analyze as a whole.
Fig 7. Discovered process model
Thus, for an easier and more effective analysis, the model was analyzed by care unit, based on the different existing admissions. Considering that there are very different areas of action in a hospital, 5 models were built: a model for units that involve heart problems, a model for surgical units, a model for neonatal units, a model for the general intensive care unit and a last one involving admissions that took place in the general unit.
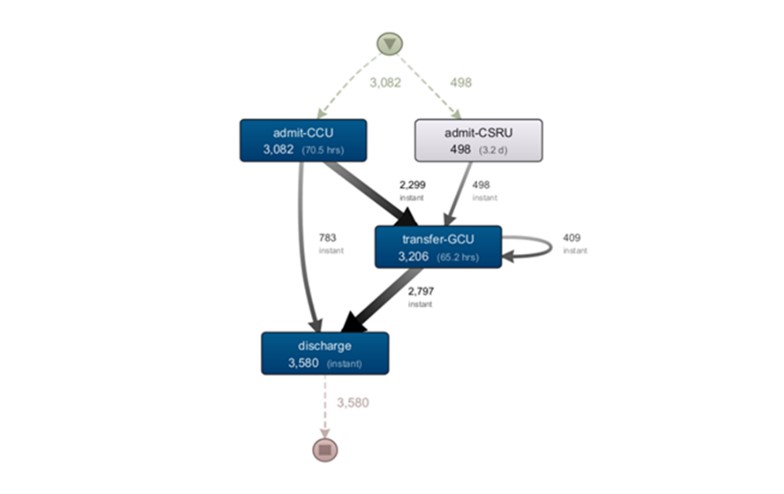
Figure 8 shows the model for units that involve cardiac problems. It can be seen that two units are considered, CCU which is the intensive care unit for cardiac problems and CSRU which is the cardiac surgery recovery unit. Analyzing the model, it can be seen that the CCU unit follows the pattern of the emergency services described above.
In the case of the CSRU, patients always end up passing through the general care unit, presented in the model as ‘transfer-GCU’. This issue is something to be analyzed with the professionals, but it can be explained by the fact that this is a recovery unit where, in the first 48 hours after the procedure, the patient must be monitored with greater care, as this is the phase where there is a greater probability of an emergency situation occurring. Just at that moment, the patient goes to the general unit for a more “independent” rest before being discharged.
Fig 8. Discovered process model of CCU and CSRU units
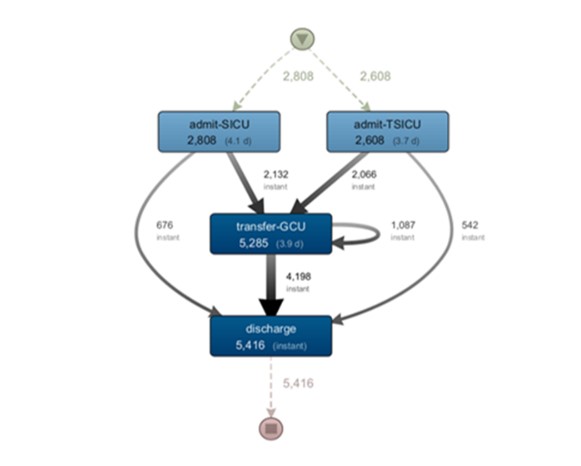
The model represented in Figure 9 presents the flows of units related to surgeries, with SICU being a surgical intensive care unit and TSICU the same unit, but for post-traumatic patients. Analyzing these units, it can be seen that both follow the standard of the emergency service.
Fig 9. Discovered process model of the SICU and TSICU units
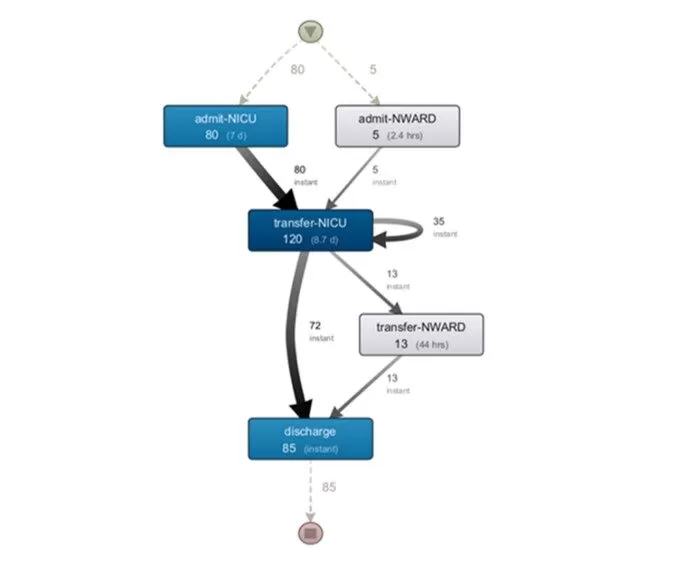
Another area of great importance in health services concerns newborns. It is a universe that requires special care, as they are very fragile and are at a very vulnerable stage of life. Figure 10 shows the functioning and relationship between two units, NICU, which is the neonatal intensive care unit, and NWARD, which is a neonatal ward.
An interesting first analysis of the model is that this is a very specific area, and it is separate from all other units. The NWARD unit may correspond to the general adult sleep unit, GCU.
As for the flows represented in the model, a fundamental difference can be seen. Newborns, regardless of the unit they are admitted to, always go through the intensive care unit, although there are only five registered cases admitted by the general ward. This situation is something that must be analyzed with <professionals, as it will be something that generates an increase in occupation in that unit. After being transferred to the intensive care unit, the flow is similar to adults, and the patient can be discharged or still go through the neonatal ward.
Fig 10. Discovered process model of NICU and NWARD units
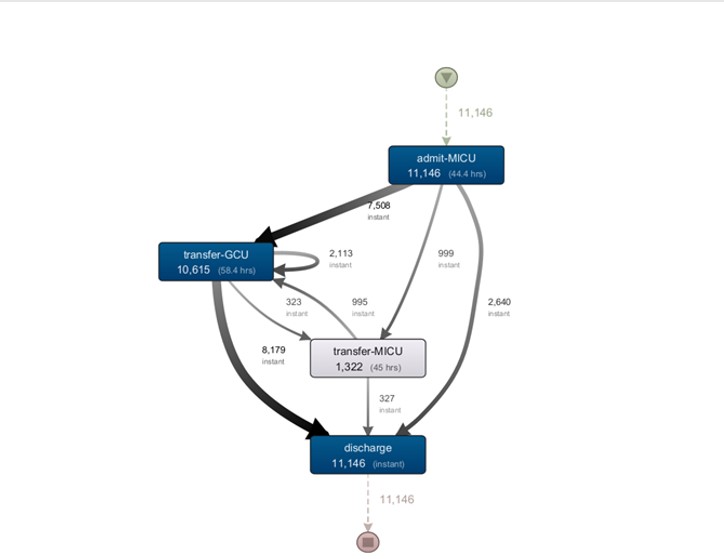
Finally, relatively to general cases and without a related specialty, Figure 11 shows the model of the medical intensive care unit, MICU. In this discovery, there is a visible pattern for this type of service.
In a more detailed analysis, there is a high number of a loop in the GCU step, which shows a high number of exchanges within the unit itself. This means bed changes in the unit. This event may be exposing to poor bed planning, something to be reviewed with professionals in this area. It should also be noted that this was the unit that registered the highest number of admissions.
Fig 11. Discovered process model of the MICU unit
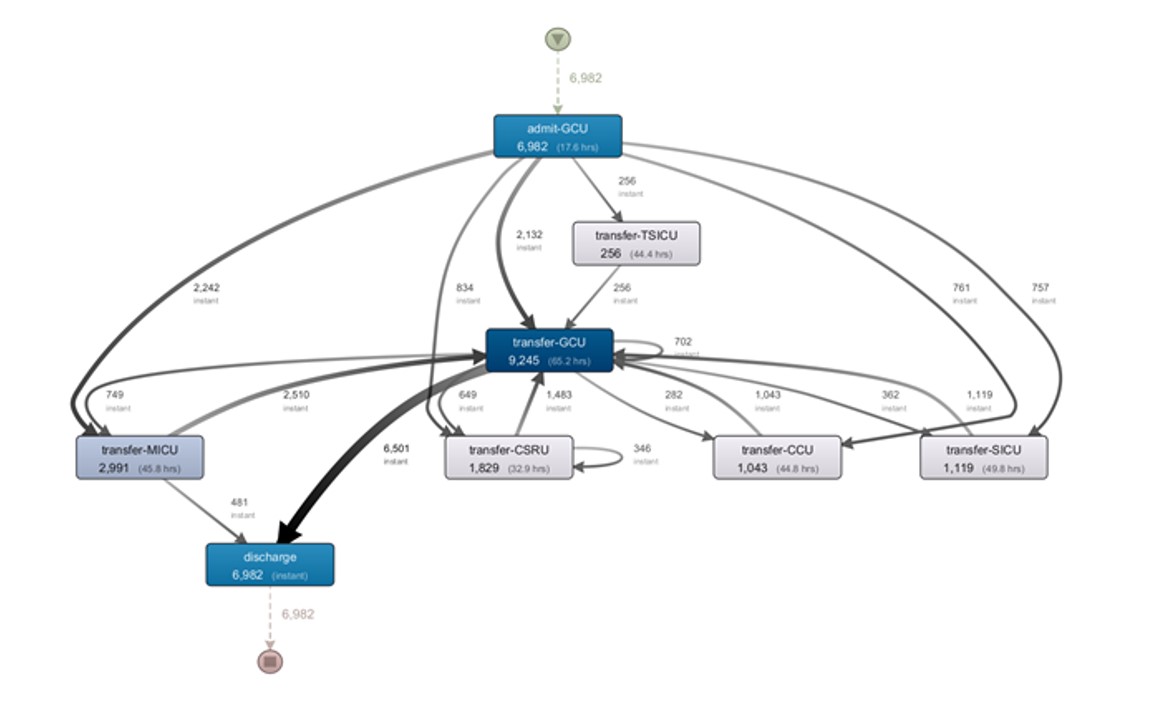
Analyzing admissions to the general unit, by the model shown in Figure 12, it is clear that patients who are admitted to the general unit are afterwards referred to a specialty. The exception is possibly the most complex cases, which are referred to the therapy unit intensive care, and the less severe cases that, after passing through the general unit, are discharged.
In an analysis of the cases that went to specialties, it is clear that all of them passed through the general unit before being discharged. It is something to be analyzed with the professionals, as it will cause an increase in the occupation of beds.
Fig 12. Discovered process model of the GCU unit
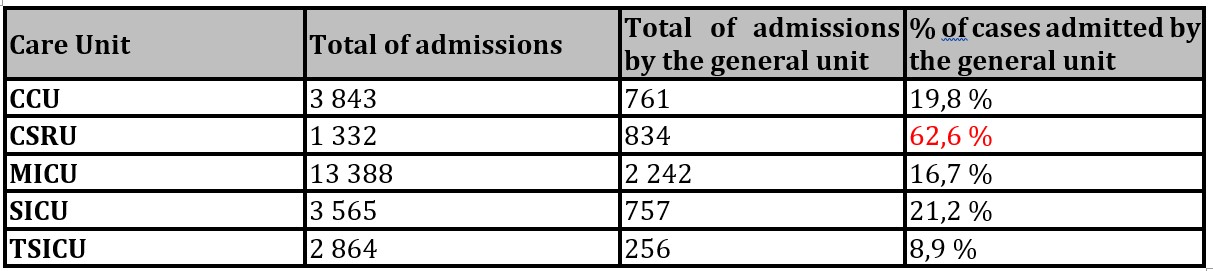
Also related to the previous model, there is an analysis of high importance that must be done that compares the cases admitted by the general unit that are subsequently referred to the specialty and the admissions made directly by the specialty. This result can be analyzed in Table 3. The CSRU unit stands out, where most cases enter through the general unit. This fact should be reviewed in this unit.
Table 3: Percentage of admissions by the general unit
Conclusions and future work
The results obtained through this work provide models that allowed analyzing the real functioning of each care unit. With that, it is possible to draw conclusions regarding its management, as well as its resources, with the professionals of each unit. The conclusions are:
Most care units follow the standard of the emergency service, which is a good indicator of management and planning.
Some units have a high number of bed changes, which may indicate poor planning of this resource.
Newborns, regardless of the unit they are admitted to, always go through the intensive care unit. This aspect being creates a natural increase in the number of beds used.
The patients admitted to the general unit who move to specialty end up returning to the general unit before being discharged. This situation may be causing an increase in the occupancy of beds in this unit as well. It would be interesting to review the criteria for direct discharge or follow-up before discharge with the unit’s professionals.
There are units with more cases that were hospitalized by the general unit than by the specialty, showing poor management of admissions in these units.
In this work, it was possible to figure out the difficulty of working with real data when related to human beings, due to the safety and protection of their data. In this sense, this study is presented as an example of the benefits of using Process Mining, to give confidence to possible sources of information in this area, for the application of these practices in real data.
Thus, for future work, it is intended to apply this technique in real data, with the objective of implementing and validating, in a real environment, the flow of work used in this project.
Acknowledgments
This work is funded by National Funds through the FCT – Foundation for Science and Technology, IP, within the scope of the project Ref UIDB/05583/2020. Furthermore, we would like to thank the Research Center in Digital Services (CISeD), the Polytechnic of Viseu for their support.
This work is also funded by National Funds through the FCT – Foundation for Science and Technology, IP, within the scope of the project Refª UIDB/05507/2020. Furthermore, we would like to thank the Center for Studies in Education and Innovation (CI&DEI) and the Polytechnic of Viseu for their support.
References
Azeredo, T. R. M., Guedes, H. M., Rebelo de Almeida, R. A., Chianca, T. C. M., & Martins, J. C. A. (2015). Efficacy of the manchester triage system: A systematic review. International Emergency Nursing, 23(2), 47–52. https://doi.org/10.1016/j.ienj.2014.06.001
Bárrios, M. J., Marques, R., & Fernandes, A. A. (2020). Aging with health: aging in place strategies of a Portuguese population aged 65 years or older. Revista de Saude Publica, 54, 129. https://doi.org/10.11606/s1518-8787.2020054001942
Batista, E., & Solanas, A. (2019). Process mining in healthcare: A systematic review. 2018 9th International Conference on Information, Intelligence, Systems and Applications, IISA 2018, 1–6. https://doi.org/10.1109/IISA.2018.8633608
Gomes, A., Lacerda, A., & Fialho, J. (2021a). Comparative Analysis of Process Mining Tools. Accepted for Publishing in CAPSI 2021.
Gomes, A.F.D., de Lacerda, A.C.W.G., da Silva Fialho, J.R. (2021b). Comparative Analysis of Process Mining Algorithms in Python. In: Pires, I.M., Spinsante, S., Zdravevski, E., Lameski, P. (eds) Smart Objects and Technologies for Social Good. GOODTECHS 2021. Lecture Notes of the Institute for Computer Sciences, Social Informatics and Telecommunications Engineering, vol 401. Springer, Cham. https://doi.org/10.1007/978-3-030-91421-9_3
Gomes, A.F.D., de Lacerda, A.C.W.G., da Silva Fialho, J.R. (2022). Comparative Analysis of Process Mining Algorithms in Process Discover. In: de Paz Santana, J.F., de la Iglesia, D.H., López Rivero, A.J. (eds) New Trends in Disruptive Technologies, Tech Ethics and Artificial Intelligence. DiTTEt 2021. Advances in Intelligent Systems and Computing, vol 1410. Springer, Cham. https://doi.org/10.1007/978-3-030-87687-6_25
Hendricks, R. (2019). Process Mining of Incoming Patients with Sepsis. Online Journal of Public Health Informatics, 11(2). https://doi.org/10.5210/ojphi.v11i2.10151
Johnson, A. E. W., Pollard, T. J., Shen, L., Lehman, L. W. H., Feng, M., Ghassemi, M., Moody, B., Szolovits, P., Anthony Celi, L., & Mark, R. G. (2016). MIMIC-III, a freely accessible critical care database. Scientific Data, 3, 1–9. https://doi.org/10.1038/sdata.2016.35
Kurniati, A. P., Hall, G., Hogg, D., & Johnson, O. (2018). Process mining in oncology using the MIMIC-III dataset. Journal of Physics: Conference Series, 971(1). https://doi.org/10.1088/1742-6596/971/1/012008
L’Heureux, A., Grolinger, K., Elyamany, H. F., & Capretz, M. A. M. (2017). Machine Learning with Big Data: Challenges and Approaches. IEEE Access, 5, 7776–7797. https://doi.org/10.1109/ACCESS.2017.2696365
Lohmann, N. M. (2012). Disco Discover Your Processes. Proceedings, September.
Mans, R. S., Aalst, W. M. P. Van Der, & Vanwersch, R. J. B. (2015). Process Mining in the Healthcare.
Mbassegue, P., Escandon-Quintanilla, M. L., & Gardoni, M. (2016). Knowledge management and big data: Opportunities and challenges for small and medium enterprises (SME). IFIP Advances in Information and Communication Technology, 492, 22–31. https://doi.org/10.1007/978-3-319-54660-5_3
Rojas, E., Cifuentes, A., Burattin, A., Munoz-Gama, J., Sepúlveda, M., & Capurro, D. (2019). Performance analysis of emergency room episodes through process mining. International Journal of Environmental Research and Public Health, 16(7). https://doi.org/10.3390/ijerph16071274
Sakellarides, C. (2020). National health service: Responding to current challenges through necessary transformations. Acta Medica Portuguesa, 33(2), 133–142. https://doi.org/10.20344/amp.12626
Van Der Aalst, W. (2012). Process mining: Overview and opportunities. ACM Transactions on Management Information Systems, 3(2), 1–17. https://doi.org/10.1145/2229156.2229157
Yousefi, M., & Yousefi, M. (2020). Human resource allocation in an emergency department: A metamodel-based simulation optimization. Kybernetes, 49(3), 779–796. https://doi.org/10.1108/K-12-2018-0675